. 2003 Apr 14;161(1):197-209.
doi: 10.1083/jcb.200208145.

Binding to EGF receptor of a laminin-5 EGF-like fragment liberated during MMP-dependent mammary gland involution

Affiliations

Binding to EGF receptor of a laminin-5 EGF-like fragment liberated during MMP-dependent mammary gland involution

Susann Schenk et al. J Cell Biol. .

Abstract

Extracellular matrix (ECM) fragments or cryptic sites unmasked by proteinases have been postulated to affect tissue remodeling and cancer progression. Therefore, the elucidation of their identities and functions is of great interest. Here, we show that matrix metalloproteinases (MMPs) generate a domain (DIII) from the ECM macromolecule laminin-5. Binding of a recombinant DIII fragment to epidermal growth factor receptor stimulates downstream signaling (mitogen-activated protein kinase), MMP-2 gene expression, and cell migration. Appearance of this cryptic ECM ligand in remodeling mammary gland coincides with MMP-mediated involution in wild-type mice, but not in tissue inhibitor of metalloproteinase 3 (TIMP-3)-deficient mice, supporting physiological regulation of DIII liberation. These findings indicate that ECM cues may operate via direct stimulation of receptor tyrosine kinases in tissue remodeling, and possibly cancer invasion.


Figures
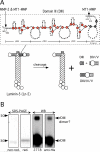
Figure 1.
Figure 1.
Characterization of DIII of Ln-5 γ2-chain. (A) Schematic depiction of DIII. rDIII encompasses the most COOH-terminal 3.5 EGF-like repeats (γ2III5, 4, 3, and COOH-terminal part of 2) of rat Ln-5 γ2-chain DIII. Six cysteines (filled circles) highlight the EGF-like domain signature, and the LE repeat signature is characterized by eight cysteines and an additional loop. The position of rDIII within the Ln-5 cruciform structure and the products of MMP cleavage are shown. (B) Characterization of rDIII using SDS-PAGE and WB. In SDS-PAGE (two left panels), rDIII resolved as a single band under both nonreducing and reducing conditions. Purified rDIII was judged to be better than 95% homogenous by Coomassie blue staining. In WB of reducing PAGE (two right panels), the rDIII band was recognized by both 2778 and anti-His-tag, as expected. A much fainter, higher mol wt band was also visible, which is likely dimerized rDIII. The apparent mol wt was calculated based on pre-stained mol wt standard SeeBlue® (Invitrogen).
Figure 2.
Figure 2.
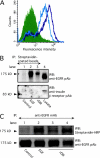
Binding of rDIII to EGFR. (A) rDIII binding to cell surfaces detected by flow cytometry. MDA-MB-231 cells were incubated with 4.5 (open black histogram) or 2 μM (open gray) rDIII or control rabbit IgG (filled), followed by 2778, and the appropriate Alexa®-conjugated secondary antibody. (B) Recovery of biotin–rDIII–EGFR complexes with streptavidin-coated beads. 1.5 μM biotinylated rDIII or 0.75 μM EGF was incubated with MDA-MB-231 cells, followed by cross-linking with BS3. After detergent solubilization, cell lysates were precipitated with streptavidin-coated beads. WB of adsorbed material with EGFR pAb (top) detected a distinct band of 175 kD in samples containing rDIII (lane 3) or EGF (lane 2), but not in control samples (lane 1, no ligand). To control for EGFR expression and specificity of cross-linking to EGFR, total MDA-MB-231 cell lysates were loaded in lane 4 and stripped blots were treated with anti-insulin receptor β antibody (bottom), respectively. (C) Immunoprecipitation of biotin–rDIII–EGFR complexes with antibodies to EGFR. Cells were treated with biotinylated rDIII or EGF and BS3, and cell lysates were immunoprecipitated with EGFR mAb. Samples were analyzed by WB using streptavidin-HRP and ECL. A distinct band at 175 kD was visible for samples containing EGF (lane 2, 0.75 μM) or rDIII (lane 3, 1.0 μM, and lane 4, 1.5 μM; top). There is no corresponding band in the control lane (lane 1; no ligand). Note, the resolution of the gradient gels used is not sufficient to distinguish between EGF or rDIII bound to EGFR, where the former would be expected to run at ∼180 kD and the latter at ∼195 kD. To ensure equal loading in each lane, the filter was stripped and reprobed with EGFR pAb (bottom).
Figure 3.
Figure 3.
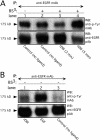
Induction of EGFR tyrosine phosphorylation by rDIII. (A) Incubation of MDA-MB-231 cells with 185 nM rDIII for 5 min (lane 4, top) stimulated phosphorylation of EGFR. There is no EGFR stimulation for the 2-min rDIII sample (lane 3), or the 5-min no ligand control (lane 1). To exclude nonspecific effects due to cross-linking, cells were exposed to BS3 in the absence of ligand (lane 2). To ensure that equal amounts of EGFR protein were loaded, blots were stripped and reprobed with EGFR pAb (bottom). (B) EGFR phosphorylation by 185 nM rDIII (lane 1, top) and 1.7 nM EGF (lane 2) for 5 min in the absence of BS3. For control, ligand was omitted (lane 3), and the loading controls are shown in the bottom panel.
Figure 4.
Figure 4.
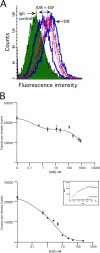
Competitive binding of rDIII and EGF. (A) Flow cytometry. MDA-MB-231 cells were incubated with 2.00 μM rDIII, in the presence of increasing concentrations of EGF (0.45, 0.85, 1.25, and 2.00 μM). rDIII binding to the cell surface was detected with anti-His tag and Alexa® 488 antibodies. The fluorescence signal for rDIII gradually decreases with increasing EGF concentrations. (B) Displacement of cell surface-bound I125-EGF by rDIII. MDA-MB-231 cells were incubated with I0.5 nM 125-EGF and increasing concentrations of cold rDIII (top) or EGF (bottom). The 0.5 nM (≈0.15 μCi) working concentration of I125-EGF was determined by calculating the specific binding of I125EGF (“specific”) based on total and nonspecific binding of I125-EGF to MDA-MB-231 cells (inset in bottom panel). Cells were incubated with increasing concentrations of I125-EGF in the absence (total binding; “total”) or presence of an excess amount (330 nM) of unlabeled EGF (nonspecific binding; “nonspecific”).
Figure 5.
Figure 5.
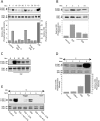
Stimulation of ERK1/2 phosphorylation by rDIII. Time course of ERK1/2 activation after exposure to rDIII. Before lysate preparation, MCF-7 (A) or MDA-MB-231 (B) cells were treated with rDIII for the indicated time periods at 37°C. The ratio of phosphorylated ERK1/2 bands (P-ERK1/2, top panels) to total ERK1/2 protein bands (ERK1/2, bottom panels) was quantified. The control signal (no ligand) was set to 1 and the relative ERK phosphorylation intensity calculated and depicted as bar graphs (bottom panels). (A) ERK phosphorylation was performed with two distinct, purified preparations of rDIII protein (Prep. A and Prep. B). (B) One representative experiment and the mean ± SD (n = 3) of relative ERK1/2 phosphorylation intensity is depicted. ERK1/2 activation induced by EGF (C) but not by control protein rDIII-V (D). MCF-7 cells were stimulated with EGF (C) for up to 30 min or with rDIII, rDIII-V or EGF for 5 min and phosphorylated ERK1/2 were detected as described in the legend to A. As compared with rDIII (lane 3, D) and EGF (lane 4, D,) no phosphorylation signal above control level (lane 1, D) was seen with rDIII-V (lane 2, D). (E) Dependency of ERK1/2 activation on EGFR. Before stimulation for 5 min with either rDIII (lane 5) or EGF (lane 2), MCF-7 cells were preincubated with either AG1478 or 528. Both EGFR inhibitors diminish phosphorylation of ERK1/2 (top panel) by rDIII (lanes 6 and 7) or EGF (lanes 3 and 4). The top bands (∼25 kD) in lane 4 (EGF + 528) and 7 (rDIII + 528) originates from the IgG light chain of 528. The total amount of loaded ERK1/2 protein is shown in the bottom panel.
Figure 6.
Figure 6.
Induction of EGFR tyrosine phosphorylation by intact Ln-5. Treatment of MDA-MB-231 cells with 1.7 nM EGF for 10 min at 37°C results in significant phosphorylation of 175 kD EGFR (lane 2, left panels) over control (lane 1, no ligand), whereas 2.5 nM purified Ln-5 causes only weak EGFR phosphorylation (lane 3). Stimulation of cells for 90 min (right panels) with Ln-5 (lane 3) results in an EGFR phosphorylation signal well above control (lane 1). In contrast, incubation of cells for 90 min in the presence of EGF (lane 2) diminished the signal toward background level (lane 1).
Figure 7.
Figure 7.
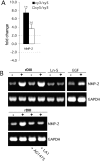
Effects of rDIII on gene expression. (A) Microarray hybridization. Amplified RNA prepared from MCF-7 cells was cultured in the presence (cy3) or absence (cy5) of rDIII and cohybridized to the microarray containing 83 human cDNAs related to cancer cell metastasis (filled histogram). The open histogram represents RNA isolates where the cy3 and cy5 labels were switched. Ratios below 1.0 were inverted and multiplied by −1 to aid in their interpretation. The MMP-2 gene expression signal exceeded a twofold signal intensity change threshold, independent of the dye label orientation. Results are expressed as the mean ± SD from six fluorescence signals. (B) Semi-quantitative RT-PCR. Changes in MMP-2 expression were assessed on the influence of 185 nM rDIII, 2.5 nM Ln-5, or 0.17 nM EGF, with or without AG1478 or LA1. DMSO was added to the controls. As a control for normalization, GAPDH was amplified similarly to MMP-2. Amplified cDNAs of MMP-2 (504 bp) and GAPDH (516 bp) were resolved by agarose gel electrophoresis and visualized by ethidium bromide staining.
Figure 8.
Figure 8.
Breast cell migration stimulated by rDIII. (A) Micrographs of the lower surfaces of Transwell filters after migration of MDA-MB-231 (a–c), MCF-7 (d–f), or MCF10A (g–i) cells on coated Ln-5. The micrographs a, d, and g show migration on coated Ln-5 only. rDIII was added at increasing concentrations to the bottom (MDA-MB-231, 6 nM, b and 12 nM, c) or top chambers (MCF-7, 70 nM, e 185 nM, f and MCF10A, 70 nM, h and 460 nM, i). The magnification used to count and photograph migrated cells may differ between cell lines and assays depending on how heavily cells migrated. The results are summarized in the corresponding bar graphs. MDA-MB-231: *p (b and a) = 0.0044, **p (c and a) = 2.18E-08, ANOVA p = 6.38E-08; MCF-7: *p (e and d) = 2.96E-07, **p (f and d) = 3.07E-11, ANOVA p = 2.36E-16; MCF10A: *p (h and g) = 6.94E-07, **p (i and g) = 1.41E-07, ANOVA p = 3.43E-11. Micrographs shown are representative for several independent experiments. (B) Migration of MDA-MB-231 cells on coated Ln-5 challenged with rDIII. The effect of rDIII or EGF on MDA-MB-231 cell migration in the absence and presence of LA1, as well as constitutive migration on Ln-5 (in the absence of any stimuli) and its dependency on EGFR is depicted. Note that if membranes were not coated with Ln-5, MDA-MB-231 cells did not migrate at all (not depicted). To normalize values, each data point (cell number migrated per well) was divided by the average cell number migrated per well that was determined for Ln-5 (relative cell migration). Average cell number of Ln-5 was set to 1. Values in bar graphs represent the mean ± SD of at least three independent experiments. No change detected in 5 out of 5 assays with *p (b and a) = 0.97 - 0.16 (null- hypothesis confirmed). Statistically significant changes were found in ** 7 out of 8, *** 3 out of 3, **** 3 out of 3 and ***** 3 out of 4 assays with **p (c and a) = 1.9E-06 – 0.0147; ***p (d and c) = 8.8E-07 – 3.6E-06; ****p (e and a) = 1.37E-06 – 1.6E-05; *****p (f and e) = 8.4E-06 – 2.2E-05. (C) DIII is a cleavage product of Ln-5 and is detectable in conditioned medium of human MCF10A cells. WB of MMP-2 cleaved Ln-5 and concentrated conditioned medium were detected with 2778 (lanes 1–6), or D4B5 (lane 7). The bottom and top WBs are identical, except that the bottom panels are overexposed, depicting DIII more clearly. Cleavage of Ln-5 with MMP-2 for 2 h (lane 3), 17 h (lane 4), and 24 h (lane 5) results in the appearance of the γ80 chain, DIII-V, and DIII. In conditioned medium from MCF10A cells DIII is detectable using both 2778 (lane 6) and D4B5 (lane 7). For comparison, purified, non-MMP treated Ln-5, which is mainly composed of the γ140 and γ100 chains, was loaded in lane 2 and rDIII in lane 1. (D) Stimulated migration of MMP-2 cleaved Ln-5 depends on EGFR. MCF10A cells were allowed to migrate on Transwell membranes, which were coated with either uncleaved (top panels; −MMP-2) or MMP-2-cleaved Ln-5 (bottom panels; +MMP-2). Cells remained untreated (left panels, Ln-5), or were treated with LA1 for 30 min before seeding. LA1 was added where indicated (right panels, +LA1). The corresponding bar graph is shown with *p (b and a) = 0.0030; **p (c and a) = 7.27E-05; ***p (d and a) = 0.1333 and ***p (d and c) = 1.39E-05.
Figure 8.
Figure 8.
Breast cell migration stimulated by rDIII. (A) Micrographs of the lower surfaces of Transwell filters after migration of MDA-MB-231 (a–c), MCF-7 (d–f), or MCF10A (g–i) cells on coated Ln-5. The micrographs a, d, and g show migration on coated Ln-5 only. rDIII was added at increasing concentrations to the bottom (MDA-MB-231, 6 nM, b and 12 nM, c) or top chambers (MCF-7, 70 nM, e 185 nM, f and MCF10A, 70 nM, h and 460 nM, i). The magnification used to count and photograph migrated cells may differ between cell lines and assays depending on how heavily cells migrated. The results are summarized in the corresponding bar graphs. MDA-MB-231: *p (b and a) = 0.0044, **p (c and a) = 2.18E-08, ANOVA p = 6.38E-08; MCF-7: *p (e and d) = 2.96E-07, **p (f and d) = 3.07E-11, ANOVA p = 2.36E-16; MCF10A: *p (h and g) = 6.94E-07, **p (i and g) = 1.41E-07, ANOVA p = 3.43E-11. Micrographs shown are representative for several independent experiments. (B) Migration of MDA-MB-231 cells on coated Ln-5 challenged with rDIII. The effect of rDIII or EGF on MDA-MB-231 cell migration in the absence and presence of LA1, as well as constitutive migration on Ln-5 (in the absence of any stimuli) and its dependency on EGFR is depicted. Note that if membranes were not coated with Ln-5, MDA-MB-231 cells did not migrate at all (not depicted). To normalize values, each data point (cell number migrated per well) was divided by the average cell number migrated per well that was determined for Ln-5 (relative cell migration). Average cell number of Ln-5 was set to 1. Values in bar graphs represent the mean ± SD of at least three independent experiments. No change detected in 5 out of 5 assays with *p (b and a) = 0.97 - 0.16 (null- hypothesis confirmed). Statistically significant changes were found in ** 7 out of 8, *** 3 out of 3, **** 3 out of 3 and ***** 3 out of 4 assays with **p (c and a) = 1.9E-06 – 0.0147; ***p (d and c) = 8.8E-07 – 3.6E-06; ****p (e and a) = 1.37E-06 – 1.6E-05; *****p (f and e) = 8.4E-06 – 2.2E-05. (C) DIII is a cleavage product of Ln-5 and is detectable in conditioned medium of human MCF10A cells. WB of MMP-2 cleaved Ln-5 and concentrated conditioned medium were detected with 2778 (lanes 1–6), or D4B5 (lane 7). The bottom and top WBs are identical, except that the bottom panels are overexposed, depicting DIII more clearly. Cleavage of Ln-5 with MMP-2 for 2 h (lane 3), 17 h (lane 4), and 24 h (lane 5) results in the appearance of the γ80 chain, DIII-V, and DIII. In conditioned medium from MCF10A cells DIII is detectable using both 2778 (lane 6) and D4B5 (lane 7). For comparison, purified, non-MMP treated Ln-5, which is mainly composed of the γ140 and γ100 chains, was loaded in lane 2 and rDIII in lane 1. (D) Stimulated migration of MMP-2 cleaved Ln-5 depends on EGFR. MCF10A cells were allowed to migrate on Transwell membranes, which were coated with either uncleaved (top panels; −MMP-2) or MMP-2-cleaved Ln-5 (bottom panels; +MMP-2). Cells remained untreated (left panels, Ln-5), or were treated with LA1 for 30 min before seeding. LA1 was added where indicated (right panels, +LA1). The corresponding bar graph is shown with *p (b and a) = 0.0030; **p (c and a) = 7.27E-05; ***p (d and a) = 0.1333 and ***p (d and c) = 1.39E-05.
Figure 9.
Figure 9.
Detection of DIII in lysates of mammary gland tissue. Mammary lysates were resolved on a 4–12% Bis-Tris gradient gel in MES buffer under reducing conditions. D4B5 detected a distinct band of ∼20 kD that very likely is DIII (top panel). In contrast to WT, DIII could be found at day 10 of lactation as well as at day 1 of involution in TIMP-3–null (−/−) tissue. After day 1 of involution, DIII was detectable at all time points of involution in both the involuting and lactating mice (day 2–7 of involution). Stripping and reprobing the blot with 2778 revealed unscheduled fragmentation of Ln-5 γ2 chain (bottom panel). Fragmentation occurred in −/− 1 d earlier than in WT mammary glands (day 1 of involution, WT, −/−). The exact identity of the various fragments in the range of 30–100 kD is not known. The Ln-5 γ2 chain profile at day 10 of lactation as well as at day 7 of involution does not differ between WT and −/− tissue, when detected with 2778 (not depicted). To ensure equal loading in each lane, blots were stripped and reprobed with Actin mAb (MAB 1501, CHEMICON International; middle panel).

Similar articles

Cited by

References

    1. Belkin, A.M., and M.A. Stepp. 2000. Integrins as receptors for laminins. Microsc. Res. Tech. 51:280–301. - PubMed
    1. Bilban, M., L.K. Buehler, S. Head, G. Desoye, and V. Quaranta. 2002. Normalizing DNA microarray data. Curr. Issues. Mol. Biol. 4:57–64. - PubMed
    1. Borradori, L., and A. Sonnenberg. 1999. Structure and function of hemidesmosomes: more than simple adhesion complexes. J. Invest. Dermatol. 112:411–418. - PubMed
    1. Chen, Z., T.B. Gibson, F. Robinson, L. Silvestro, G. Pearson, B. Xu, A. Wright, C. Vanderbilt, and M.H. Cobb. 2001. MAP Kinases. Chem. Rev. 101:2449–2476. - PubMed
    1. Csordas, G., M. Santra, C.C. Reed, I. Eichstetter, D.J. McQuillan, D. Gross, M.A. Nugent, G. Hajnoczky, and R.V. Iozzo. 2000. Sustained down-regulation of the epidermal growth factor receptor by decorin. A mechanism for controlling tumor growth in vivo. J. Biol. Chem. 275:32879–32887. - PubMed

Publication types

MeSH terms

Substances