

Distribution and densitometry mapping of L1-CAM immunoreactivity in the adult mouse brain--light microscopic observation
- PMID: 12697052
- PMCID: PMC155647
- DOI: 10.1186/1471-2202-4-7
Distribution and densitometry mapping of L1-CAM immunoreactivity in the adult mouse brain--light microscopic observation
Abstract
Background: The importance of L1 expression in the matured brain is suggested by physiological and behavioral studies showing that L1 is related to hippocampal plasticity and fear conditioning. The distribution of L1 in mouse brain might provide a basis for understanding its role in the brain.
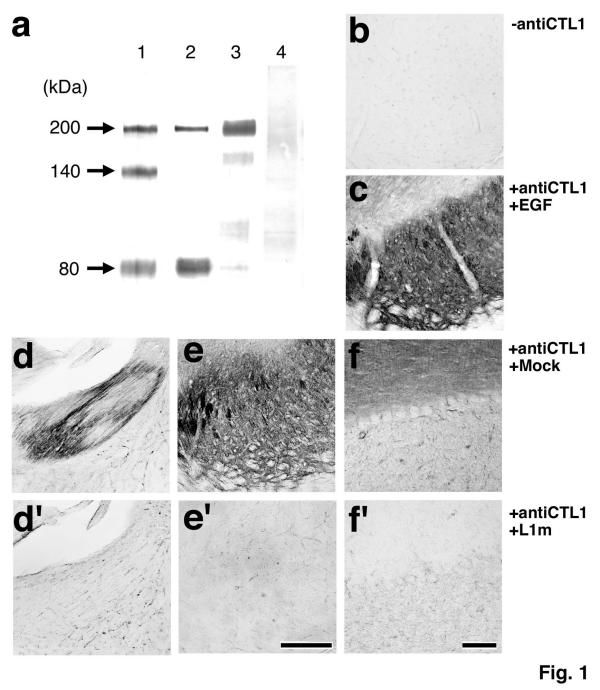
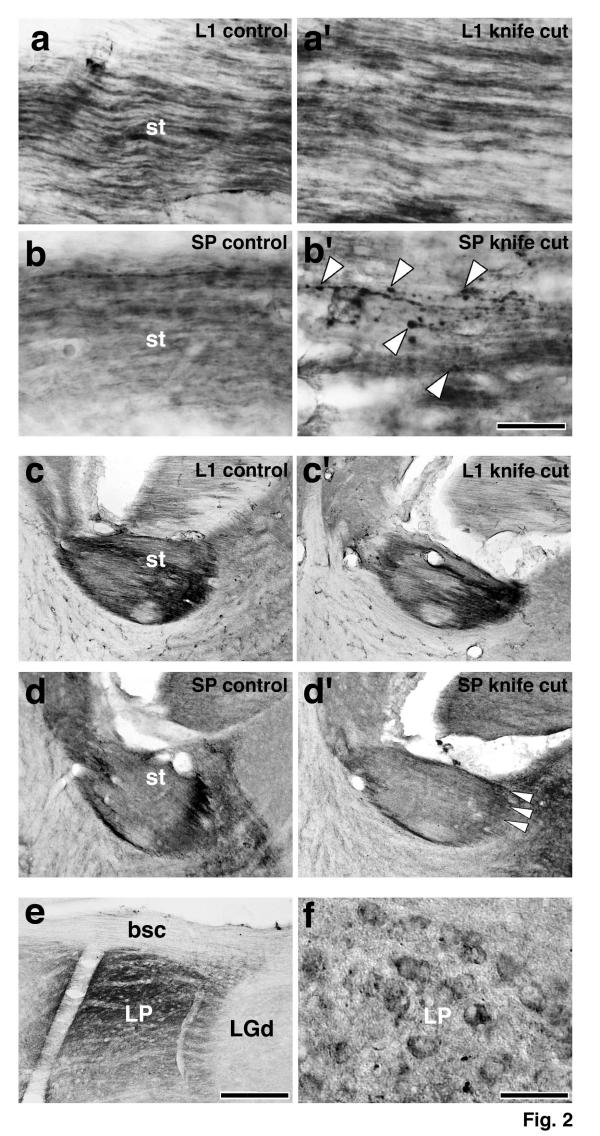
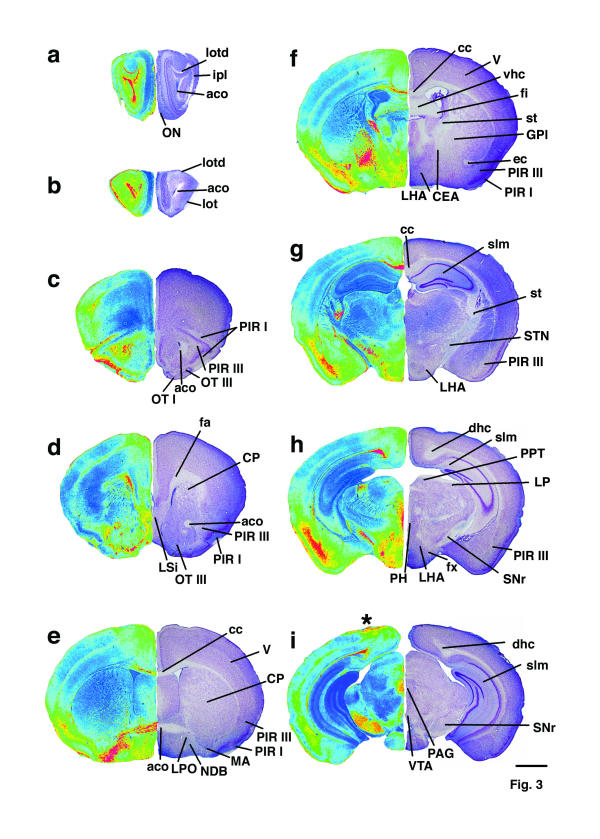
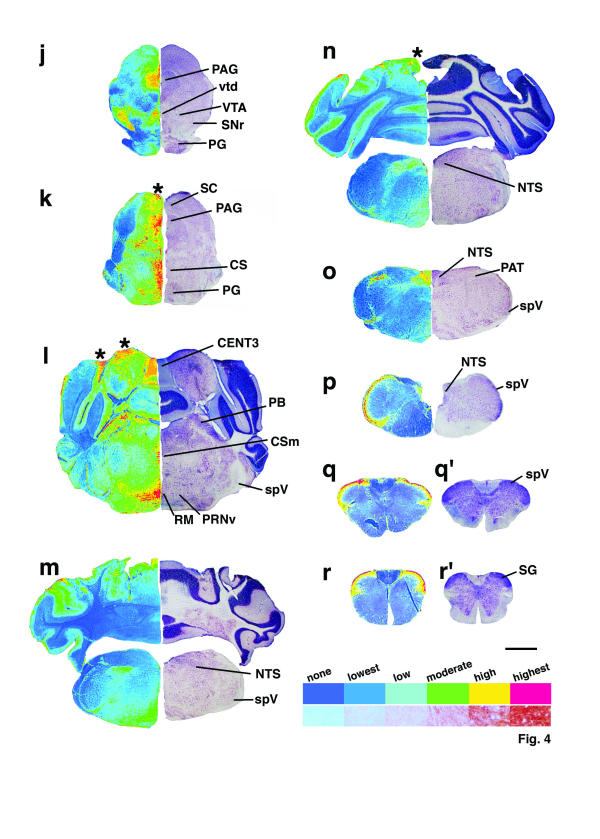
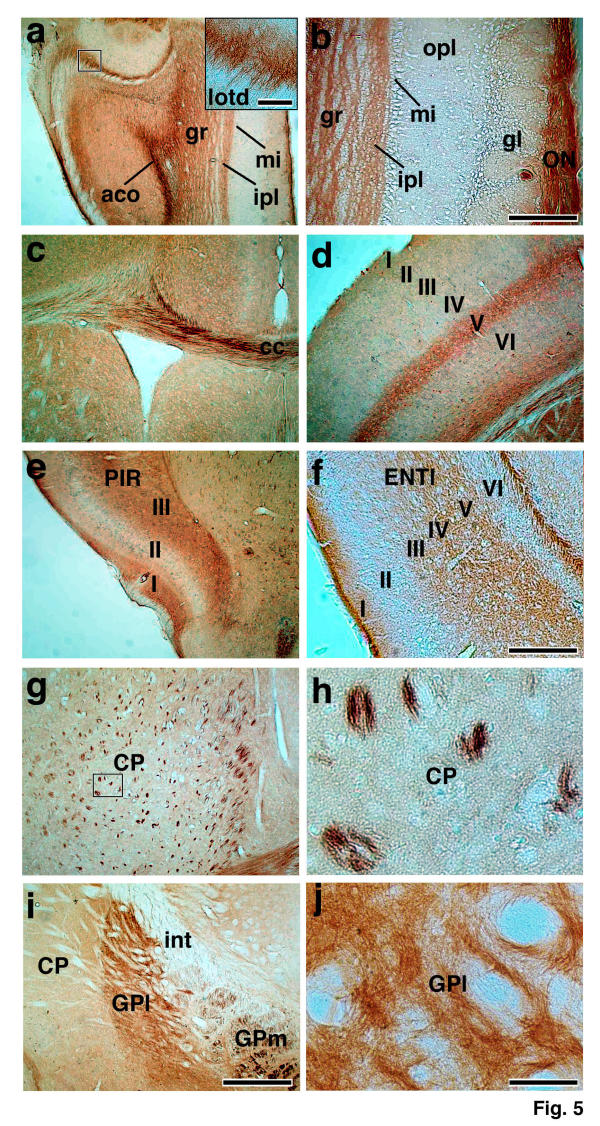
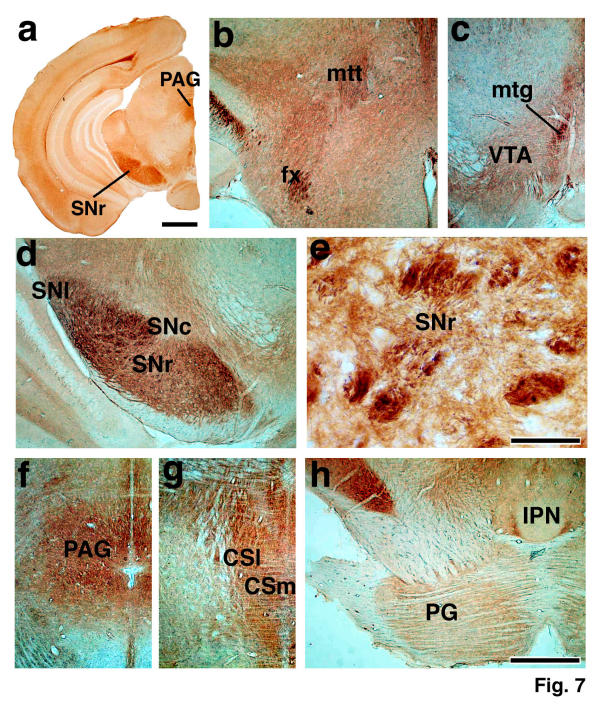
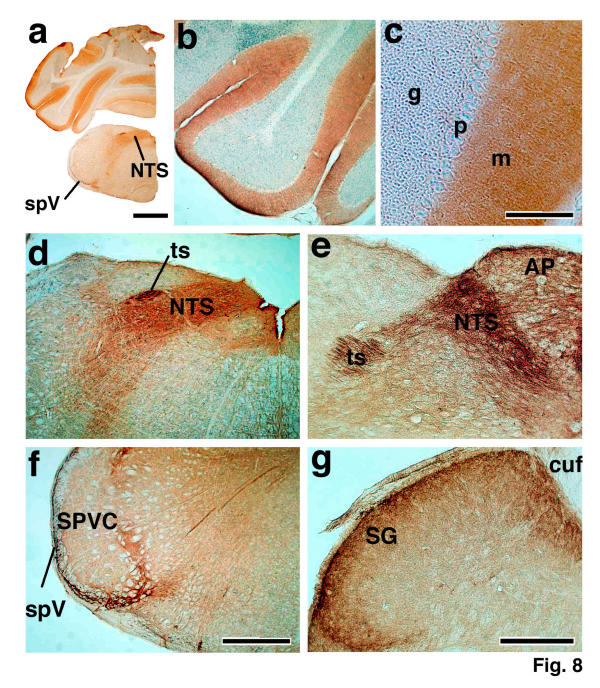
Results: We examined the overall distribution of L1 in the adult mouse brain by immunohistochemistry using two polyclonal antibodies against different epitopes for L1. Immunoreactive L1 was widely but unevenly distributed from the olfactory bulb to the upper cervical cord. The accumulation of immunoreactive L1 was greatest in a non-neuronal element of the major fibre bundles, i.e. the lateral olfactory tract, olfactory and temporal limb of the anterior commissure, corpus callosum, stria terminalis, globus pallidus, fornix, mammillothalamic tract, solitary tract, and spinal tract of the trigeminal nerve. High to highest levels of non-neuronal and neuronal L1 were found in the grey matter; i.e. the piriform and entorhinal cortices, hypothalamus, reticular part of the substantia nigra, periaqueductal grey, trigeminal spinal nucleus etc. High to moderate density of neuronal L1 was found in the olfactory bulb, layer V of the cerebral cortex, amygdala, pontine grey, superior colliculi, cerebellar cortex, solitary tract nucleus etc. Only low to lowest levels of neuronal L1 were found in the hippocampus, grey matter in the caudate-putamen, thalamus, cerebellar nuclei etc.
Conclusion: L1 is widely and unevenly distributed in the matured mouse brain, where immunoreactivity was present not only in neuronal elements; axons, synapses and cell soma, but also in non-neuronal elements.
Figures

Similar articles
-
Localization of nitric oxide synthase in the adult rat brain.Philos Trans R Soc Lond B Biol Sci. 1994 Jul 29;345(1312):175-221. doi: 10.1098/rstb.1994.0096. Philos Trans R Soc Lond B Biol Sci. 1994. PMID: 7526408
-
Distribution of neuropeptide Y-like immunoreactivity in the rat central nervous system--II. Immunohistochemical analysis.Neuroscience. 1986 Jul;18(3):545-618. doi: 10.1016/0306-4522(86)90057-6. Neuroscience. 1986. PMID: 3755809
-
Distribution of the inositol 1,4,5-trisphosphate receptor, P400, in adult rat brain.J Comp Neurol. 1993 Nov 15;337(3):493-517. doi: 10.1002/cne.903370311. J Comp Neurol. 1993. PMID: 8282854
-
Distribution of L1cam mRNA in the adult mouse brain: In situ hybridization and Northern blot analyses.J Comp Neurol. 2005 Feb 21;482(4):386-404. doi: 10.1002/cne.20398. J Comp Neurol. 2005. PMID: 15669056
-
Classical androgen receptors in non-classical sites in the brain.Horm Behav. 2008 May;53(5):753-64. doi: 10.1016/j.yhbeh.2008.02.015. Epub 2008 Mar 6. Horm Behav. 2008. PMID: 18402960 Free PMC article. Review.
Cited by
-
Development of piriform cortex interhemispheric connections via the anterior commissure: progressive and regressive strategies.Brain Struct Funct. 2018 Dec;223(9):4067-4085. doi: 10.1007/s00429-018-1741-y. Epub 2018 Aug 24. Brain Struct Funct. 2018. PMID: 30141078 Free PMC article.
-
Impaired sprouting and axonal atrophy in cerebellar climbing fibres following in vivo silencing of the growth-associated protein GAP-43.PLoS One. 2011;6(6):e20791. doi: 10.1371/journal.pone.0020791. Epub 2011 Jun 10. PLoS One. 2011. PMID: 21695168 Free PMC article.
-
Fast turnover of L1 adhesions in neuronal growth cones involving both surface diffusion and exo/endocytosis of L1 molecules.Mol Biol Cell. 2007 Aug;18(8):3131-43. doi: 10.1091/mbc.e06-12-1101. Epub 2007 May 30. Mol Biol Cell. 2007. PMID: 17538021 Free PMC article.
-
L1CAM Is a Marker for Enriching Corticospinal Motor Neurons in the Developing Brain.Front Cell Neurosci. 2020 Feb 19;14:31. doi: 10.3389/fncel.2020.00031. eCollection 2020. Front Cell Neurosci. 2020. PMID: 32140099 Free PMC article.
-
Expression by midbrain dopamine neurons of Sema3A and 3F receptors is associated with chemorepulsion in vitro but a mild in vivo phenotype.Mol Cell Neurosci. 2010 Jun;44(2):135-53. doi: 10.1016/j.mcn.2010.03.003. Epub 2010 Mar 16. Mol Cell Neurosci. 2010. PMID: 20298787 Free PMC article.
References
-
- Lemmon V, Farr KL, Lagenaur C. L1-mediated axon outgrowth occurs via a homophilic binding mechanism. Neuron. 1989;2:1597–1603. - PubMed
-
- Ignelzi MA, Jr, Miller DR, Soriano P, Maness PF. Impaired neurite outgrowth of src-minus cerebellar neurons on the cell adhesion molecule L1. Neuron. 1994;12:873–884. - PubMed
-
- Lindner J, Rathjen FG, Schachner M. L1 mono- and polyclonal antibodies modify cell migration in early postnatal mouse cerebellum. Nature. 1983;305:427–430. - PubMed
-
- Liljelund P, Ghosh P, van den Pol AN. Expression of the neural axon adhesion molecule L1 in the developing and adult rat brain. J Biol Chem. 1994;269:32886–32895. - PubMed
Publication types
MeSH terms
Substances
LinkOut - more resources
Full Text Sources
