. 2003 Apr 4:3:6.
doi: 10.1186/1471-2180-3-6.

Ebola virus infection inversely correlates with the overall expression levels of promyelocytic leukaemia (PML) protein in cultured cells

Affiliations

Ebola virus infection inversely correlates with the overall expression levels of promyelocytic leukaemia (PML) protein in cultured cells

Asa Szekely Björndal et al. BMC Microbiol. .

Abstract

Background: Ebola virus causes severe, often fatal hemorrhagic fever in humans. The mechanism of escape from cellular anti-viral mechanisms is not yet fully understood. The promyelocytic leukaemia (PML) associated nuclear body is part of the interferon inducible cellular defense system. Several RNA viruses have been found to interfere with the anti-viral function of the PML body. The possible interaction between Ebola virus and the PML bodies has not yet been explored.

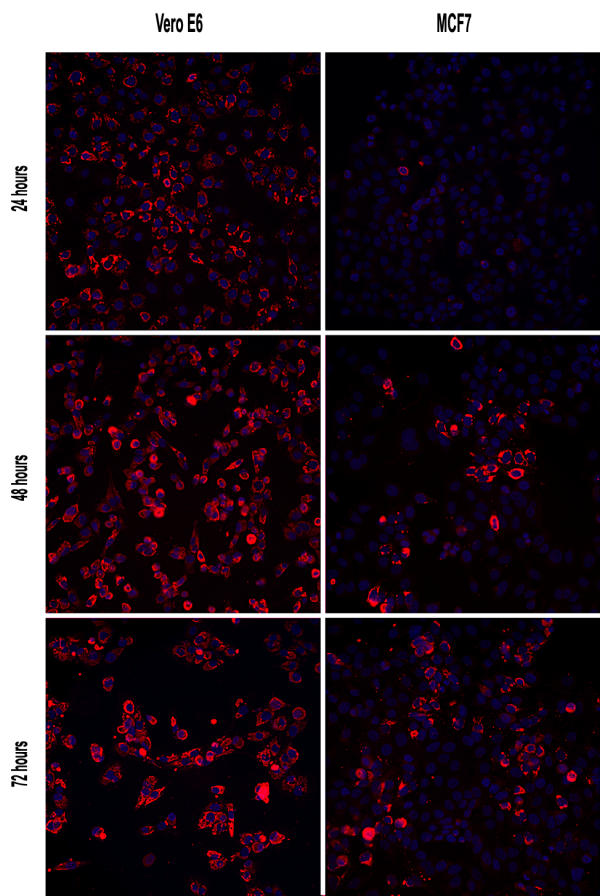
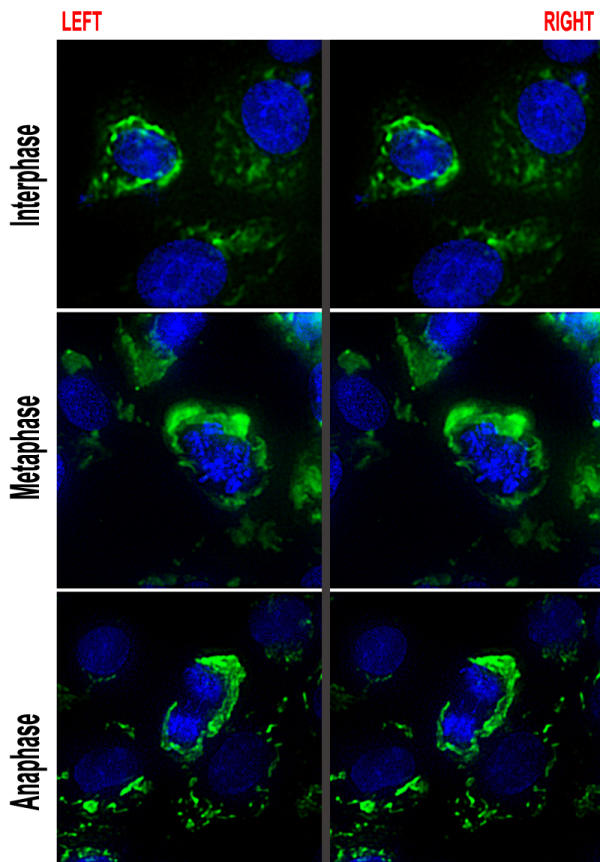
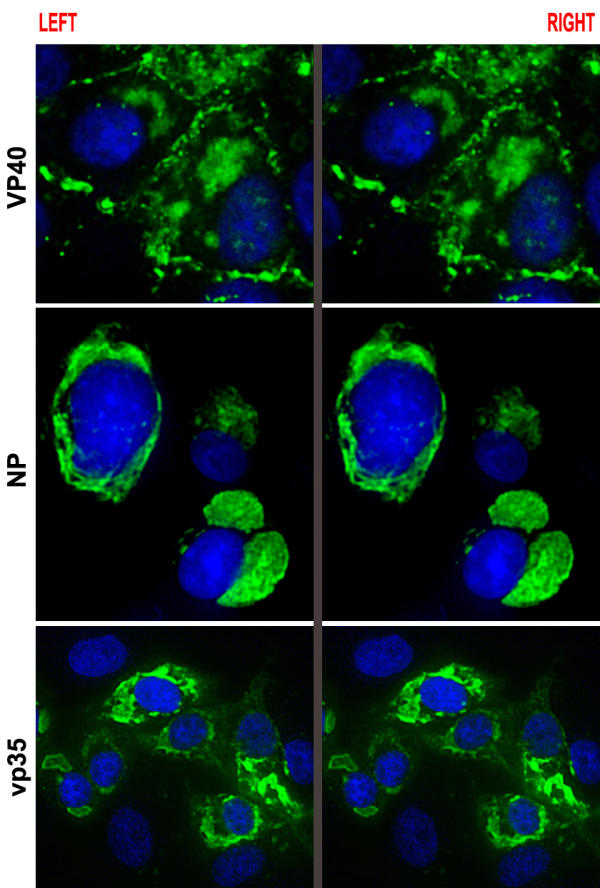
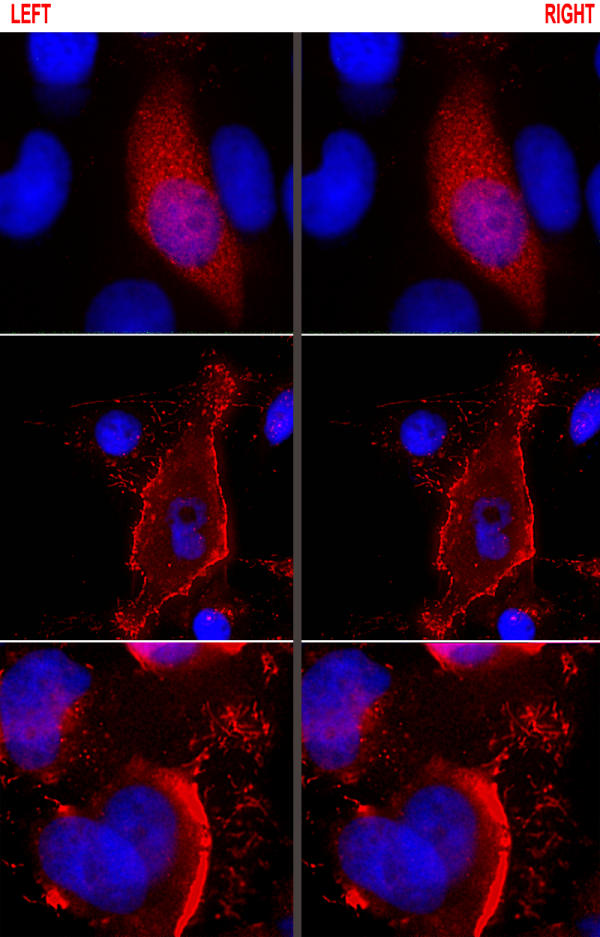
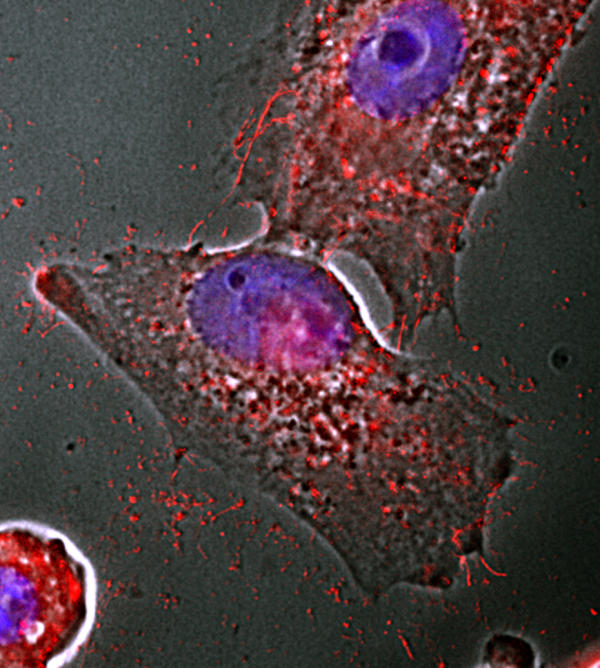
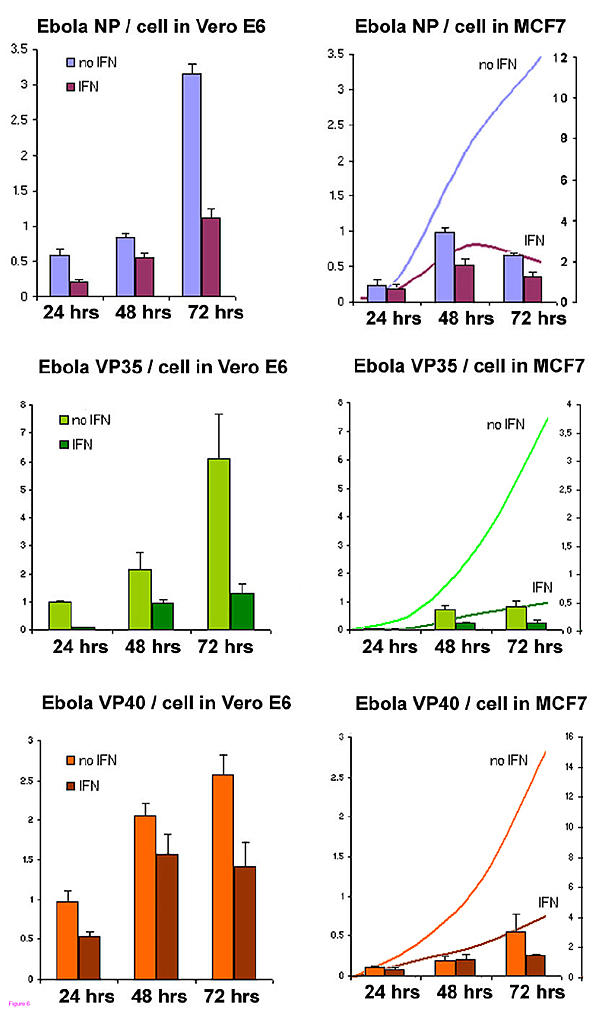
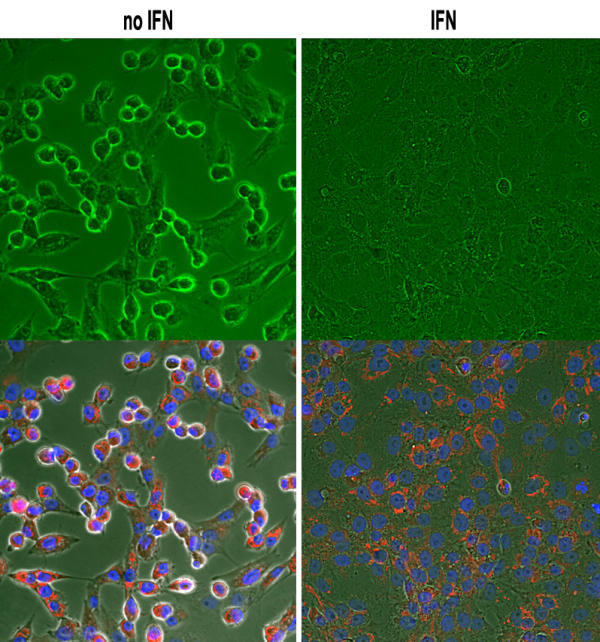
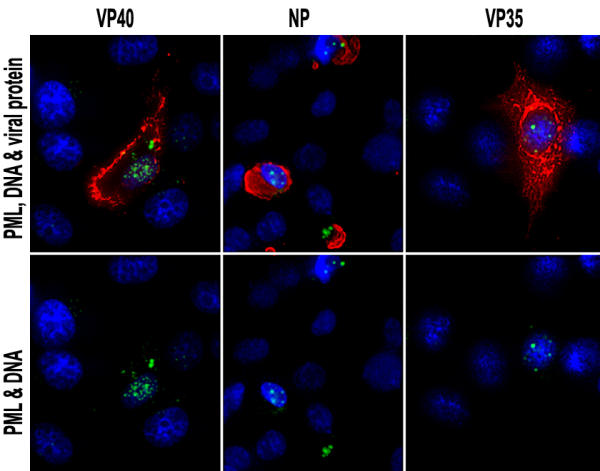
Results: We found that two cell lines, Vero E6 and MCF7, support virus production at high and low levels respectively. The expression of viral proteins was visualized and quantified using high resolution immunofluorescence microscopy. Ebola encoded NP and VP35 accumulated in cytoplasmic inclusion bodies whereas VP40 was mainly membrane associated but it was also present diffusely in the cytoplasm as well as in the euchromatic areas of the nucleus. The anti-VP40 antibody also allowed the detection of extracellular virions. Interferon-alpha treatment decreased the production of all three viral proteins and delayed the development of cytopathic effects in both cell lines. Virus infection and interferon-alpha treatment induced high levels of PML protein expression in MCF7 but much less in Vero E6 cells. No disruption of PML bodies, a common phenomenon induced by a variety of different viruses, was observed.

Conclusion: We have established a simple fixation and immunofluorescence staining procedure that allows specific co-detection and precise sub-cellular localization of the PML nuclear bodies and the Ebola virus encoded proteins NP, VP35 and VP40 in formaldehyde treated cells. Interferon-alpha treatment delays virus production in vitro. Intact PML bodies may play an anti-viral role in Ebola infected cells.


Figures

Figure 1
Figure 1
Ebola virus infectivity differs in MCF7 and Vero E6 cells. Vero E6 (left panel) and MCF7 (right panel) cells at 24, 48 and 72 hrs post-infection stained for Ebola virus nucleoprotein – NP (red). Cell nuclei are stained with Hoechst 33258 (blue).
Figure 2
Figure 2
Ebola virus NP in Vero E6 cells at different phases of the cell cycle. Stereoprojected images of NP (green) that show the three dimensional distribution of the protein in cytoplasmic inclusions in interphase, metaphase and anaphase. The images were reconstituted from a series of fifteen, mathematically deblurred, optical sections 0.3 μm apart. Note that the presence of large inclusions does not interfere with the progression of the cell cycle. Interphase nuclei and chromosomes are stained blue. Pictures were taken 48 hrs post-infection.
Figure 3
Figure 3
Comparison of the sub-cellular distribution of Ebola viral proteins VP40, NP and VP35. Three dimensional stereoprojected images of Vero E6 cells, 48 hours post-infection. DNA staining is blue. The upper panel shows that VP40 (green) is primarily membrane associated although it can be also present in the low DNA density regions of the nucleus or in diffuse areas of the cytoplasm. NP (green) on the other hand exclusively accumulates in well circumscribed cytoplasmic inclusions of various size, shape and confluency (middle panel). VP35 (green) shows similar distribution as NP with additional homogeneous staining all over the cytoplasm (bottom panel). Both NP and VP35 avoid the nuclei.
Figure 4
Figure 4
Ebola VP40 changes distribution during the course of infection. The stereoprojected images of MCF7 cells show that at the early phase of infection (top panel) VP40 is localized to homogeneously dispersed granules in the cytoplasm as well as in the nucleus. Later, at the initial phase of rounding up (middle panel), VP40 is almost exclusively membrane associated and it is present in extracellular filamentous structures as well. VP40 is also present in the virions that accumulate in large quantities around cells with pronounced cytopathic effects (bottom panel). DNA staining is blue.
Figure 5
Figure 5
Release of filamentous Ebola virus particles from Vero E6 cells. VP40 staining (red) superimposed on a phasecontrast image of infected cells shows the appearance of extracellular virions even before the development of cytopathic effects. DNA staining is blue.
Figure 6
Figure 6
Interferon-alpha treatment inhibits the production of Ebola virus proteins. 200 IU/ml of IFN-alpha reduces the amount of NP, VP35 and VP40 both in the highly susceptible Vero E6 cells and in the less virus sensitive MCF7 cells. The Y axis shows the relative fluorescence intensity. The columns represent the mean fluorescence intensity per cell. Standard deviation was calculated from three independently captured random fields of immunostained cells. All the steps of IFN-alpha treatment, virus infection, fixation, immunofluorescence staining and image capturing were carried out in parallel for the two cell lines allowing the direct comparison of expression levels of the individual viral proteins between treated and non-treated as well as between Vero E6 and MCF7 cell lines. This is represented by the identical scale of the Y axis for the given proteins. Due to the unknown binding affinity of the antibodies the staining intensities for NP, VP35 and VP40 are not comparable with each other. To avoid confusion due to the presence of an expanding non-infected cell population in the MCF7 cultures we show not only the fluorescence intensity of staining per cell (columns of the upper right chart) but also the average fluorescence intensity for the entire field (lines – with a corresponding Y axis on the right).
Figure 7
Figure 7
Interferon-alpha treatment decreases the Ebola virus induced cytopathic effects in Vero E6 cultures. Phasecontrast image of IFN-alpha treated and non-treated cells 72 hrs post-infection shows an efficient inhibition of rounding up (top right panel). Fluorescence staining for NP (red) and DNA (blue) is superimposed on the phase contrast image (bottom panel).
Figure 8
Figure 8
MCF7 and Vero E6 differs in the virus- and interferon treatment-induced PML expression levels. The Y axis shows the relative fluorescence intensity. The columns represent the mean fluorescence intensity of PML staining per nucleus in interferon-alpha treated cultures. Standard deviation is calculated from three independent capturings of random fields of immunostained cells.
Figure 9
Figure 9
Ebola virus induces increased PML expression in the infected cells. Double immunofluorescence staining of VP40 and VP35 in MCF7 or NP in Vero E6 cells (red) with PML (green) 48 hrs post-infection. The pictures shows that infected cells express more PML proteins as compared to the non-infected neighbouring cells. DNA staining is blue. The intensity of the PML fluorescence signal is not directly comparable between Vero E6 (weak overall PML staining) and MCF7 cells (strong overall PML staining).

Similar articles

Cited by

References

    1. Sanchez A, Khan AS, Zaki SR, Nabel GJ, Ksiazek TG, Peters CJ. Filoviridae: Marburg and Ebola viruses. Fields Virology, DMKnipe and PM Howley, eds Philadelpia: Lippincotts, Williams and Wilkins. 2001. pp. 1279–1304.
    1. Geisbert TW, Jahrling PB. Differentiation of filoviruses by electron microscopy. Virus Res. 1995;39:129–150. doi: 10.1016/0168-1702(95)00080-1. - DOI - PubMed
    1. Peters CJ, LeDuc JW. An introduction to Ebola: the virus and the disease. J Infect Dis. 1999;179 Suppl 1:ix–xvi. - PubMed
    1. Villinger F, Rollin PE, Brar SS, Chikkala NF, Winter J, Sundstrom JB, Zaki SR, Swanepoel R, Ansari AA, Peters CJ. Markedly elevated levels of interferon (IFN)-gamma, IFN-alpha, interleukin (IL)-2, IL-10, and tumor necrosis factor-alpha associated with fatal Ebola virus infection. J Infect Dis. 1999;179 Suppl 1:S188–NaN. - PubMed
    1. Baize S, Leroy EM, Georges AJ, Georges-Courbot MC, Capron M, Bedjabaga I, Lansoud-Soukate J, Mavoungou E. Inflammatory responses in Ebola virus-infected patients. Clin Exp Immunol. 2002;128:163–168. doi: 10.1046/j.1365-2249.2002.01800.x. - DOI - PMC - PubMed

Publication types

MeSH terms