. 2003 Apr 9:3:3.
doi: 10.1186/1471-213x-3-3. Epub 2003 Apr 9.

IfkA, a presumptive eIF2 alpha kinase of Dictyostelium, is required for proper timing of aggregation and regulation of mound size

Affiliations

IfkA, a presumptive eIF2 alpha kinase of Dictyostelium, is required for proper timing of aggregation and regulation of mound size

Rui Fang et al. BMC Dev Biol. .

Abstract

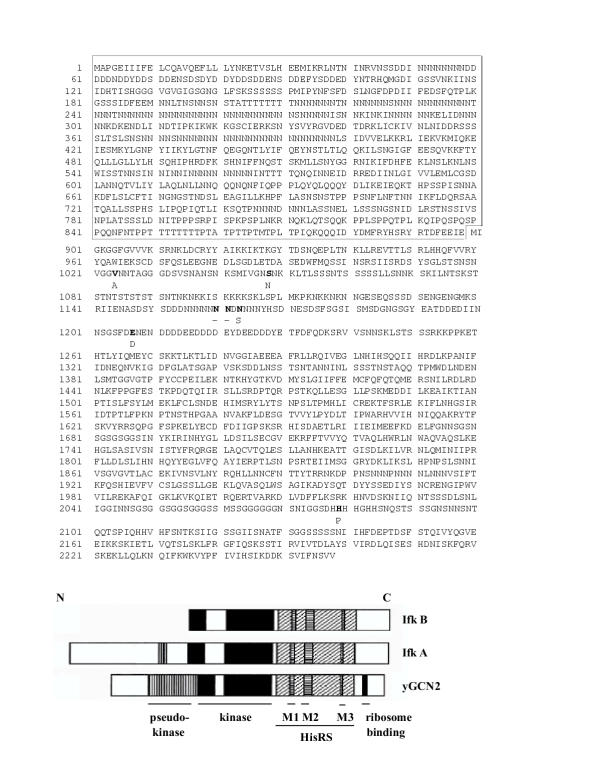
Background: The transition from growth to development in Dictyostelium is initiated by amino acid starvation of growing amobae. In other eukaryotes, a key sensor of amino acid starvation and mediator of the resulting physiological responses is the GCN2 protein, an eIF2alpha kinase. GCN2 downregulates the initiation of translation of bulk mRNA and enhances translation of specific mRNAs by phosphorylating the translation initiation factor eIF2alpha. Two eIF2alpha kinases were identified in Dictyostelium and studied herein.

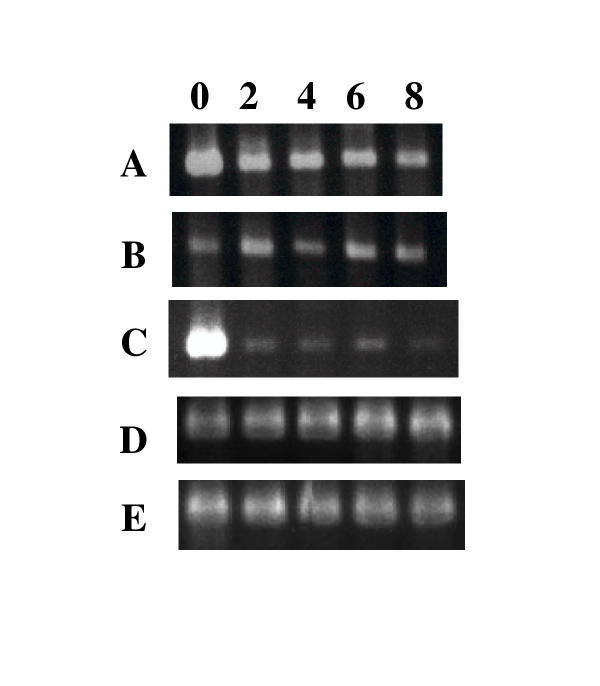
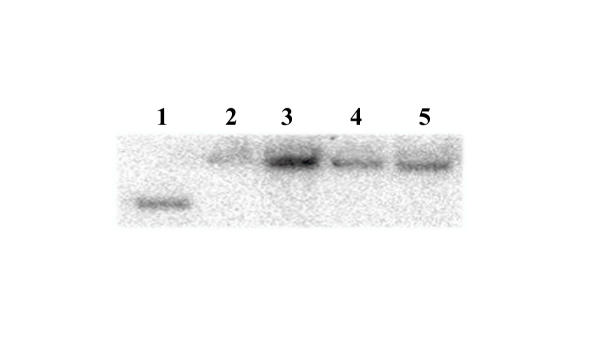
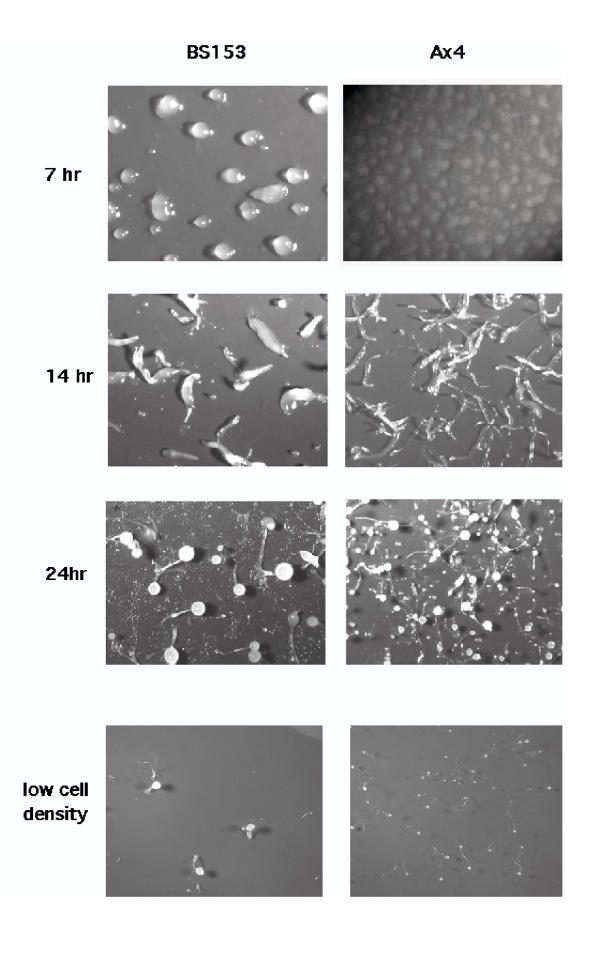
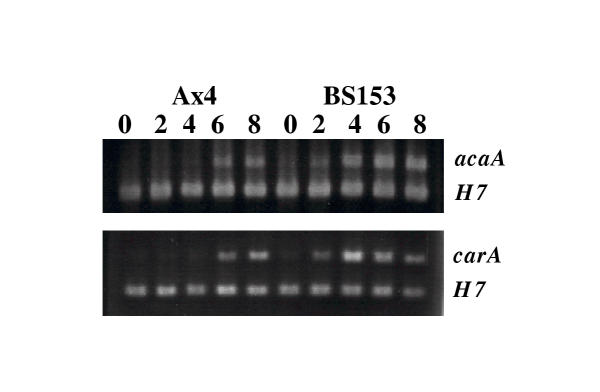
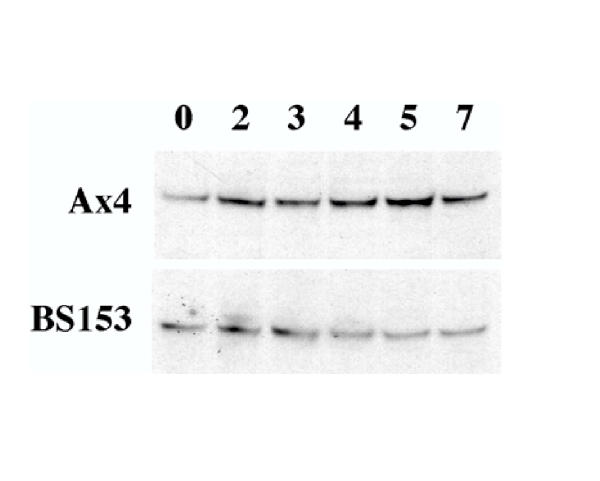
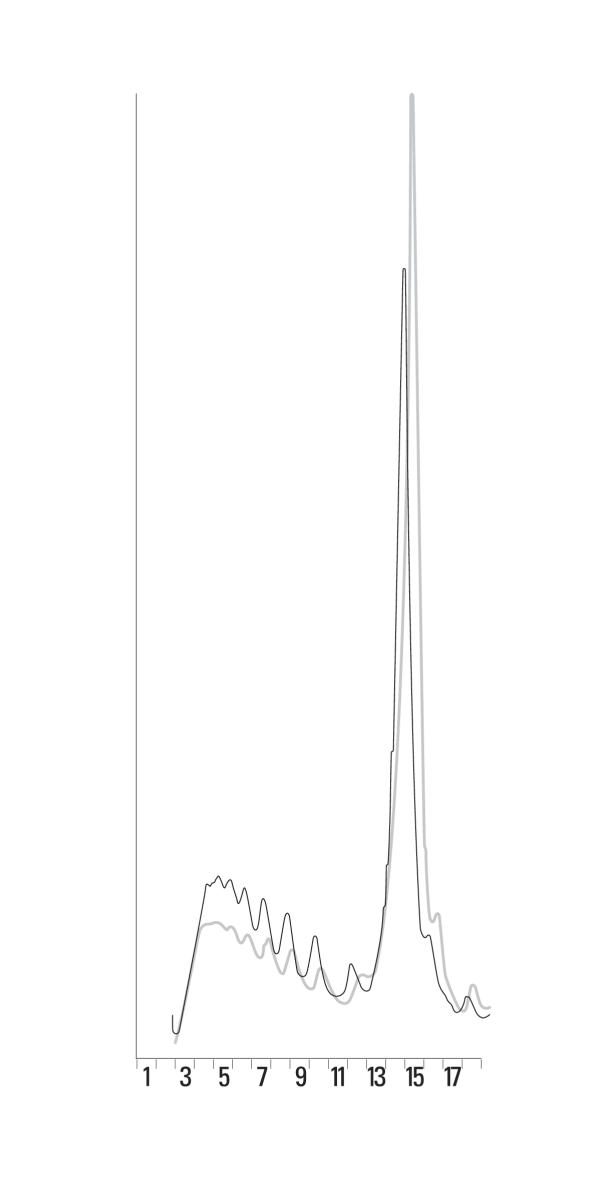
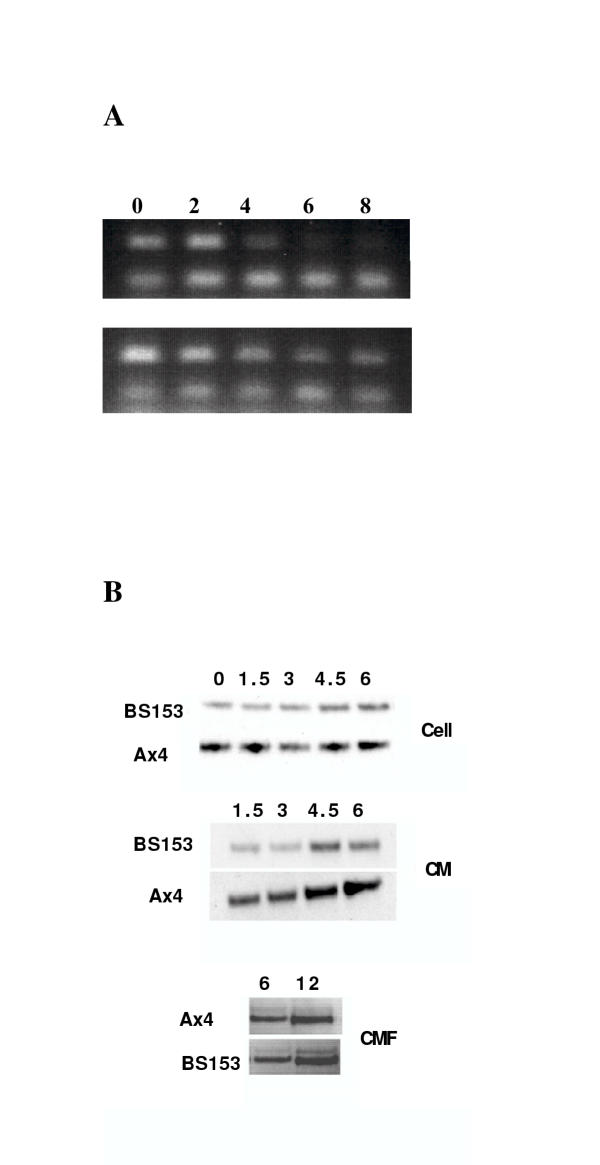
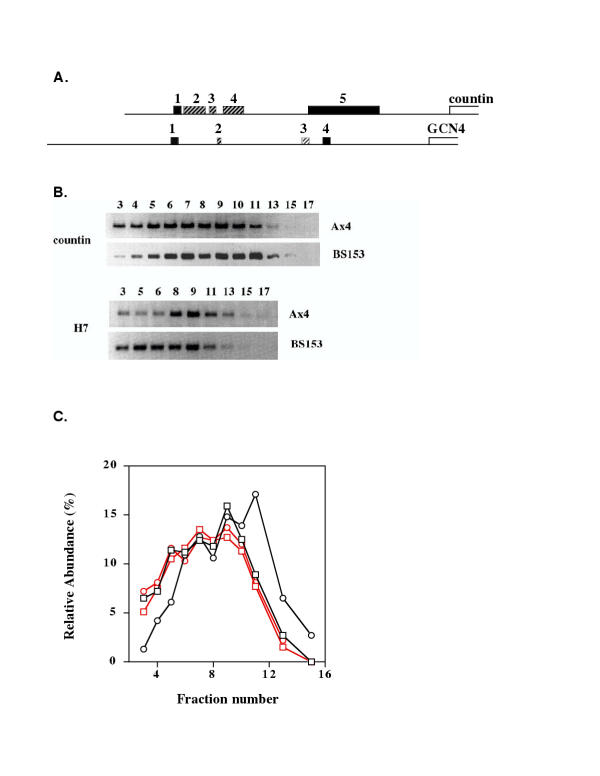
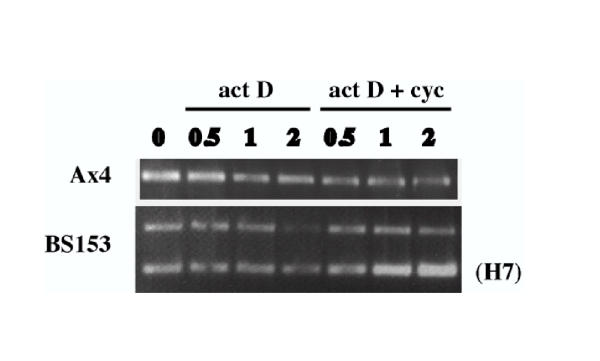
Results: Neither of the eIF2alpha kinases appeared to be involved in sensing amino acid starvation to initiate development. However, one of the kinases, IfkA, was shown to phosphorylate eIF2alpha from 1 to 7 hours after the onset of development, resulting in a shift from polysomes to free ribosomes for bulk mRNA. In the absence of the eIF2alpha phosphorylation, ifkA null cells aggregated earlier than normal and formed mounds and ultimately fruiting bodies that were larger than normal. The early aggregation phenotype in ifkA null cells reflected an apparent, earlier than normal establishment of the cAMP pulsing system. The large mound phenotype resulted from a reduced extracellular level of Countin, a component of the counting factor that regulates mound size. In wild type cells, phosphorylation of eIF2alpha by IfkA resulted in a specific stabilization and enhanced translational efficiency of countin mRNA even though reduced translation resulted for bulk mRNA.

Conclusions: IfkA is an eIF2alpha kinase of Dictyostelium that normally phosphorylates eIF2alpha from 1 to 7 hours after the onset of development, or during the preaggregation phase. This results in an overall reduction in the initiation of protein synthesis during this time frame and a concomitant reduction in the number of ribosomes associated with most mRNAs. For some mRNAs, however, initiation of protein synthesis is enhanced or stabilized under the conditions of increased eIF2alpha phosphorylation. This includes countin mRNA.


Figures

Figure 1
Figure 1
A) Amino acid sequences for IfkA and IfkB. The sequence for IfkA is shown in full. The first 898 amino acids that are not found in IfkB are boxed. For the remainder of the sequence, amino acid residues that differ between the two proteins are given in bold (IfkA) with the corresponding amino acid for IfkB shown underneath; a "-" indicates residues not found in IfkB. B) Schematic structures of IfkA, IfkB and GCN2 of yeast. Conserved regions are shown in black or striped. These include the pseudokinase domain, the kinase domain, and the histidyl-tRNA synthetase (HisRS) domain, including the m1-m3 motifs of the HisRS domain. The open regions inside the kinase domains are the insert sequences between the 4th and 5th kinase subdomain and are not conserved among GCN2 genes from different species. The final black box at the C-terminus of yeast GCN2 indicates a cluster of positively charged residues which are thought to function in ribosome binding and dimerization. No similar sequence was identified in this region within the Dictyostelium genes.
Figure 2
Figure 2
Detection of ifkA and ifkB mRNA levels. Total RNA was isolated from growing cells (0) and at the times indicated (in hours) after the onset of development. RT-PCR was carried out using oligonucleotides that detect both ifk mRNAs using RNA from the parental strain, Ax4 (panel A) or RNA from the ifkA null strain, BS153 (panel B). Oligonucleotides specific for ifkA also were used with RNA from Ax4 (panel C), and these primers gave no band when used with RNA from BS153. The picture for panel C was taken at a longer exposure time than the other two panels in order to reveal the faint bands present during development. H7 specific oligonucleotides were used as controls (H7 is a constitutively expressed gene), and the H7 band was similar in intensity for all lanes (panel D, Ax4 RNA; panel E, BS153 RNA).
Figure 3
Figure 3
Southern analysis of transformants potentially disrupted for ifkA. DNA was isolated from the parental strain, Ax4 (lane 1), and from 4 independently isolated transformants (lanes 2–5) for which PCR had indicated possession of a disrupted ifkA gene. DNA from each was digested with SwaI, subjected to Southern blotting, and probed with a radioactive ifkA fragment. Disruption of the ifkA gene should result in a shift of about 1000 bp due to the insertion of the blasticidin cassette (1400 bp) and the loss of about 400 bp of the endogenous kinase domain. All of the analyzed transformants showed the expected shift, and the strain represented in lane 3 was designated BS153.
Figure 4
Figure 4
The morphology during development of the ifkA disrupted strain, BS153, and the parental strain, Ax4. Cells of both strains were plated for development under standard conditions. Pictures were taken at the indicated times in hours after the onset of development, all at the same maginification. 7 hr: BS153, tight mounds; Ax4, ripples. 14 hr: BS153 and Ax4, transient slugs; 24 hr: BS153 and Ax4, fruiting bodies. For BS153, several toppled fruiting bodies are indicated by the arrows. Both strains also were developed at a cell density about 6 fold lower than the normal cell density (low cell density panels).
Figure 5
Figure 5
Detection of acaA and carA mRNAs in BS153 and the parental strain, Ax4. Total RNA was isolated from growing cells (0) and at the times indicated (in hours) after the onset of development. RT-PCR was carried out using oligonucleotides specific for either acaA mRNA or carA mRNA. H7 specific oligonucleotides were used as an internal control (H7 is a constitutively expressed gene).
Figure 6
Figure 6
eIF2α phosphorylation levels in BS153 and the parental strain, Ax4. Total protein was isolated from growing cells (0) and at the times indicated (in hours) after the onset of development. Equal amounts of each protein sample were separated by PAGE, blotted, and probed with antiserum specific for phosphorylated eIF2α. Stripping of the filter and reprobing with antiserum specific for the V4 protein, a protein found at constant levels in growing and developing cells, indicated equivalent amounts of protein in each lane (not shown).
Figure 7
Figure 7
The polysome profiles in BS153 and the parental strain, Ax4. Lysates, cleared of debris and nuclei, were prepared from both strains 4 hours after the onset of development and were used as a source of polysomes/ribosomes. RNA concentrations in the lysates were determined spectrophotometrically. Sucrose gradient centrifugation was carried out on equal amounts of each sample to generate the polysome profile. The OD at 254 nm was read continuously, and fractions were collected. The black, thin line represents the profile from BS153 and the thicker, gray line is the Ax4 profile. Fractions 3 through 11 represent polysomes with decreasing numbers of associated ribosomes going from fraction 3 to fraction 11, while fractions 13 through 16 represent free ribosomes.
Figure 8
Figure 8
Countin mRNA and protein levels in BS153 and the parental strain, Ax4. A) Total RNA was isolated from cells growing on bacteria (0) and at the times indicated (in hours) after the onset of development. RT-PCR was carried out using oligonucleotides specific for countin mRNA (upper band in each panel). H7 specific oligonucleotides were used as an internal control (lower band in each panel). B) Ax4 and BS153 cells were washed free of bacteria, resuspended in PDF buffer at 5 × 10⁶ cells/ml, and were incubated with shaking for the times indicated (in hours). For cellular Countin, samples were removed, and the cells were pelleted and washed. Total protein was isolated from the cells, and equal amounts of each protein sample were separated by PAGE, blotted, and probed with antiserum specific for countin (Cell panel). The conditioned medium (CM) from each sample, after removal of the cells, was used as a source of secreted Countin. The proteins from equal volumes of the CM samples were separated by PAGE, blotted, and probed with antiserum specific for Countin (CM panel). The 6 and 12 hour conditioned medium samples were concentrated, and the proteins from equivalent volumes were separated by PAGE, blotted, and probed with antiserum specific for conditioned medium factor (CMF panel).
Figure 9
Figure 9
A) Schematic drawing of the 5' leader region of countin and yeast GCN4 mRNAs. The position and size of uORFs are drawn to scale. The first and last uORFs are marked as black boxes, other uORFs are designated by striped boxes, and the open box at the 3' end represents the beginning of the coding region for countin and GCN4. B) Countin and H7 mRNA distributions within the polysomes and ribosome fractions prepared as described in figure 7from BS153 and the parental strain, Ax4, after 4 hours of development. RNA was extracted from the isolated sucrose gradient fractions and was used in RT-PCR reactions with countin or H7 specific oligonucleotides. The numbers refer to the fraction used, and correspond to the numbers given in figure 7. Fractions 3 through 11 represent polysomes with decreasing numbers of associated ribosomes in going from fraction 3 to fraction 11, while fractions 13 through 16 represent free ribosomes. For the countin panels, the BS153 panel was exposed for a longer period of time than that of Ax4 due to the lower amounts of countin mRNA in this strain at four hours post starvation. C) Quantitation of the data shown in panel B for countin mRNA. Within each strain, the relative abundance of countin mRNA from each fraction was determined by quantitating the band in each fraction and dividing this value by the sum of the values of all the fractions for that strain. Black circles, BS153 from 4 hour polysome profile shown in panel B; red circles, BS153 from 0 hour polysome profile; black squares, Ax4 from 4 hour polysome profile shown in panel B; red squares, Ax4 from 0 hour polysome profile.
Figure 10
Figure 10
Relative countin mRNA stability in BS153 verses the parental strain, Ax4. Cells from both strains were plated under standard conditions of development after removal of bacteria. After two hours, the filters supporting the cells were transferred to paper pads soaking in fresh PDF plus actinomycin D (actD) or fresh PDF plus actinomycin D and cycloheximide (actD + cyc). After the transfers, a filter of cells was harvested at 0.5, 1, or 2 hours. Total RNA was isolated from these samples and from cells at the time of transfer (0). RT-PCR was carried out using oligonucleotides specific for countin mRNA (upper band in BS153 panel). For the BS153 panel, the band corresponding to H7 mRNA (lower band) is shown as an internal control. The H7 band increases with time in the actD + cyc lanes as H7 transcription is induced by cycloheximide [53].

Similar articles

Cited by

References

    1. Raper KB. The Dictyostelids. Princeton University Press, Princeton, NJ. 1984.
    1. Gomer RH, Yuen IS, Firtel RA. A secreted 80*10(3)Mr protein mediates sensing of cell density and the onset of development in Dictyostelium. Develop. 1991;112:269. - PubMed
    1. Yuen IS, Jain R, Bishop JD, Lindsey DF, Derry WJ, Van Haastert PJM, Gomer R. A density-sensing factor regulates signal transduction in Dictyostelium. J Cell Biol. 1995;129:1251–1262. doi: 10.1083/jcb.129.5.1251. - DOI - PMC - PubMed
    1. Yuen IS, Taphouse C, Halfant KA, Gomer RH. Regulation and processing of a secreted protein that mediates sensing of cell density in Dictyostelium. Develop. 1991;113:1375. - PubMed
    1. Clarke M, Dominguez N, Yuen IS, Gomer RH. Growing and starving Dictyostelium cells produce distinct density-sensing factors. Dev Biol. 1992;152:403. doi: 10.1016/0012-1606(92)90147-9. - DOI - PubMed

Publication types

MeSH terms