

Significance analysis of lexical bias in microarray data
- PMID: 12697067
- PMCID: PMC153504
- DOI: 10.1186/1471-2105-4-12
Significance analysis of lexical bias in microarray data
Abstract
Background: Genes that are determined to be significantly differentially regulated in microarray analyses often appear to have functional commonalities, such as being components of the same biochemical pathway. This results in certain words being under- or overrepresented in the list of genes. Distinguishing between biologically meaningful trends and artifacts of annotation and analysis procedures is of the utmost importance, as only true biological trends are of interest for further experimentation. A number of sophisticated methods for identification of significant lexical trends are currently available, but these methods are generally too cumbersome for practical use by most microarray users.
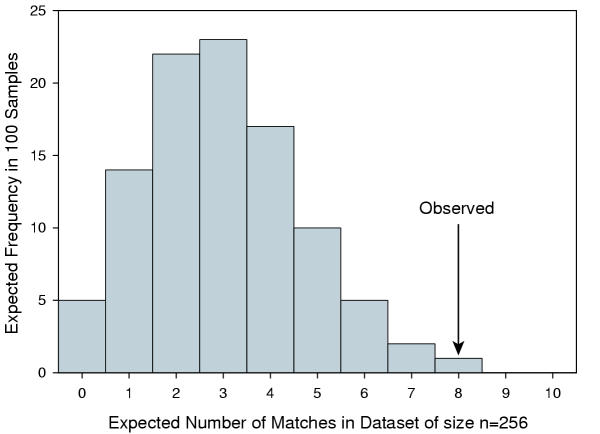
Results: We have developed a tool, LACK, for calculating the statistical significance of apparent lexical bias in microarray datasets. The frequency of a user-specified list of search terms in a list of genes which are differentially regulated is assessed for statistical significance by comparison to randomly generated datasets. The simplicity of the input files and user interface targets the average microarray user who wishes to have a statistical measure of apparent lexical trends in analyzed datasets without the need for bioinformatics skills. The software is available as Perl source or a Windows executable.
Conclusion: We have used LACK in our laboratory to generate biological hypotheses based on our microarray data. We demonstrate the program's utility using an example in which we confirm significant upregulation of SPI-2 pathogenicity island of Salmonella enterica serovar Typhimurium by the cation chelator dipyridyl.
Figures
Similar articles
-
MILANO--custom annotation of microarray results using automatic literature searches.BMC Bioinformatics. 2005 Jan 20;6:12. doi: 10.1186/1471-2105-6-12. BMC Bioinformatics. 2005. PMID: 15661078 Free PMC article.
-
Virulotyping and antimicrobial resistance typing of Salmonella enterica serovars relevant to human health in Europe.Foodborne Pathog Dis. 2010 May;7(5):523-35. doi: 10.1089/fpd.2009.0447. Foodborne Pathog Dis. 2010. PMID: 20039795
-
Genetic determinants and polymorphisms specific for human-adapted serovars of Salmonella enterica that cause enteric fever.J Clin Microbiol. 2006 Jun;44(6):2007-18. doi: 10.1128/JCM.02630-05. J Clin Microbiol. 2006. PMID: 16757591 Free PMC article.
-
Bioinformatics analysis of microarray data.Methods Mol Biol. 2009;573:259-84. doi: 10.1007/978-1-60761-247-6_15. Methods Mol Biol. 2009. PMID: 19763933 Review.
-
Bioconductor: an open source framework for bioinformatics and computational biology.Methods Enzymol. 2006;411:119-34. doi: 10.1016/S0076-6879(06)11008-3. Methods Enzymol. 2006. PMID: 16939789 Review.
Cited by
-
Experimental malaria infection triggers early expansion of natural killer cells.Infect Immun. 2008 Dec;76(12):5873-82. doi: 10.1128/IAI.00640-08. Epub 2008 Sep 29. Infect Immun. 2008. PMID: 18824529 Free PMC article.
-
The microRNA bantam regulates a developmental transition in epithelial cells that restricts sensory dendrite growth.Development. 2014 Jul;141(13):2657-68. doi: 10.1242/dev.107573. Epub 2014 Jun 12. Development. 2014. PMID: 24924190 Free PMC article.
-
Diversity and transport of microorganisms in intertidal sands of the California coast.Appl Environ Microbiol. 2014 Jul;80(13):3943-51. doi: 10.1128/AEM.00513-14. Epub 2014 Apr 18. Appl Environ Microbiol. 2014. PMID: 24747906 Free PMC article.
-
Comparative whole genome transcriptome analysis of three Plasmodium falciparum strains.Nucleic Acids Res. 2006 Feb 21;34(4):1166-73. doi: 10.1093/nar/gkj517. Print 2006. Nucleic Acids Res. 2006. PMID: 16493140 Free PMC article.
-
Delineation of upstream signaling events in the salmonella pathogenicity island 2 transcriptional activation pathway.J Bacteriol. 2004 Jul;186(14):4694-704. doi: 10.1128/JB.186.14.4694-4704.2004. J Bacteriol. 2004. PMID: 15231802 Free PMC article.
References
-
- Kaminski N, Friedman N. Practical approaches to analyzing results of microarray experiments. Am J Respir Cell Mol Biol. 2002;27:125–132. - PubMed
Publication types
MeSH terms
Substances
Grants and funding
LinkOut - more resources
Full Text Sources
Other Literature Sources
Molecular Biology Databases
Miscellaneous
