. 2003 Apr 15;100(8):4837-42.
doi: 10.1073/pnas.0330745100.

Amyloid deposition in the hippocampus and entorhinal cortex: quantitative analysis of a transgenic mouse model

Affiliations

Amyloid deposition in the hippocampus and entorhinal cortex: quantitative analysis of a transgenic mouse model

John F Reilly et al. Proc Natl Acad Sci U S A. .

Abstract

Various transgenic mouse models of Alzheimer's disease (AD) have been developed that overexpress mutant forms of amyloid precursor protein in an effort to elucidate more fully the potential role of beta-amyloid (A beta) in the etiopathogenesis of the disease. The present study represents the first complete 3D reconstruction of A beta in the hippocampus and entorhinal cortex of PDAPP transgenic mice. A beta deposits were detected by immunostaining and thioflavin fluorescence, and quantified by using high-throughput digital image acquisition and analysis. Quantitative analysis of amyloid load in hippocampal subfields showed a dramatic increase between 12 and 15 months of age, with little or no earlier detectable deposition. Three-dimensional reconstruction in the oldest brains visualized previously unrecognized sheets of A beta coursing through the hippocampus and cerebral cortex. In contrast with previous hypotheses, compact plaques form before significant deposition of diffuse A beta, suggesting that different mechanisms are involved in the deposition of diffuse amyloid and the aggregation into plaques. The dentate gyrus was the hippocampal subfield with the greatest amyloid burden. Sublaminar distribution of A beta in the dentate gyrus correlated most closely with the termination of afferent projections from the lateral entorhinal cortex, mirroring the selective vulnerability of this circuit in human AD. This detailed temporal and spatial analysis of A beta and compact amyloid deposition suggests that specific corticocortical circuits express selective, but late, vulnerability to the pathognomonic markers of amyloid deposition, and can provide a basis for detecting prior vulnerability factors.


Figures

Figure 1
Figure 1
Representative coronal sections of PDAPP transgenic mice. 3D6 immunostaining (Left) shows increasing Aβ deposition over time. Thioflavin staining (Right) demonstrates compact plaques at all ages examined. (Insets) Higher magnification of Aβ deposits. [Bar = 1.5 mm (150 μm for Insets).]
Figure 2
Figure 2
Three-dimensional reconstruction of Aβ distribution. (A) Serial coronal sections immunostained with 3D6 were imaged and compiled into a 3D data file. A surface reconstruction of the hippocampus is shown in yellow. (B) Aβ deposits were segmented by thresholding and are displayed as a 3D reconstruction (red). A surface reconstruction of the hippocampus (yellow) and a single coronal section are shown for orientation. (C) Three-dimensional reconstruction of Aβ (red) viewed from the posterior aspect of the brain with the hippocampus shown as transparent yellow. Note the extensive deposition in the neocortex and hippocampus, and the central lucency representing the midbrain and caudate-putamen with punctate Aβ visible in the frontal cortex and olfactory bulb. (D) Large lakes and ribbons of Aβ (cyan) were identified by automated detection of contiguous structures within the 3D reconstruction of Aβ (shown as transparent red; same angle of view as C). (E) Aβ sheets (cyan) are visible in the rostral part of the DG, shown against a single coronal section, with the surface reconstruction of the hippocampus in transparent yellow. (F) Magnified view of the Aβ lakes and ribbons (cyan) in the DG (within the transparent yellow hippocampal surface) and extending into the retrosplenial cortex (above).
Figure 3
Figure 3
Quantitative analysis of hippocampal Aβ load. (A) Hippocampal subfields, including CA1, CA3, DG, and subiculum (SUB) were contoured on 4′,6-diamidino-2-phenylindole-counterstained sections. (Bar = 200 μm.) (B) Contours were applied to the images of 3D6-immunostaining on the same sections. Contours on propidium iodide-counterstained sections were applied to thioflavin S-stained sections (data not shown). (C) A uniform threshold based on staining of control sections was applied to each subfield, and the area occupied by amyloid was determined. (D) Aβ load in hippocampal subfields over time. Total and compact load were calculated as the volume fractions of 3D6 and thioflavin staining, respectively, and diffuse load was determined by subtraction of compact from total. Data were analyzed by ANOVA; Tables 2–4 present complete results of pairwise comparisons.
Figure 4
Figure 4
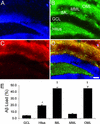
Aβ load in DG sublayers. (AD) Triple-fluorescent image of the DG, showing nuclear counterstaining (4′,6-diamidino-2-phenylindole, A), ZnT3 (B) with the hilus, granule cell layer (GCL), IML, MML, and OML indicated, and 3D6 (C). Yellow bands in IML and OML in the merged image (D) indicate extensive overlap of amyloid deposition with ZnT3 labeling of perforant path (OML) and hilus (IML) terminations. (Bar = 50 μm.) (E) Total Aβ load in DG sublaminae in 22-month-old animals. Compact load was <1.5% in all sublayers (data not shown). *, P < 0.005 vs. GCL and MML; †, P < 0.0001 vs. hilus, GCL, and MML.
Figure 5
Figure 5
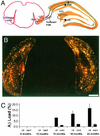
Aβ load in the EC. (A) Diagram of the major extrinsic and intrinsic afferents of the DG, showing the projection of lateral EC to OML and medial EC to MML. (B) Representative coronal sections showing 3D6 immunostaining at 22 months of age. (Bar = 1.0 mm.) (C) Total Aβ load in the EC over time. Compact load was <0.2% in both subregions (data not shown). Data were analyzed by ANOVA; Table 5 presents complete results of pairwise comparisons.

Similar articles

Cited by

References

    1. Price D L, Sisodia S S. Annu Rev Neurosci. 1998;21:479–505. - PubMed
    1. Hardy J, Selkoe D J. Science. 2002;297:353–356. - PubMed
    1. Sommer B. Curr Opin Pharmacol. 2002;2:87–92. - PubMed
    1. Masliah E, Rockenstein E. J Neural Transm (Suppl.) 2000;59:175–183. - PubMed
    1. Dodart J C, Mathis C, Saura J, Bales K R, Paul S M, Ungerer A. Neurobiol Dis. 2000;7:71–85. - PubMed

MeSH terms

Substances