. 2003 Apr 29;100(9):5543-8.
doi: 10.1073/pnas.0935295100. Epub 2003 Apr 16.

Functional role of L-type Cav1.3 Ca2+ channels in cardiac pacemaker activity

Affiliations

Functional role of L-type Cav1.3 Ca2+ channels in cardiac pacemaker activity

Matteo E Mangoni et al. Proc Natl Acad Sci U S A. .

Abstract

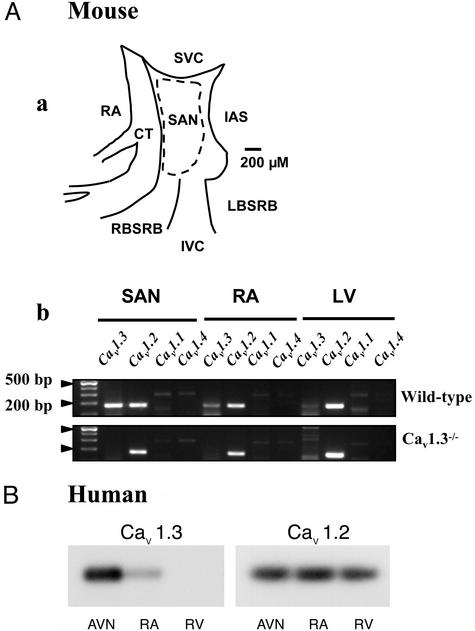
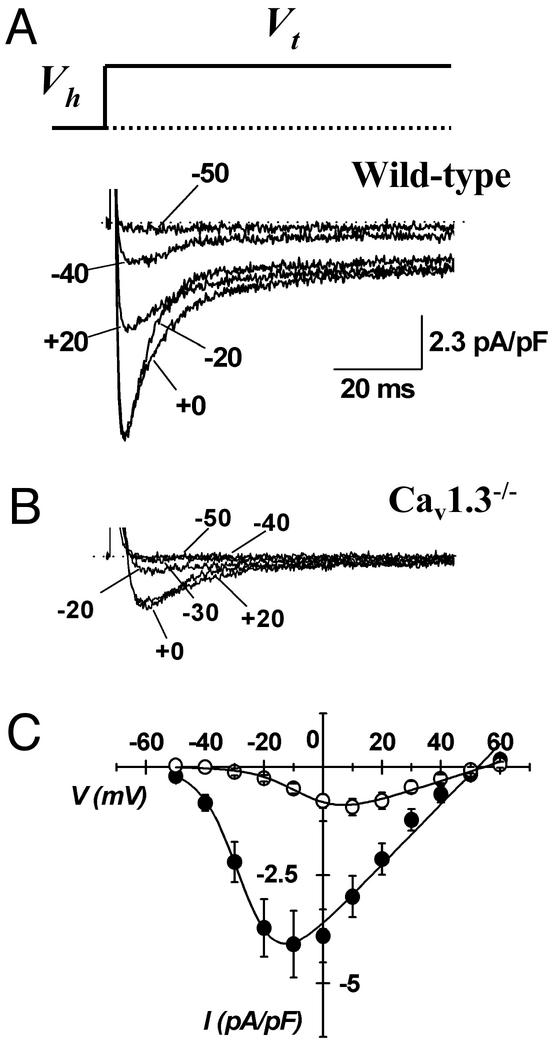
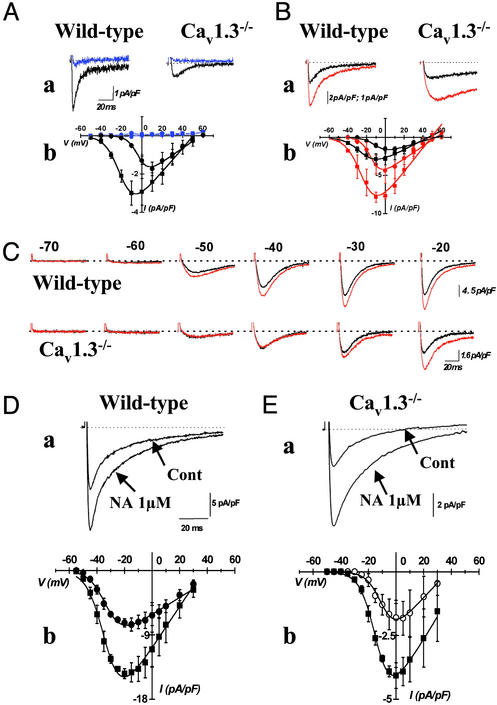
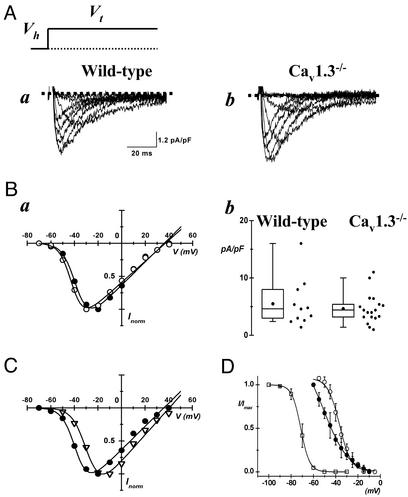
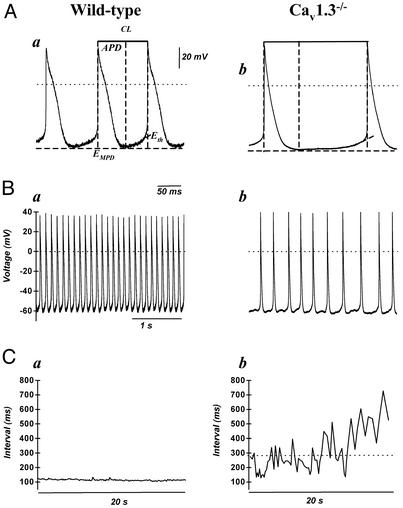
The spontaneous activity of pacemaker cells in the sino-atrial node (SAN) controls the heart rhythm and rate under physiological conditions. Pacemaker activity in SAN cells is due to the presence of the diastolic depolarization, a slow depolarization phase that drives the membrane voltage from the end of an action potential to the threshold of a new action potential. SAN cells express a wide array of ionic channels, but we have limited knowledge about their functional role in pacemaker activity and we still do not know which channels play a prominent role in the generation of the diastolic depolarization. It is thus important to provide genetic evidence linking the activity of genes coding for ionic channels to specific alterations of pacemaker activity of SAN cells. Here, we show that target inactivation of the gene coding for alpha(1D) (Ca(v)1.3) Ca(2+) channels in the mouse not only significantly slows pacemaker activity but also promotes spontaneous arrhythmia in SAN pacemaker cells. These alterations of pacemaker activity are linked to abolition of the major component of the L-type current (I(Ca,L)) activating at negative voltages. Pharmacological analysis of I(Ca,L) demonstrates that Ca(v)1.3 gene inactivation specifically abolishes I(Ca,L) in the voltage range corresponding to the diastolic depolarization. Taken together, our data demonstrate that Ca(v)1.3 channels play a major role in the generation of cardiac pacemaker activity by contributing to diastolic depolarization in SAN pacemaker cells.


Figures

Figure 1
Figure 1
(Aa) Experimental landmarks of the mouse SAN used in this study. RA, right atrium; CT, crista terminalis; SVC, superior vena cava; IVC, inferior vena cava; RBSRB, right branch of the sino-atrial ring bundle; LBSRB, left branch of the sino-atrial ring bundle; IAS, interatrial septum. The dotted line indicates the cutting edge used for obtaining SAN tissue samples for RT-PCR and pacemaker cells isolation. (Ab) RT-PCR analysis of Ca2+ channel Cav1 subunits, showing that the Cav1.3 mRNA is detected in both SAN and RA, but not in the left ventricle (LV) of wild-type mice. The Cav1.2 subunit is detected in SAN as well as in the other cardiac chambers. In two independent experiments, no mRNA expression is observed for the Cav1.1 and Cav1.4 subunit. (B) Southern blot analysis of Cav1.3 and Cav1.2 expression in the human heart. Contrary to the Cav1.2 subunit, which showed uniform expression in all cardiac tissues tested, including the right ventricle (RV), mRNA corresponding to Cav1.3 was found only in the atrioventricular node (AVN) and the RA.
Figure 2
Figure 2
Samples traces of ICa,L in SAN cells from wild-type (A) and homozygous Cav1.3−/− (B) mice. Recordings have been obtained by applying depolarizing voltage steps at variable voltages (Vt) indicated by arrows. Steps lasted 80 ms. Dotted lines indicate the zero current level. Holding potential (Vh) was −60 mV. (C) Averaged I–V relations of ICa,L in pacemaker cells from wild-type (filled circles) and Cav1.3−/− (open circles) mice, obtained from 21 independent experiments at a given voltage. Errors bars represent the SEM.
Figure 3
Figure 3
(A) ICa,L is blocked by application of 0.2 μM isradipine in SAN cells from both mouse strains. ICa,L has been recorded from a holding potential of −60 mV, and sample traces corresponding to a test potential of −10 mV in SAN cells from wild-type and +10 mV in cells from Cav1.3 mice are shown. Traces (Aa) and I–V relations recorded in the presence of isradipine are displayed in blue (Aa). (Ab) Averaged IV relations of ICa,L in cells from wild-type (filled squares) and Cav1.3−/− (filled circles) mice. (B) Up-regulation of ICa,L by 1 μM BayK. Experimental protocol is the same as in A. Sample traces (Ba) and I–V curves (Bb) obtained in the presence of BayK are displayed in red. Circles and squares as in A. (C) Application of BayK reveals threshold for activation of ICa,L in wild-type and Cav1.3−/− SAN cells. Stepping from a holding potential of −80 mV to the test potentials as indicated activate both ICa,T and ICa,L. Dotted lines indicate the zero current level. Traces shown are representative of five wild-type and four Cav1.3−/− cells recorded during three independent experiments. (D and E) Stimulation of ICa,L by 1 μM noradrenaline (NA) in SAN cells from wild-type (D) and Cav1.3−/− (E) mice. The effect of NA on sample traces is shown in a. Same voltage protocol and test potential as in A, for both wild-type and Cav1.3−/− cells, except the step duration, which lasted 100 mS. The effect of NA on averaged I–V relations is shown in b. Filled and open circles represent experimental data obtained in cells from wild-type and Cav1.3−/− cells, respectively. Filled squares represent experimental points obtained in the presence of NA.
Figure 4
Figure 4
(A) Sample traces recorded from wild-type (Aa) and Cav1.3−/− (Ab) mice. Records of ICa,T are shown after subtraction of ICa,L measured from a Vh of −60 mV from total ICa recorded from a Vh of −80 mV (see Materials and Methods). (Ba) Superimposition of corresponding I–V relations from cells shown in A (filled circles, wild type; open circles, Cav1.3−/−). (Bb) Box histogram showing ICa,T peak densities in SAN cells from wild-type and Cav1.3−/− mice. Filled circles in boxes represent the mean density. Corresponding 25th and 75th percentiles define the box. The 5th and the 95th percentiles define whiskers. Experimental data points are shown on the right of the corresponding box. (C) Superimposition of ICa,T measured in wild-type cells (filled circles) and the difference ICa,L obtained by subtracting the averaged ICa,L measured in Cav1.3−/− cells from the total ICa,L of wild-type cells (open triangles). (D) Steady-state inactivation curves for ICa,T in SAN cells from Cav1.3−/− (open squares) and for ICa,L in wild-type (filled circles) and Cav1.3−/− (open circles) mice. Preconditioning steps were applied for 5 s at voltages indicated in the abscissa. ICa,T and ICa,L were then evoked at a test potential of −30 mV and 0 mV, respectively. Test pulses lasted 80 ms. ICa,L inactivation was investigated positive to −60 mV to avoid possible interfering ICa,T. Fitting inactivation curve yielded parameter values of −71 ± 2 mV and −3.4 ± 0.06 for V0.5inact and si, respectively, (n = 3) for ICa,T, −45 ± 2 mV and 10 ± 0.2 for wild-type ICa,L, and −36 ± 2 mV and 4.6 ± 0.4 for ICa,L measured in Cav1.3−/− cells.
Figure 5
Figure 5
(A) Representative sweeps of consecutive action potentials recorded in pacemaker cells from wild-type (Aa) and Cav1.3−/− (Ab) mice. The cycle length (CL) is defined as the time interval (in ms) between two consecutive action potentials. The action potential duration (APD) is defined as the interval between the maximum diastolic potential (EMDP) and the action potential threshold (Eth). (B) Cellular arrhythmia is evident as irregular cycle length duration in Cav1.3−/− cells (Bb) compared with wild-type cells (Ba). In A and B, dotted lines indicate the zero voltage level. Reference dotted lines used for calculations of the action potential parameters are also shown. (C) Examples of measurements of the cycle length show arrhythmia and negative chronotropism in Cav1.3−/− pacemaker cells. Wild-type cells display regular interval over 20-s-long recording periods. In contrast, the strong dispersion of measurements demonstrates erratic pacing rate in Cav1.3−/− cells (Cb). Furthermore, negative chronotropism is evident as an increased mean cycle length, as indicated by the dotted line.

References

    1. Weidmann S. In: The Slow Inward Current and Cardiac Arrhythmias. Zipes D P, Bailey J C, Elharrar V, editors. The Hague, The Netherlands: Nijoff; 1980. pp. 3–9.
    1. DiFrancesco D. Annu Rev Physiol. 1993;55:455–472. - PubMed
    1. Noma A. Jpn Heart J. 1996;37:673–682. - PubMed
    1. Hagiwara N, Irisawa H, Kameyama M. J Physiol (London) 1988;395:233–253. - PMC - PubMed
    1. Mangoni M E, Nargeot J. Cardiovasc Res. 2001;52:51–64. - PubMed

Publication types