. 2003;4(4):R24.
doi: 10.1186/gb-2003-4-4-r24. Epub 2003 Mar 17.

Haplotypic analysis of the TNF locus by association efficiency and entropy

Affiliations

Haplotypic analysis of the TNF locus by association efficiency and entropy

Hans Ackerman et al. Genome Biol. 2003.

Abstract

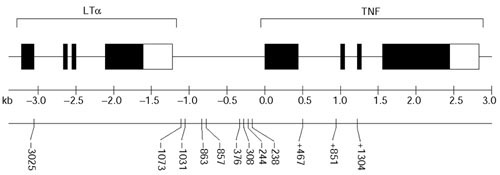
Background: To understand the causal basis of TNF associations with disease, it is necessary to understand the haplotypic structure of this locus. We genotyped 12 single-nucleotide polymorphisms (SNPs) distributed over 4.3 kilobases in 296 healthy, unrelated Gambian and Malawian adults. We generated 592 high-quality haplotypes by integrating family- and population-based reconstruction methods.

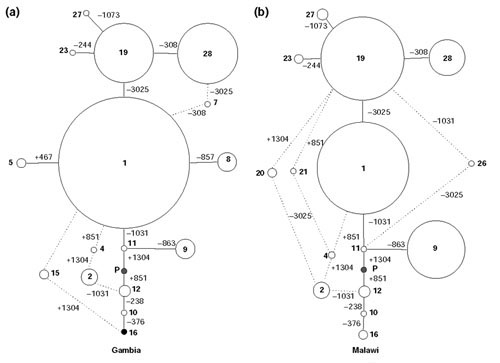
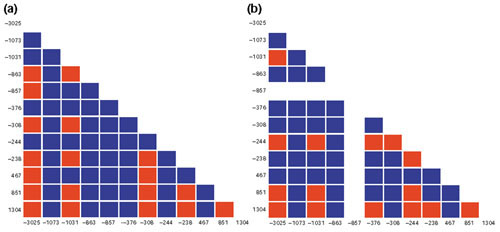
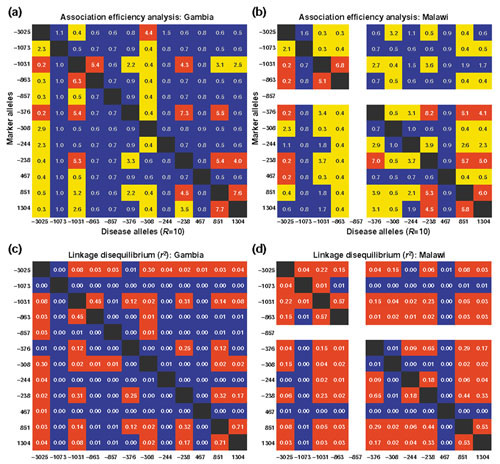
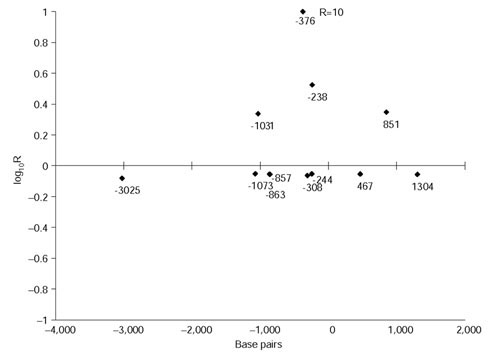
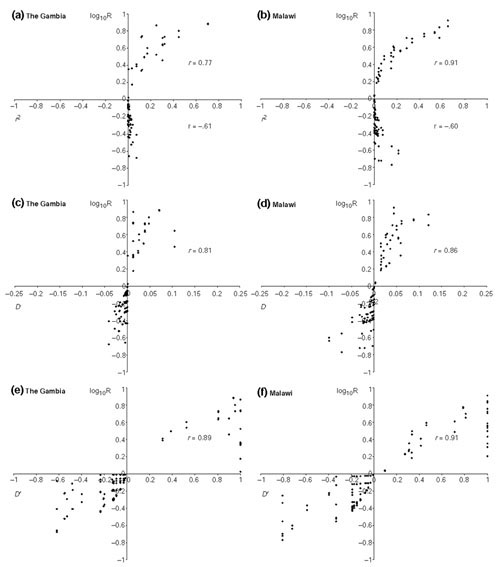
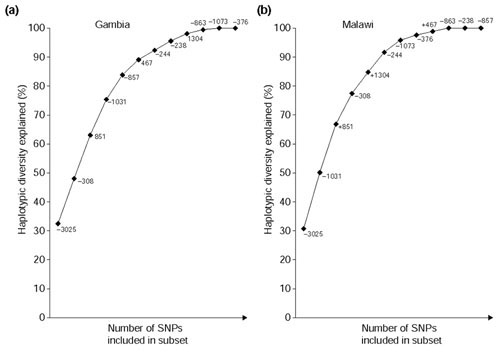
Results: We found 32 different haplotypes, of which 13 were shared between the two populations. Both populations were haplotypically diverse (gene diversity = 0.80, Gambia; 0.85, Malawi) and significantly differentiated (p < 10-5 by exact test). More than a quarter of marker pairs showed evidence of intragenic recombination (29% Gambia; 27% Malawi). We applied two new methods of analyzing haplotypic data: association efficiency analysis (AEA), which describes the ability of each SNP to detect every other SNP in a case-control scenario; and the entropy maximization method (EMM), which selects the subset of SNPs that most effectively dissects the underlying haplotypic structure. AEA revealed that many SNPs in TNF are poor markers of each other. The EMM showed that 8 of 12 SNPs (Gambia) and 7 of 12 SNPs (Malawi) are required to describe 95% of the haplotypic diversity.

Conclusions: The TNF locus in the Gambian and Malawi sample is haplotypically diverse and has a rich history of intragenic recombination. As a consequence, a large proportion of TNF SNPs must be typed to detect a disease-modifying SNP at this locus. The most informative subset of SNPs to genotype differs between the two populations.


Figures

Figure 1
Figure 1
Diagram of the TNF locus drawn to scale with SNPs indicated. Filled boxes represent exons and the open boxes represent the 3' untranslated region (3' UTR). Positions are given in number of base pairs relative to the transcriptional start of TNF. The SNP at position -3025 is also referred to as an LTα NcoI restriction fragment length polymorphism in some references.
Figure 2
Figure 2
Minimum mutation networks of the TNF haplotypes. (a) The Gambian and (b) the Malawian population. Each circle represents a haplotype, and the size of the circle is proportional to the haplotype frequency. Each connecting line corresponds to a mutational event, and the position of the resulting SNP is indicated in base pairs from the transcriptional start of the gene. Broken lines indicate recombination. The numbers correspond to the haplotype indentifiers listed in Table 2. Filled circles represent haplotypes that were not found in that population. The haplotype labelled 'P' was found in two chimpanzees, a gorilla, and two orang utans. Haplotypes of frequency less than 1% are not shown.
Figure 3
Figure 3
Recombination in the TNF gene region. (a) Four-gamete test, The Gambia; (b) four-gamete test, Malawi. Red squares indicate pairs of SNPs in which all four gametes were observed, which is evidence for recombination or recurrent mutation.
Figure 4
Figure 4
Association efficiency and linkage disequilibrium parameters for 12 SNPs at the TNF locus. (a) AEA, Gambia; (b) AEA, Malawi; (c) linkage disequilibrium, Gambia; (d) linkage disequilibrium, Malawi. The apparent relative risk at the marker allele indicated in the leftmost column is given when the hypothetical disease allele indicated in the bottom row is assigned a relative risk of 10. In (a,b) color indicates the magnitude of the apparent relative risk: blue indicates a relative risk of less than twofold, yellow between two- and fourfold, and red between fourfold and the maximum of 10-fold. In (c,d) red indicates p < 0.05 by the chi-squared test, uncorrected for multiple tests.
Figure 5
Figure 5
AEA of the TNF-376 SNP. The TNF-376 SNP is assigned a hypothetical relative risk of 10, and the apparent relative risk at all other TNF SNPs is plotted on a log10 scale (log10R). The positions of the other SNPs are indicated on the x-axis as base pairs from the start of transcription. Eight of the SNPs in the TNF gene would give a relative risk between 0.8 and 0.9 when the TNF-376 SNP gives a hypothetical relative risk of 10.
Figure 6
Figure 6
Plots of the AEA parameter versus linkage disequilibrium (LD) for all pairs of SNPs. The apparent relative risk for all marker SNPs (when paired with a hypothetical disease SNP of relative risk = 10) is plotted on a log10 scale against measures of LD in (a,c,e) the Gambian and (b,d,f) the Malawian populations. The AEA parameter is plotted against (a,b) r2, (c,d) D, and (e,f) D'. The correlation coefficient (r) between the AEA parameter and the measure of LD is indicated on each graph.
Figure 7
Figure 7
Results of the entropy maximization method. Plots of the percentage of haplotypic diversity accounted for by a subset of SNPs as the size of the subset goes from 1 SNP to 12 SNPs. The individual SNPs are labeled on the plot. The percentage is calculated as the entropy of the haplotype frequencies as defined by the best n-SNP subset divided by the entropy of the haplotype frequencies as defined by all 12 SNPs, as n goes from 1 to 12. Note that the order in which SNPs are included in an optimum subset differs between the two populations.

References

    1. McGuire W, Hill AV, Allsopp CE, Greenwood BM, Kwiatkowski D. Variation in the TNF-alpha promoter region associated with susceptibility to cerebral malaria. Nature. 1994;371:508–510. - PubMed
    1. McGuire W, Knight JC, Hill AV, Allsopp CE, Greenwood BM, Kwiatkowski D. Severe malarial anemia and cerebral malaria are associated with different tumor necrosis factor promoter alleles. J Infect Dis. 1999;179:287–290. - PubMed
    1. Knight JC, Udalova I, Hill AV, Greenwood BM, Peshu N, Marsh K, Kwiatkowski D. A polymorphism that affects OCT-1 binding to the TNF promoter region is associated with severe malaria. Nat Genet. 1999;22:145–150. - PubMed
    1. Knight JC, Kwiatkowski D. Inherited variability of tumor necrosis factor production and susceptibility to infectious disease. Proc Assoc Am Physicians. 1999;111:290–298. - PubMed
    1. Dunstan SJ, Stephens HA, Blackwell JM, Duc CM, Lanh MN, Dudbridge F, Phuong CX, Luxemburger C, Wain J, Ho VA, et al. Genes of the class II and class III major histocompatibility complex are associated with typhoid fever in Vietnam. J Infect Dis. 2001;183:261–268. - PubMed

Publication types

Substances