

doi: 10.1186/gb-2003-4-4-r28.
Epub 2003 Mar 25.
GoMiner: a resource for biological interpretation of genomic and proteomic data
Affiliations
- PMID: 12702209
- PMCID: PMC154579
- DOI: 10.1186/gb-2003-4-4-r28
Item in Clipboard
GoMiner: a resource for biological interpretation of genomic and proteomic data
Genome Biol.
2003.
Abstract
We have developed GoMiner, a program package that organizes lists of 'interesting' genes (for example, under- and overexpressed genes from a microarray experiment) for biological interpretation in the context of the Gene Ontology. GoMiner provides quantitative and statistical output files and two useful visualizations. The first is a tree-like structure analogous to that in the AmiGO browser and the second is a compact, dynamically interactive 'directed acyclic graph'. Genes displayed in GoMiner are linked to major public bioinformatics resources.
Figures
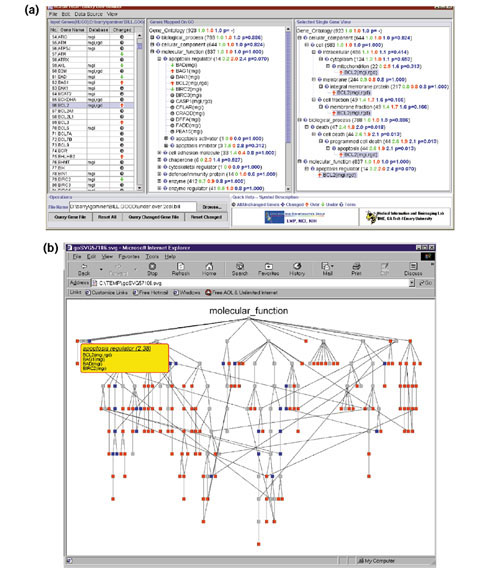
GoMiner displays for microarray gene-expression data on prostate cancer cell line DU145 and a subline (RC0.1) selected for resistance to a topoisomerase 1 inhibitor. (a) Tree-like display showing underexpressed genes (green down-arrows), overexpressed genes (red up-arrows), and unchanged genes (gray circles) in the GO 'Apoptosis Regulator' category and its subcategories. The blue number indicates a 2.4-fold enrichment of changed genes in this category. The p-value (Fisher's exact) indicates that, despite this degree of enrichment, the small total number of genes (14) in this category prevents statistical significance. (b) Dynamically generated SVG graphic of the 'Biological Process' DAG with genes in the GO 'Apoptosis Regulator' category opened in a pull-down list by mousing-over. Categories enriched more than 1.5-fold with flagged genes are color-coded red; those depleted more than 1.5-fold are blue. The rest of the categories are gray.
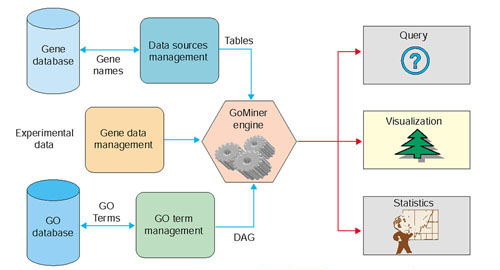
Schematic of GoMiner architecture and data flow.
References
Publication types
MeSH terms
LinkOut - more resources
Full Text Sources
Other Literature Sources
Molecular Biology Databases
