. 2003 Jun 1;549(Pt 2):613-23.
doi: 10.1113/jphysiol.2003.042267. Epub 2003 Apr 17.

Contribution of adenosine to the depression of sympathetically evoked vasoconstriction induced by systemic hypoxia in the rat

Affiliations

Contribution of adenosine to the depression of sympathetically evoked vasoconstriction induced by systemic hypoxia in the rat

Andrew M Coney et al. J Physiol. .

Abstract

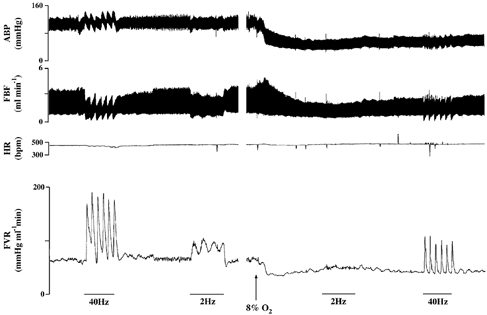
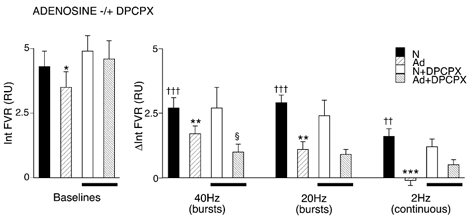
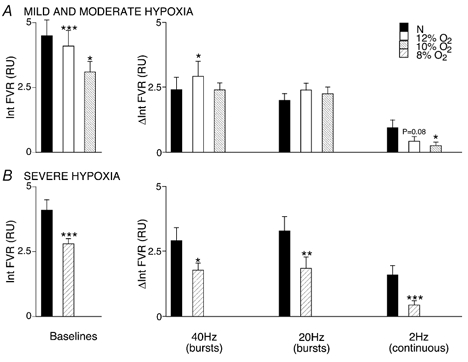
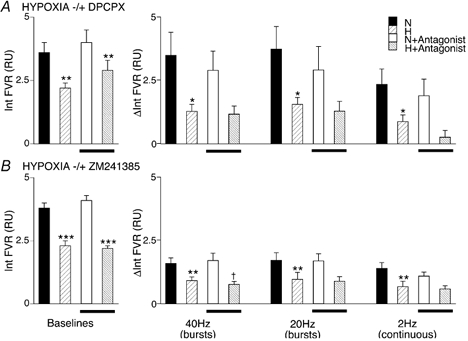
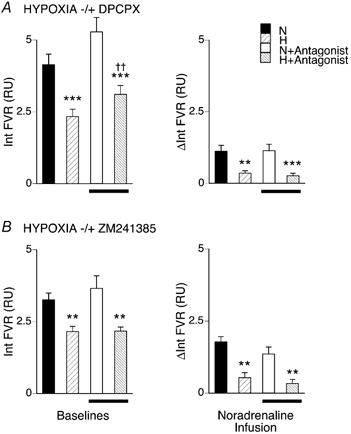
Previous studies have shown that systemic hypoxia evokes vasodilatation in skeletal muscle that is mediated mainly by adenosine acting on A1 receptors, and that the vasoconstrictor effects of sympathetic nerve activity are depressed during hypoxia. The aim of the present study was to investigate the role of adenosine in this depression. In anaesthetised rats, increases in femoral vascular resistance (FVR) evoked by stimulation of the lumbar sympathetic chain with bursts of impulses at 40 or 20 Hz were greater than those evoked by continuous stimulation at 2 Hz with the same number of impulses (120) over 1 min. All of these responses were substantially reduced by infusion of adenosine or by graded systemic hypoxia (breathing 12, 10 or 8 % O2), increases in FVR evoked by continuous stimulation at 2 Hz being most vulnerable. Blockade of A1 receptors ameliorated the depression caused by adenosine infusion of the increase in FVR evoked by 2 Hz only and did not ameliorate the depression caused by 8 % O2 of increases in FVR evoked by any pattern of sympathetic stimulation. A2A receptor blockade accentuated hypoxia-induced depression of the increase in FVR evoked by burst stimulation at 40 Hz, but had no other effect. Neither A1 nor A2A receptor blockade affected the depression caused by hypoxia (8 % O2) of the FVR increase evoked by noradrenaline infusion. These results indicate that endogenously released adenosine is not responsible for the depression of sympathetically evoked muscle vasoconstriction caused by systemic hypoxia; adenosine may exert a presynaptic facilitatory influence on the vasoconstrictor responses evoked by bursts at high frequency.


Figures

Figure 1
Figure 1. An example of raw data recorded during a bursting pattern (40 Hz) and a continuous pattern (2 Hz) of sympathetic nerve stimulation during normoxia and severe hypoxia
Stimulation is indicated by the bars. Following 2 Hz stimulation in normoxia and prior to the start of 8 % O2, there was a period of 3 min of stable normoxic baseline, which has been omitted for illustration purposes.
Figure 2
Figure 2. Effect of exogenous adenosine on vasoconstrictor responses evoked in hindlimb muscle by different patterns of sympathetic stimulation
The graph on the left shows baseline values from which responses to sympathetic stimulation were evoked, as shown in the graph on the right. Conditions under which baselines and responses were evoked are shown by different shading (see key): breathing 21 % O2, normoxia (N), adenosine infusion (Ad), baselines and responses recorded during normoxia and during adenosine infusion after A1 blockade are shown as N + DPCPX and Ad + DPCPX, respectively, as indicated by bars below the columns. Baselines and responses are shown as the integral of FVR (Int FVR) and change in the integral of FVR from baseline (ΔInt FVR) over 1 min (mean ±s.e.m.). †Significant difference between the values recorded during sympathetic stimulation and baseline during normoxia. *Significant difference between values recorded during N and Ad. §Significant difference between the value recorded before and after DPCPX. In each case, 1, 2 and 3 symbols indicate P < 0.05, P < 0.01 and P < 0.001, respectively. Sympathetic fibres were stimulated with bursts at 40 or 20 Hz, or continuously at 2 Hz, as indicated below the columns. Each period of stimulation comprised 120 pulses over 1 min; for further details see text.
Figure 3
Figure 3. Effects of graded levels of systemic hypoxia on vasoconstrictor responses evoked in hindlimb muscle by different patterns of sympathetic stimulation
The graphs on the left in A and B show baseline values of FVR recorded under different experimental conditions and those on the right show changes in FVR from baseline evoked by sympathetic stimulation as Int FVR and ΔInt FVR over 1 min, as described for Fig. 2. A, baseline and responses evoked in normoxia (breathing 21 % O2) and during mild and moderate hypoxia (breathing 12 and 10 % O2, respectively). B, baseline and responses evoked during normoxia and severe hypoxia (breathing 8 % O2). *Significant difference between the response evoked in normoxia and hypoxia. In each case, 1, 2 and 3 symbols indicate P < 0.05, P < 0.01 and P < 0.001, respectively. For simplicity, symbols have not been included for changes evoked by sympathetic stimulation (see Fig. 1); all changes were significant at the P < 0.001 or P < 0.01 levels.
Figure 4
Figure 4. Effects of A1 or A2a receptor blockade on the attenuation produced by systemic hypoxia of vasoconstrictor responses evoked by different patterns of sympathetic stimulation in hindlimb muscle
The graphs on the left in A and B show baseline values, and those on the right show changes in Int FVR, as described for Figs 2 and 3: N and H indicate baselines and changes recorded during normoxia (breathing 21 % O2) and hypoxia (breathing 8 % O2) respectively, bars below columns indicating values recorded after DPCPX (A) or ZM241385 (B). *Significant difference between values recorded during normoxia and hypoxia before or after antagonist. †Significant difference between values recorded before and after antagonist. For each case, 1, 2 and 3 symbols indicate P < 0.05, P < 0.01 and P < 0.001, respectively.
Figure 5
Figure 5. Effects of hypoxia on the vasoconstriction evoked in hindlimb muscle by NA infusion before and after A1 or A2a blockade
The graphs on the left show baseline values and changes in Int FVR over 1 min evoked by NA infusions, as described for Figs 2 and 3. N and H indicate values recorded during normoxia and hypoxia (breathing 21 % or 8 % O2, respectively). Bars below columns indicate values recorded after DPCPX (A) or ZM241385 (B). *Significant difference between values recorded during normoxia and hypoxia before or after antagonist. †Significant difference between values recorded before and after antagonist. In each case, 1, 2 and 3 symbols indicate P < 0.05, P < 0.01 and P < 0.001, respectively.

References

    1. Bartlett IS, Marshall JM. Analysis of the effects of graded levels of hypoxia on noradrenaline-evoked contraction in the rat iliac artery in vitro. Exp Physiol. 2002;87:171–184. - PubMed
    1. Bishay M, Coney AM, Johnson CD, Marshall JM. Role of nitric oxide in vasoconstriction evoked in skeletal muscle of the rat by different patterns of sympathetic stimulation. J Physiol. 2000;523:249P.
    1. Bryan PT, Marshall JM. Adenosine receptor subtypes and vasodilatation in rat skeletal muscle during systemic hypoxia: a role for A1 receptors. J Physiol. 1999;514:151–162. - PMC - PubMed
    1. Burnstock G. Vascular control by purines with emphasis on the coronary system. Eur Heart J. 1989;10:15–21. - PubMed
    1. Coney AM, Marshall JM. Modulation by adenosine of vasoconstriction evoked in rat skeletal muscle by different patterns of sympathetic nerve stimulation. J Physiol. 1999a;515:142P.

Publication types

LinkOut - more resources