. 2003 May;9(5):618-30.
doi: 10.1261/rna.5260303.

Analysis of the stimulatory effect of splicing on mRNA production and utilization in mammalian cells

Affiliations

Analysis of the stimulatory effect of splicing on mRNA production and utilization in mammalian cells

Shihua Lu et al. RNA. 2003 May.

Abstract

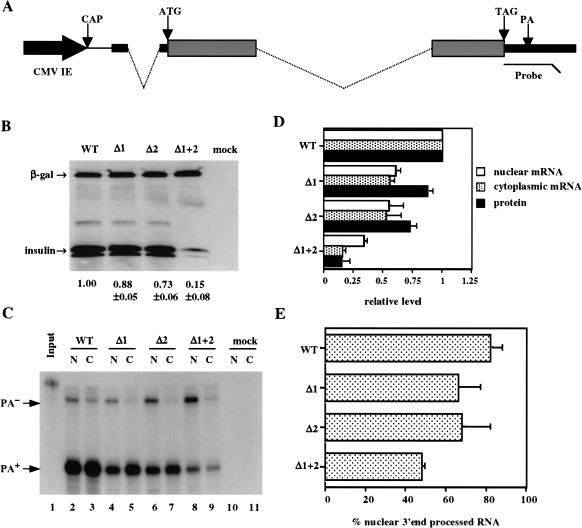
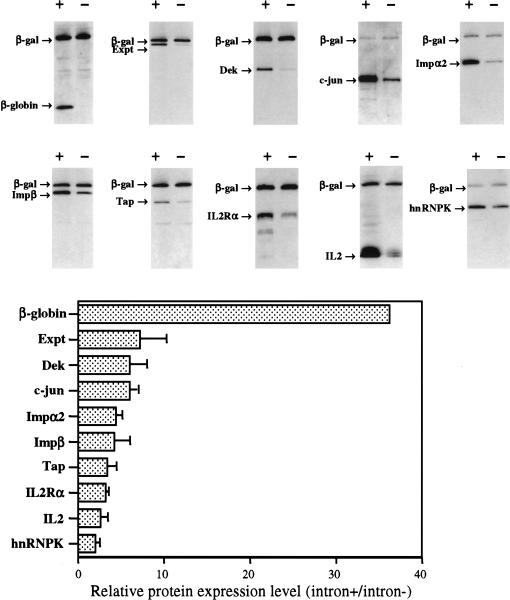
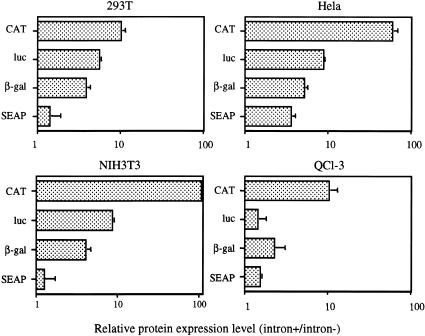
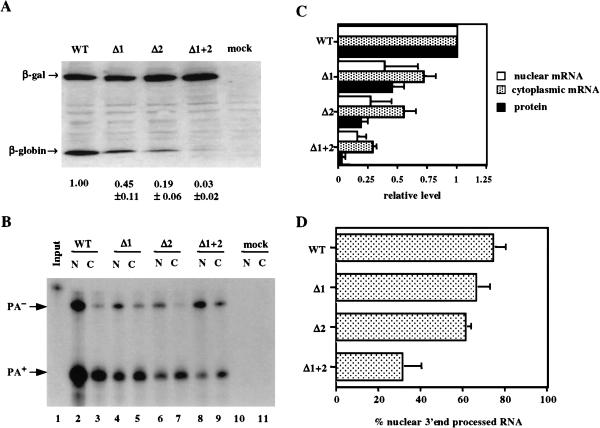
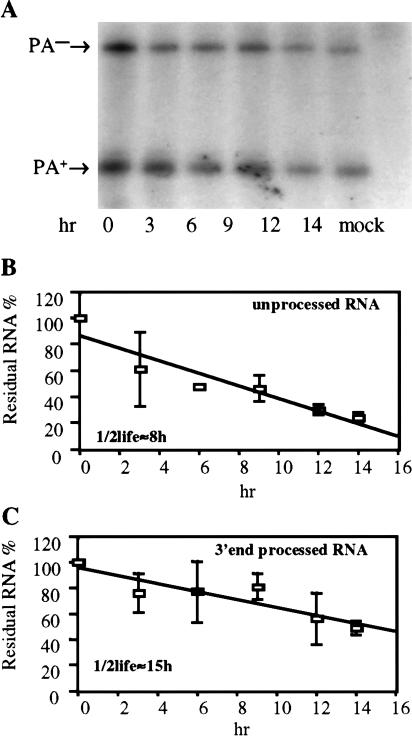
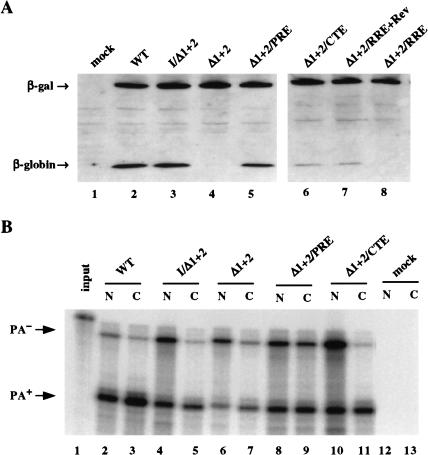
We have examined how splicing affects the expression of a range of human and nonhuman genes in vertebrate cells. Although our data demonstrate that splicing invariably enhances the level of gene expression, this positive effect is generally moderate. However, in the case of the human beta-globin gene, splicing is essential for significant protein expression. In the absence of introns, 3' end processing is inefficient, and this appears to be causally linked to a significant decrease in the level of both nuclear and cytoplasmic 3' end-processed RNA. In contrast, splicing appears to only modestly enhance nuclear mRNA export. Consistent with this observation, intronless beta-globin gene expression was only partially rescued by the insertion of retroviral nuclear mRNA export elements. Surprisingly, in the case of the highly intron dependent beta-globin gene, the mRNA that did reach the cytoplasm was also only inefficiently translated if it derived from an intronless expression plasmid. Together, these data argue that splicing can increase gene expression by enhancing mRNA 3' end processing, and hence, mRNA production. Moreover, in the case of the highly intron-dependent beta-globin gene, splicing also significantly enhanced the translational utilization of cytoplasmic beta-globin mRNAs.


Figures

FIGURE 1.
FIGURE 1.
Effect of splicing on insulin gene expression. (A) Schematic representation of pCMV/WT/INS. The black arrow represents the CMV-IE promoter inserted 5′ to the genomic rat preproinsulin II gene. The insulin 5′ and 3′ UTRs are indicated by thick lines, the coding regions by gray boxes, and the introns by dotted lines. The thin line represents 5′ UTR sequences contributed by the CMV-IE promoter. ATG, translation initiation codon; TAG, translation termination codon; CAP, transcription start site; PA, polyadenylation site. The location of the RPA probe used to quantitate insulin RNA expression is also indicated. (B) Western analysis of insulin expression levels. 293T cells were mock transfected or transfected with 400 ng of pCMV/WT/INS, pCMV/δ1/INS, pCMV/δ2/INS, or pCMV/δ1+2/INS, together with 200 ng pCMV/β-gal as an internal control. (C) This RPA measures the expression level of unprocessed (PA) or 3′ end-processed (PA+) insulin RNA encoded by pCMV/WT/INS, pCMV/δ1/INS, pCMV/δ2/INS, or pCMV/δ1+2/INS, in the nucleus [N] or cytoplasm [C] of 293T cells either mock transfected or transfected with 400 ng of the above expression plasmids. The RPA probe used is shown in lane 1 (1% of input). (D) The level of expression of nuclear and cytoplasmic 3′ end-processed insulin RNA or insulin protein is shown normalized to the level seen in 293T cells transfected with pCMV/WT/GLB, which is arbitrarily set at 1. Average of three experiments with SD indicated. (E) The level of nuclear 3′ end-processed insulin RNA in 293T cells transfected with the indicated expression plasmids is given as a percentage of total nuclear RNA, as quantified by RPA.
FIGURE 2.
FIGURE 2.
Effect of intron inclusion on the level of expression of a range of human genes. Western analysis of the level of protein expression for each of 10 different genes in 293T cells transfected with 400 ng each of a matched intron+ or intron expression plasmid, together with pCMV/β-gal as an internal control. The relative increase in the level of expression of each protein that is seen upon intron inclusion is indicated at the bottom after normalization to the internal control. An average of three independent experiments with standard deviation is indicated. (The intronless β-globin construct gave rise to a level of protein expression that was 2.8 ± 1.8% of the level seen when an intron was present in cis.)
FIGURE 3.
FIGURE 3.
Effect of intron inclusion on the expression of indicator genes in four cell lines. 293T, HeLa, NIH3T3, and quail QCl-3 cells were transfected with 200 ng each of a matched intron+ or intron plasmid encoding CAT, β-gal, luc, or SEAP. Cells were also transfected with pCMV/β-gal or pCMV/CAT as an internal control. The fold increase seen upon intron inclusion is indicated, after correction for the internal control. An average of three experiments with SD is indicated.
FIGURE 4.
FIGURE 4.
Effect of introns on β-globin gene expression. (A) Western analysis of β-globin expression levels. 293T cells were either mock transfected or transfected with 400 ng of pCMV/WT/GLB, pCMV/δ1/GLB, pCMV/δ2/GLB, or pCMV/δ1+2/GLB together with 200 ng pCMV/β-gal as an internal control. (B) This RPA was performed as described in Figure 1C ▶. (C) This quantitation was performed as described in Figure 1D ▶. (D) The level of nuclear 3′ end-processed β-globin RNA in 293T cells transfected with the indicated expression plasmids is given as a percentage of total nuclear β-globin RNA, as determined by RPA.
FIGURE 5.
FIGURE 5.
Half-life of β-globin RNAs. (A) This RPA measures the relative level of total 3′ end-processed (PA+) and unprocessed (PA) RNA in 293T cells transfected with the intronless pCMV/δ1+2/GLB plasmid after incubation with the transcription inhibitor actinomycin D for the indicated number of hours. (B) This figure shows the rate of decay of the unprocessed β-globin RNA, determined as shown in (A). An average of three independent experiments with SD is indicated. (C) Same as (B), except that the rate of decay of the 3′ end-processed RNA encoded by pCMV/δ1+2/GLB is measured. Analogous experiments were also performed using 293T cells transfected with an intron containing β-globin expression plasmid.
FIGURE 6.
FIGURE 6.
Effect of various viral RNA elements on intronless β-globin gene expression. (A) Western analysis of the β-globin expression level in 293T cells either mock transfected or transfected with 400 ng of the indicated expression plasmid, together with 200 ng pCMV/β-gal as an internal control. (B) This representative RPA was performed as described in Figure 1C ▶.

References

    1. Brinster, R.L., Allen, J.M., Behringer, R.R., Gelinas, R.E., and Palmiter, R.D. 1988. Introns increase transcriptional efficiency in transgenic mice. Proc. Natl. Acad. Sci. 85: 836–840. - PMC - PubMed
    1. Brodsky, A.S. and Silver, P.A. 2000. Pre-mRNA processing factors are required for nuclear export. RNA 6: 1737–1749. - PMC - PubMed
    1. Buchman, A.R. and Berg, P. 1988. Comparison of intron-dependent and intron-independent gene expression. Mol. Cell. Biol. 8: 4395–4405. - PMC - PubMed
    1. Chang, D.D. and Sharp, P.A. 1989. Regulation by HIV Rev depends upon recognition of splice sites. Cell 59: 789–795. - PubMed
    1. Cho, E.J., Takagi, T., Moore, C.R., and Buratowski, S. 1997. mRNA capping enzyme is recruited to the transcription complex by phosphorylation of the RNA polymerase II carboxy-terminal domain. Genes & Dev. 11: 3319–3326. - PMC - PubMed

MeSH terms

LinkOut - more resources