. 2003 May;71(5):2468-77.
doi: 10.1128/IAI.71.5.2468-2477.2003.

Gamma interferon production by hepatic NK T cells during Escherichia coli infection is resistant to the inhibitory effects of oxidative stress

Affiliations

Gamma interferon production by hepatic NK T cells during Escherichia coli infection is resistant to the inhibitory effects of oxidative stress

Guochi Zhang et al. Infect Immun. 2003 May.

Abstract

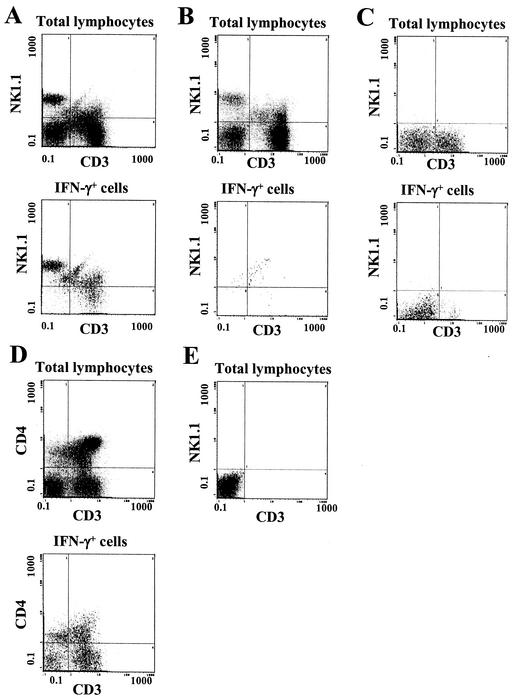
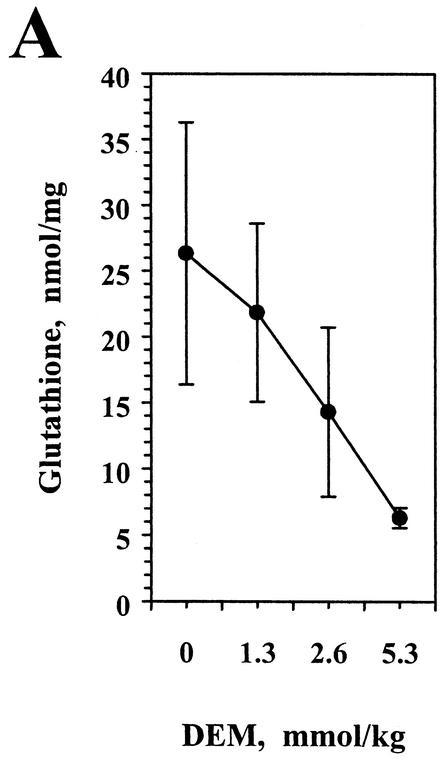
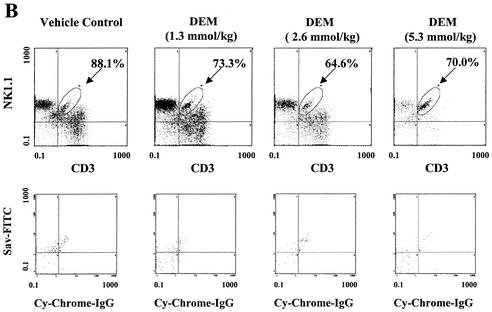
The reductive-oxidative status of tissues regulates the expression of many inflammatory genes that are induced during gram-negative bacterial infections. The cytokine gamma interferon (IFN-gamma) is a potent stimulus for host inflammatory gene expression, and oxidative stress has been shown to inhibit its production in mice challenged with Escherichia coli bacteria. The objective of the present study was to characterize the cells that produced IFN-gamma in a mouse bacterial peritonitis model and determine the effects of oxidative stress on their activation. The liver contained large numbers of IFN-gamma-expressing lymphocytes following challenge with viable E. coli bacteria. The surface phenotypes of IFN-gamma-expressing hepatic lymphocytes were those of natural killer (NK) cells (NK1.1(+) CD3(-)), conventional T cells (NK1.1(-) CD3(+)), and NK T cells (NK1.1(+) CD3(+)). Treating mice with diethyl maleate to deplete tissue thiols significantly impaired IFN-gamma production by NK cells, conventional T cells, and CD1d-restricted NK T cells in response to E. coli challenge. However, IFN-gamma expression by a subset of NK T cells, which did not bind alpha-galactosylceramide-CD1d tetramers, was resistant to the inhibitory effects of tissue oxidative stress. Stress-resistant IFN-gamma-expressing cells were also predominantly CD8(+) and bore gamma delta T-cell antigen receptors. The residual IFN-gamma response by NK T cells may explain previous reports of hepatic gene expression following gram-negative bacterial challenge in thiol-depleted mice. The finding also demonstrates that innate immune cells differ significantly in their responses to altered tissue redox status.


Figures

FIG. 1.
FIG. 1.
Dose- and time-dependent expression of IFN-γ following E. coli challenge. (A) Mice (two per group) were injected i.p. with the indicated quantities of E. coli O111:B4 bacteria or LPS, and serum IFN-γ concentrations were measured 6 h later. This experiment was repeated with similar results. (B) Mice (three per group) were challenged i.p. with 100 μg of LPS, and their sera were collected at the indicated times. The serum IFN-γ concentration was measured by enzyme-linked immunosorbent assay. A similar time course was obtained with mice challenged with viable E. coli bacteria.
FIG. 2.
FIG. 2.
Distribution of IFN-γ-expressing cells among various tissues following i.p. challenge with E. coli bacteria. Mice were injected i.p. with 5 × 10⁷ CFU of E. coli and sacrificed 6 h later. Livers, lymph nodes (LN), spleens, and peritoneal exudate cells (PEC) were then recovered, and suspensions of lymphocytes were prepared as described in Materials and Methods. Intracellular IFN-γ expression was measured by flow cytometry. The results for a representative animal are shown in panel A. The data (means ± standard deviations) for three mice are shown in panel B. The IFN-γ responses of liver lymphocytes were significantly different from those of the cells from the other tissues (P < 0.01). The expression of CD3 by IFN-γ+ cells in the liver and spleen of a representative E. coli-challenged mouse is shown in panel C.
FIG. 3.
FIG. 3.
Phenotypes of hepatic lymphocytes that produce IFN-γ in response to E. coli challenge. Mice were injected i.p. with E. coli bacteria, and their hepatic lymphocytes were prepared 6 h later, treated with brefeldin A, and analyzed by flow cytometry. (A) Expression of CD3 and NK1.1 by various hepatic lymphocyte subsets of a representative E. coli-challenged B6 mouse. (Upper panel) Total hepatic lymphocytes after gating by light scatter; (lower panel) cells gated for the expression of intracellular IFN-γ. (B) Phenotypes of total or IFN-γ-expressing cells from a normal B6 mouse that had not been challenged with bacteria. (C) Analysis of the phenotypes of total and IFN-γ-expressing cells from a representative C3HeB/FeJ mouse, which lacks the NK1.1 allele. (D) Expression of CD3 and CD4 among total and IFN-γ-expressing hepatic lymphocytes of a representative B6 mouse. (E) Lack of staining of B6 hepatic lymphocytes in the absence of primary antibodies.
FIG. 4.
FIG. 4.
Percentages (means ± standard deviations) of total hepatic lymphocytes or hepatic IFN-γ-expressing lymphocytes with the indicated phenotypes (n = 13 mice from four experiments).
FIG. 5.
FIG. 5.
Thiol depletion differentially inhibits IFN-γ production by hepatic lymphocyte subsets. Mice were injected i.p. with the indicated doses of DEM and 2 h later were challenged with E. coli bacteria. Liver lymphocytes were prepared 6 h later, treated with brefeldin A, and stained for intracellular IFN-γ and surface NK1.1 and CD3 expression. (A) Total glutathione content was measured for each liver 6 h postchallenge. The glutathione concentration for the group treated with the highest dose of DEM was significantly different from those for the other treatment groups (P < 0.01). (B) Three-color flow cytometry for a representative mouse in which IFN-γ+ cells were gated and analyzed for NK1.1 and CD3 expression (upper panels). The percentage of IFN-γ+ cells that fell within this gated area for the group receiving 5.3 mmol of DEM/kg was significantly different from those for the other treatment groups (P < 0.01). The double-positive subset expressing relatively low CD3 was then gated (circles), and the percentage of these cells expressing IFN-γ is indicated in each case. The lower panels represent staining in the absence of primary antibodies. (C) The percentage (mean ± standard deviation) of IFN-γ-expressing cells within each subset was determined for each treatment group (four mice per group). The data labeled NK1.1+ CD3+ represent only those double-positive cells that are circled in panel B. This experiment was performed twice with similar results.
FIG. 5.
FIG. 5.
Thiol depletion differentially inhibits IFN-γ production by hepatic lymphocyte subsets. Mice were injected i.p. with the indicated doses of DEM and 2 h later were challenged with E. coli bacteria. Liver lymphocytes were prepared 6 h later, treated with brefeldin A, and stained for intracellular IFN-γ and surface NK1.1 and CD3 expression. (A) Total glutathione content was measured for each liver 6 h postchallenge. The glutathione concentration for the group treated with the highest dose of DEM was significantly different from those for the other treatment groups (P < 0.01). (B) Three-color flow cytometry for a representative mouse in which IFN-γ+ cells were gated and analyzed for NK1.1 and CD3 expression (upper panels). The percentage of IFN-γ+ cells that fell within this gated area for the group receiving 5.3 mmol of DEM/kg was significantly different from those for the other treatment groups (P < 0.01). The double-positive subset expressing relatively low CD3 was then gated (circles), and the percentage of these cells expressing IFN-γ is indicated in each case. The lower panels represent staining in the absence of primary antibodies. (C) The percentage (mean ± standard deviation) of IFN-γ-expressing cells within each subset was determined for each treatment group (four mice per group). The data labeled NK1.1+ CD3+ represent only those double-positive cells that are circled in panel B. This experiment was performed twice with similar results.
FIG. 6.
FIG. 6.
Restriction specificity of NK T cells activated for IFN-γ expression by E. coli challenge. Shown are hepatic lymphocytes from two representative mice of a single experiment. The mice were treated with either vehicle (A) or DEM (B) and then challenged with E. coli bacteria. (Left) Surface phenotypes of the total lymphocyte populations, including two subsets of double-positive cells (subsets A and B); (center) binding of α-GalCer-CD1d tetramers by these two NK T-cell subsets; (right) intracellular IFN-γ staining of the various subsets. This experiment was performed four times with similar results.
FIG. 7.
FIG. 7.
IFN-γ production by cells bearing TCRγδ receptors is resistant to the effects of thiol depletion. B6 mice were treated with vehicle or DEM and then challenged with bacteria. Hepatic lymphocytes expressing intracellular IFN-γ were identified by flow cytometry as described in the Fig. 3 legend, and the surface expression of NK1.1 and TCRγδ was determined. Shown are the percentages of each hepatic lymphocyte subset from the two treatment groups that expressed intracellular IFN-γ. This experiment was performed twice with similar results. The responses of NK cells from DEM-treated mice were significantly different from those of NK cells from vehicle-treated mice (P < 0.01).

Similar articles

Cited by

References

    1. Allen, R. G., and M. Tresini. 2000. Oxidative stress and gene regulation. Free Radic. Biol. Med. 28:463-499. - PubMed
    1. Arase, H., N. Arase, and T. Saito. 1996. Interferon γ production by natural killer (NK) cells and NK1.1+ T cells upon NKR-P1 cross-linking. J. Exp. Med. 183:2391-2396. - PMC - PubMed
    1. Baron, J. L., L. Gardiner, S. Nishimura, K. Shinkai, R. Locksley, and D. Ganem. 2002. Activation of a nonclassical NKT cell subset in a transgenic mouse model of hepatitis B virus infection. Immunity 16:583-594. - PubMed
    1. Behar, S. M., and S. Cardell. 2000. Diverse CD1d-restricted T cells: diverse phenotypes, and diverse functions. Immunology 12:551-560. - PubMed
    1. Bendelac, A., M. N. Rivera, S.-H. Park, and J. H. Roark. 1997. Mouse CD1-specific NK1 T cells: development, specificity, and function. Annu. Rev. Immunol. 15:535-562. - PubMed

Publication types

Substances