. 2003 May;71(5):2839-58.
doi: 10.1128/IAI.71.5.2839-2858.2003.

Pretreatment of mice with streptomycin provides a Salmonella enterica serovar Typhimurium colitis model that allows analysis of both pathogen and host

Affiliations

Pretreatment of mice with streptomycin provides a Salmonella enterica serovar Typhimurium colitis model that allows analysis of both pathogen and host

Manja Barthel et al. Infect Immun. 2003 May.

Abstract

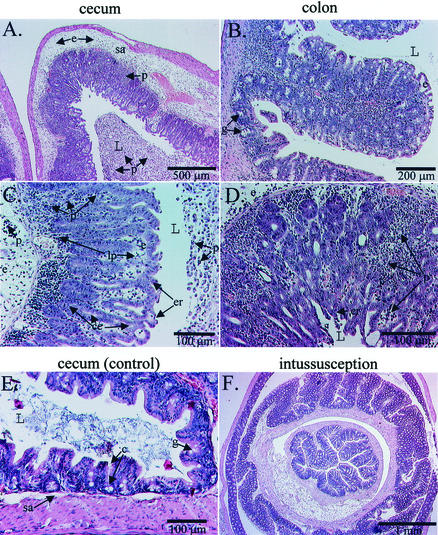
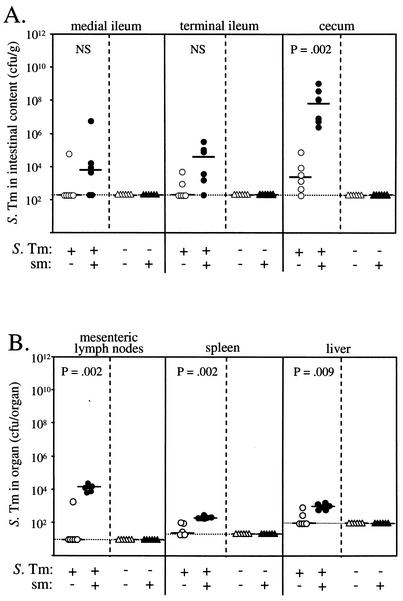
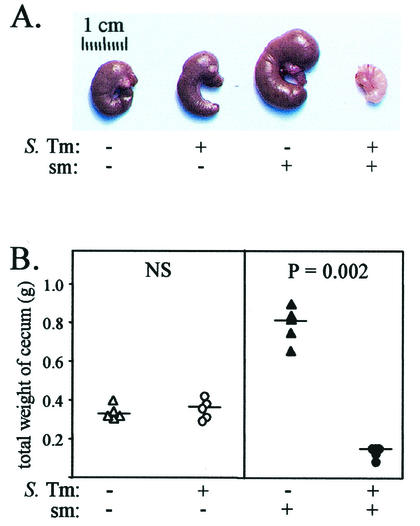
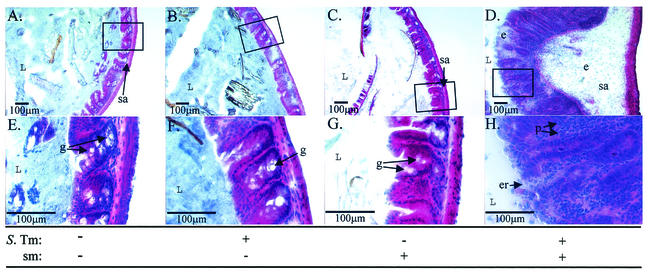
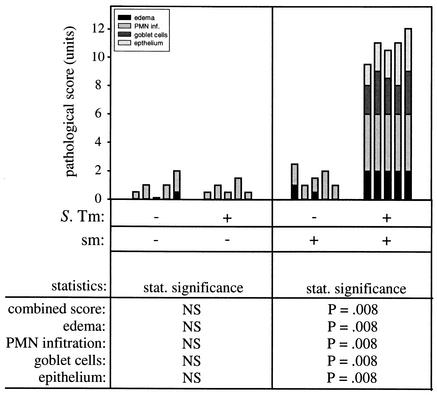
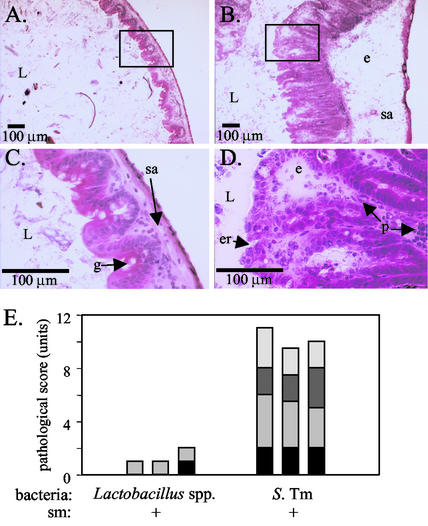
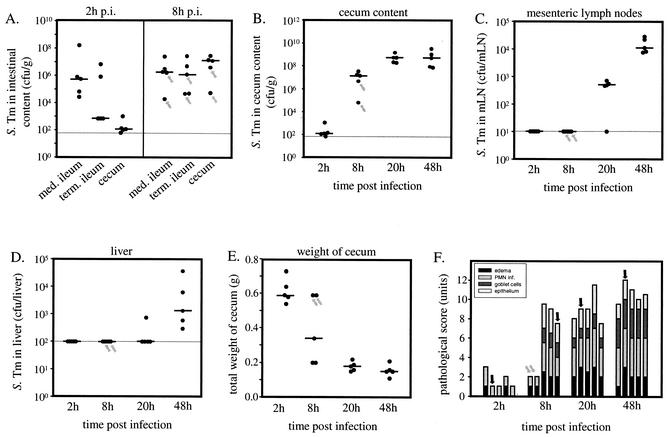
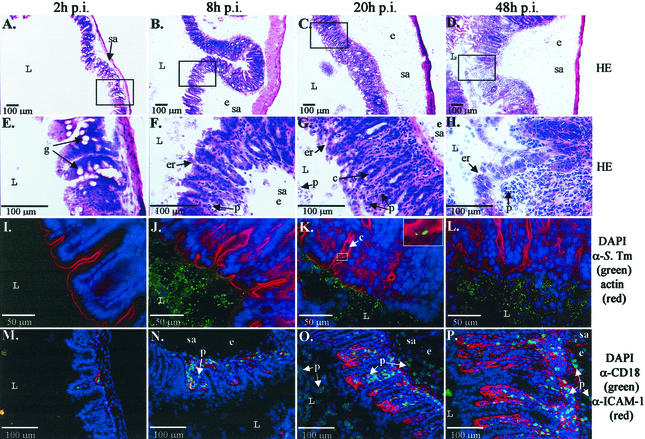
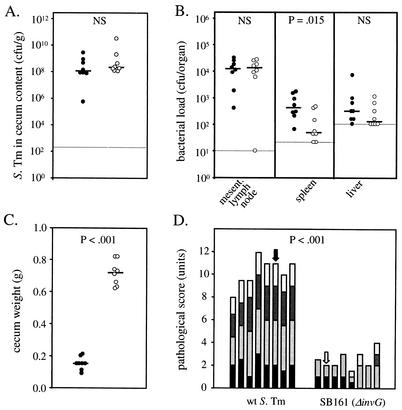
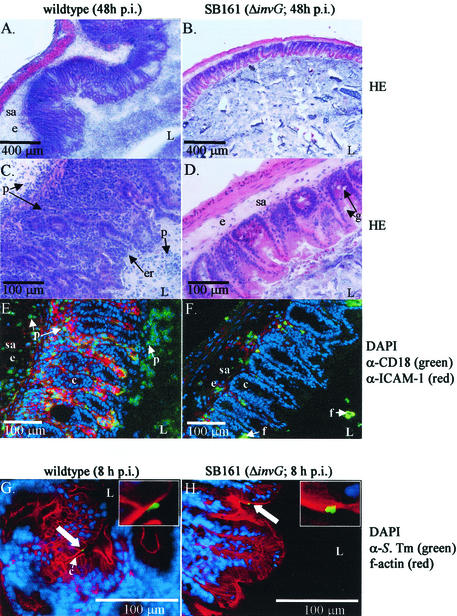
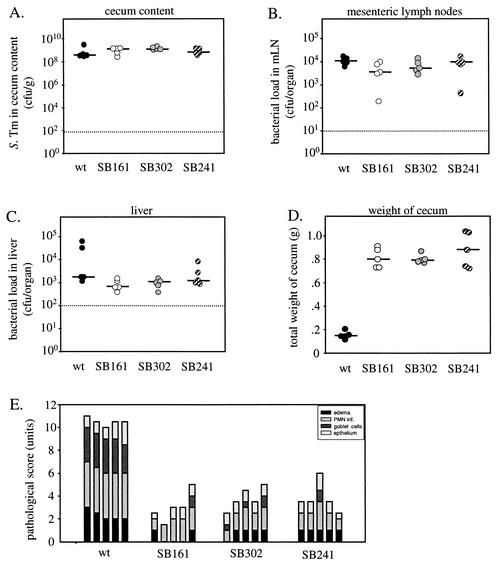
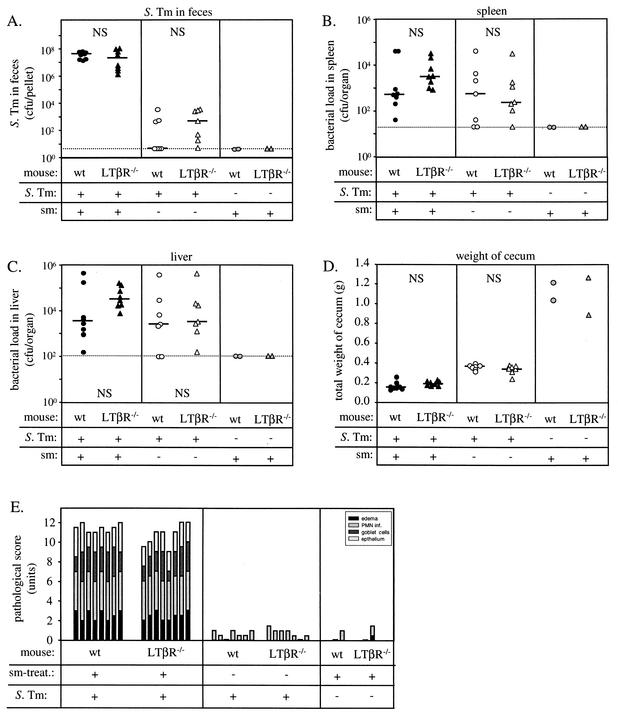
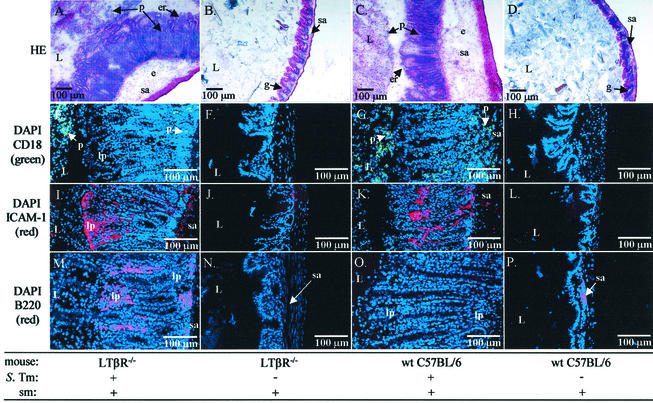
Salmonella enterica subspecies 1 serovar Typhimurium is a principal cause of human enterocolitis. For unknown reasons, in mice serovar Typhimurium does not provoke intestinal inflammation but rather targets the gut-associated lymphatic tissues and causes a systemic typhoid-like infection. The lack of a suitable murine model has limited the analysis of the pathogenetic mechanisms of intestinal salmonellosis. We describe here how streptomycin-pretreated mice provide a mouse model for serovar Typhimurium colitis. Serovar Typhimurium colitis in streptomycin-pretreated mice resembles many aspects of the human infection, including epithelial ulceration, edema, induction of intercellular adhesion molecule 1, and massive infiltration of PMN/CD18(+) cells. This pathology is strongly dependent on protein translocation via the serovar Typhimurium SPI1 type III secretion system. Using a lymphotoxin beta-receptor knockout mouse strain that lacks all lymph nodes and organized gut-associated lymphatic tissues, we demonstrate that Peyer's patches and mesenteric lymph nodes are dispensable for the initiation of murine serovar Typhimurium colitis. Our results demonstrate that streptomycin-pretreated mice offer a unique infection model that allows for the first time to use mutants of both the pathogen and the host to study the molecular mechanisms of enteric salmonellosis.


Figures

FIG. 1.
FIG. 1.
Streptomycin pretreatment allows efficient colonization of the murine intestine by serovar Typhimurium. (A) Infection with an inoculum of 2 × 10³ serovar Typhimurium. Five mice (C57BL/6) were treated with 20 mg of streptomycin (•) or water (○) p.o. After 24 h, they were infected with 2 × 10³ CFU of serovar Typhimurium SL1344. (B) Infection with an inoculum of 108 CFU of serovar Typhimurium. Six mice (C57BL/6) were treated with 20 mg of streptomycin (•) or water (○) p.o. After 24 h, they were infected with 108 CFU of serovar Typhimurium SL1344. We monitored the excretion of serovar Typhimurium (CFU per fecal pellet) at days 1 and 2 p.i. (see Materials and Methods). The dashed line indicates the limit of detection; bars indicate the median; and “P” refers to the P value (Mann-Whitney U test; see Materials and Methods). Arrows indicate mice selected for histopathological analysis (see Fig. 2).
FIG. 2.
FIG. 2.
Histopathological analysis reveals colitis in streptomycin-pretreated mice infected with serovar Typhimurium. Intestines of three mice from the experiment shown in Fig. 1B were fixed, embedded in paraffin, and 5-μm thin sections were stained with H&E. (A and C) Inflammation of the cecum of the streptomycin-pretreated serovar Typhimurium-infected mouse at 2 days p.i. (marked by an open arrow in Fig. 1B). (B and D) Inflamed colon from the same mouse as in panels A and C; identical inflammatory responses were observed in the mouse marked by the black arrow in Fig. 1B (data not shown). (E) No signs of severe inflammation were observable in the cecum (and colon; data not shown) of the water-pretreated serovar Typhimurium-infected control mouse (striped arrow; see Fig. 1B). (F) Intussusception was observed in the large intestine. The tissue was from the streptomycin-pretreated serovar Typhimurium-infected mouse marked with the black arrow in Fig. 1B. L, intestinal lumen; e, edema; p, PMN; lp, lamina propria; er, erosion of the epithelial layer; c, crypt; ce, crypt elongation; g, goblet cell; sa, submucosa. Magnifications are indicated by the black bars.
FIG. 3.
FIG. 3.
Effect of the streptomycin pretreatment on the colonization of the intestine and internal organs by serovar Typhimurium. Four groups of six mice (C57BL/6) were pretreated with streptomycin (solid symbols) or sterile water (open symbols) and infected with 108 CFU of serovar Typhimurium SL1344 (circles) or mock infected with sterile PBS (triangles; see Materials and Methods). The mice were sacrificed 2 days p.i., and we analyzed the bacterial colonization. (A) Bacterial loads in the intestinal contents of the medial ileum (left panel), the terminal ileum (middle panel), and the cecum (right panel). (B) Bacterial loads in the mesenteric lymph nodes (left panel), the spleen (middle panel), and the liver (right panel; see Materials and Methods). The dashed line indicates the limit of detection; the bars indicate the median bacterial load; and “P” indicates the P value (Mann-Whitney U test; differences between the water and streptomycin-pretreated mice infected with serovar Typhimurium). NS, not statistically significant. Symbols: ▵, water-pretreated mice mock infected with PBS; ○, water-pretreated mice infected with serovar Typhimurium; ▴, streptomycin-pretreated mice mock infected with PBS; •, streptomycin-pretreated mice infected with serovar Typhimurium.
FIG. 4.
FIG. 4.
Serovar Typhimurium induces macroscopic changes in the cecum of streptomycin-pretreated mice at 2 days p.i. We removed the ceca of mice from the experiment shown in Fig. 3 for macroscopic analysis. (A) Cecum morphology. The cecum of one mouse from each group was taken for photographic documentation. The photograph is representative of all six animals from each group. The centimeter scale indicates the magnification. (B) Total weight of the cecum. We determined the weight of the ceca of the remaining five mice from each group. P, P value (Mann-Whitney U test; differences between animals which were infected with serovar Typhimurium or mock infected with sterile PBS); NS, not statistically significant. “S. Tm + or −” and “sm + or −” indicate whether the mice were pretreated with streptomycin (sm) or water and whether the animals were infected with serovar Typhimurium (S. Tm). Bars indicate the median weight of the cecum. Symbols: ▵, water-pretreated mice mock infected with PBS; ○, water-pretreated mice infected with serovar Typhimurium; ▴, streptomycin-pretreated mice mock infected with PBS; •, streptomycin-pretreated mice infected with serovar Typhimurium.
FIG. 5.
FIG. 5.
Cecal inflammation at 2 days p.i. The ceca of five of the six animals from each group of the experiment shown in Fig. 3 were cryoembedded, and 5-μm thin sections were stained with H&E for histopathological analysis. (A and E) Cecum of a water-pretreated mouse mock infected with PBS; (B and F) cecum of a water-pretreated mouse infected with serovar Typhimurium; (C and G) cecum of a streptomycin-pretreated mouse mock infected with PBS; (D and H) streptomycin-pretreated mouse infected with serovar Typhimurium. The images are representative for all animals from each group. Boxes in panels A, B, C, and D indicate the area shown at the higher magnification. L, intestinal lumen; e, edema; p, PMN; er, erosion of the epithelial layer; g, goblet cell; sa, submucosa. Magnifications are indicated by the black bars.
FIG. 6.
FIG. 6.
Scoring of inflammatory changes at 2 days p.i. In order to quantify pathological changes, we scored H&E-stained sections of the ceca from five of the six mice from each group of the experiment shown in Fig. 3 as described in Materials and Methods. Edema in the submucosa (black), PMN infiltration (medium gray), reduction of the number of goblet cells (dark gray), and erosion or ulceration of the epithelial layer (light gray) were scored separately and plotted as stacked vertical bars. The combined score equals the sum of the separate scores. “S. Tm + or −” and “sm + or −” indicate whether the mice were pretreated with streptomycin (sm) or water and whether the animals were infected with serovar Typhimurium (S. Tm). Statistical analyses are shown for the separate scores and for the combined score. P, P value (Mann-Whitney U test; see Materials and Methods; difference between mice infected with serovar Typhimurium and mice mock infected with sterile PBS); NS, not statistically significant.
FIG. 7.
FIG. 7.
Infection of streptomycin-pretreated mice with Lactobacillus spp. does not lead to colitis. Groups of three streptomycin-pretreated mice (C57BL/6) were infected with 108 CFU of Lactobacillus spp. or 108 CFU of serovar Typhimurium. At 48 h p.i. the animals were sacrificed and 5-μm cryosections of the cecum were stained with H&E. (A and C) Cecum of streptomycin-pretreated mouse infected with Lactobacillus spp.; (B and D) cecum of streptomycin-pretreated mouse infected with serovar Typhimurium. The images are representative for all three animals from each group. The boxes in panels A and B indicate the areas shown at the higher magnification in panels C and D. L, intestinal lumen; e, edema; p, PMN; er, erosion of the epithelial layer; g, goblet cell; sa, submucosa. Magnifications are indicated by black bars. (E) Scoring of inflammatory changes as described in Materials and Methods. Edema in the submucosa (black), PMN infiltration (medium gray), reduction of the number of goblet cells (dark gray), and erosion or ulceration of the epithelial layer (light gray) were scored separately and are plotted as stacked vertical bars. The combined score equals the sum of the separate scores. S. Tm, mice infected with serovar Typhimurium; sm, mice were pretreated with streptomycin.
FIG. 8.
FIG. 8.
Time course of serovar Typhimurium colitis in streptomycin-pretreated mice. Groups of five streptomycin-pretreated mice were infected for 2, 8, 20, or 48 h with 108 CFU of serovar Typhimurium SL1344 p.o. We determined bacterial colonization and pathological changes as described in Materials and Methods. (A) Bacterial loads in different regions of the intestine at 2 h p.i. (left panel) and 8 h p.i. (right panel). (B) Time course of the bacterial loads in the cecum content. (C) Time course of bacterial loads in the mesenteric lymph nodes. (D) Time course of bacterial loads in the liver. (E) Time course of the total weight of the cecum (determined before the removal of samples for bacteriological or histopathologic analysis). (F) Time course of the histopathologic changes. Samples of the cecal tissue were cryoembedded and 5-μm thin sections were stained with H&E. Edema in the submucosa (black), PMN infiltration (medium gray), reduction of the number of goblet cells (dark gray), and erosion or ulceration of the epithelial layer (light gray) were scored separately (see Materials and Methods) and are plotted as stacked vertical bars. The combined score equals the sum of the separate scores. For the statistical analysis, see Table 1. S. Tm, serovar Typhimurium; dashed line, limit of detection; bars, median bacterial load; gray arrows, values determined for the two mice without cecal inflammation at 8 h p.i. The black arrows indicate the pathological scores of the tissue sections shown in Fig. 9.
FIG. 9.
FIG. 9.
Analysis of the time course of murine serovar Typhimurium colitis by histology and immunofluorescence microscopy. Cecal tissues of the mice from the experiment described in Fig. 8 (sacrificed at 2, 8, 20, or 48 h p.i.) were cryoembedded, sectioned, and stained as described in Materials and Methods. (A to H) Histopathology of thin sections (5 μm) of the cecum of mice infected for 2 h (A and E), 8 h (B and F), 20 h (C and G), or 48 h (D and H; marked by black arrows in Fig. 8F). (I to L) Localization of the bacteria. Thin sections (30 μm) of the cecum at 2 h (I), 8 h (J), 20 h (K), or 48 h (L) p.i. (marked by black arrows in Fig. 8F) were stained with DAPI, TRITC (tetramethyl rhodamine isothiocyanate)-phalloidin, a rabbit α-Salmonella LPS antiserum, and a secondary α-rabbit-FITC conjugate (DNA = blue; actin = red; serovar Typhimurium = green fluorescence). (M to P) Expression of ICAM-1 and infiltration of CD18+ cells. Thin sections (5 μm) of the cecum at 2 h (M), 8 h (N), 20 h (O), or 48 h (P) p.i. (marked by black arrows in Fig. 8F) were stained with DAPI, rat α-mouse CD18, hamster α-mouse ICAM-1, and polyclonal preadsorbed α-rat IgG-FITC and α-hamster IgG-Cy3 antibodies (DNA = blue; ICAM-1 = red, CD18 = green fluorescence; see Materials and Methods). The boxes in panels A, B, C, and D indicate areas shown at a higher magnification in panels E, F, G, and H. The inset in panel K is a higher magnification of the area marked by the white box in the upper right corner of the panel. L, intestinal lumen; e, edema; p, PMN; er, erosion of the epithelial layer; g, goblet cell; sa, submucosa; c, crypt. Magnifications are indicated by bars.
FIG. 10.
FIG. 10.
Role of the SPI1 type III secretion system in serovar Typhimurium colitis. Eight streptomycin-pretreated C57BL/6 mice were infected p.o. with 108 CFU of wild-type serovar Typhimurium SL1344 (black circles in panels A, B, and C; left side of panel D) or with SB161 (SL1344, ΔinvG; open circles in panels A, B, and C; right side of panel D) and analyzed at 2 days p.i. (A) Loads of serovar Typhimurium present in the cecum content. (B) Colonization of mesenteric lymph nodes (left panel), spleen (middle panel), and liver (right panel). (C) Total weight of the cecum, including the cecal contents (determined before the removal of samples for bacteriological or histopathologic analysis). (D) Histopathological analysis. Samples of the cecal tissue were cryoembedded, and 5-μm thin sections were stained with H&E. Edema in the submucosa (black), PMN infiltration (medium gray), reduction of the number of goblet cells (dark gray), and erosion or ulceration of the epithelial layer (light gray) were scored separately (see Materials and Methods) and plotted as stacked vertical bars. The combined score equals the sum of the separate scores. Black and white arrows indicate the pathological scores of the tissue sections from the wild-type- and SB161-infected mice, respectively, shown in Fig. 11. For the statistical analysis, see Table 2. P, P value (Mann-Whitney U test; see Materials and Methods). NS, not statistically significant; S. Tm, serovar Typhimurium; dashed line, limit of detection; bars, median bacterial load or weight.
FIG. 11.
FIG. 11.
Role of the SPI1 type III secretion system in cecal inflammation. (A to F) The ceca of all 16 mice from the experiment shown in Fig. 10 were cryoembedded and sectioned for histopathological evaluation and analysis by immunofluorescence microscopy. (A to D) SB161 causes a less-pronounced cecal inflammation. Thin sections (5 μm) were stained with H&E. (A and C) Representative image of mice infected for 2 days with wild-type serovar Typhimurium SL1344 (marked by white arrow in Fig. 10D); (B and D) representative image of mice infected for 2 days with the SPI1 mutant SB161 (marked by black arrow in Fig. 10D); (E and F) induction of ICAM-1 and infiltration of CD18+ cells. Thin sections (5 μm) of the ceca of mice infected for 48 h with wild-type serovar Typhimurium SL1344 (E) or SB161 (F) were stained with DAPI, rat α-mouse CD18, hamster α-mouse ICAM-1, and polyclonal preadsorbed α-rat IgG-FITC and α-hamster IgG-TRITC antibodies (DNA = blue; ICAM-1 = red, CD18 = green fluorescence; see Materials and Methods). (G and H) Early interaction of wild-type serovar Typhimurium and SB161 with the intestinal epithelium. Groups of two streptomycin-pretreated mice were infected with 108 CFU of wild-type serovar Typhimurium (G) or SB161 (H) and sacrificed at 8 h p.i. Macroscopic inspection and histopathologic scoring confirmed that the ceca of all mice were not inflamed (data not shown). Thin sections (30 μm) of the ceca were stained with DAPI, TRITC-phalloidin, a rabbit α-Salmonella LPS antiserum, and a secondary α-rabbit-FITC conjugate (DNA = blue, actin = red; serovar Typhimurium = green fluorescence). Insets show higher-magnification views of the areas marked by the white arrows. L, intestinal lumen; e, edema; p, PMN; er, erosion or ulceration of the epithelial layer; g, goblet cell; sa, submucosa; c, crypt; f, autofluorescence of food particles. Magnifications are indicated by bars.
FIG. 12.
FIG. 12.
Effect of different mutations compromising effector protein translocation on murine serovar Typhimurium colitis. Groups of five streptomycin-pretreated C57BL/6 mice were infected p.o. with 108 CFU of wild-type serovar Typhimurium SL1344 (black circles), SB161 (SL1344, ΔinvG; white circles), SB302 (SL1344, invJ::aphT; gray circles), or SB241 (SL1344, sipD::aphT; striped circles), sacrificed 48 h p.i. and analyzed as described in Materials and Methods. (A) Bacterial load in the cecal content; (B) bacterial load in the mesenteric lymph nodes (mLN); (C) bacterial load in the liver; (D) total weight of the cecum, including the cecal contents (determined before the removal of samples for bacteriological or histopathologic analysis); (E) histopathological analysis. Samples of the cecal tissue were cryoembedded, and 5-μm thin sections were stained with H&E. Edema in the submucosa (black), PMN infiltration (medium gray), reduction of the number of goblet cells (dark gray), and erosion or ulceration of the epithelial layer (light gray) were scored separately (see Materials and Methods) and plotted as stacked vertical bars. The combined score equals the sum of the separate scores. S. Tm, serovar Typhimurium. For the statistical analysis, see Table 3. Dashed line, limit of detection; bars, median bacterial load.
FIG. 13.
FIG. 13.
Serovar Typhimurium colitis in streptomycin-pretreated LTβR−/− mice. (A to D) On the left side of each panel, eight wild-type C57BL/6 and eight LTβR−/− mice (genetic C57BL/6 background) were pretreated with streptomycin and infected with 108 CFU of serovar Typhimurium SL1344 p.o. (black circles and black triangles). In the middle of each panel, seven C57BL/6 and seven LTβR−/− mice were pretreated with water and infected with 108 CFU of serovar Typhimurium SL1344 p.o. (open circles and open triangles). On the right side of each panel, two C57BL/6 and two LTβR−/− mice were pretreated with streptomycin and mock infected with sterile PBS (gray circles and gray triangles). The mice were sacrificed 48 h p.i. and then analyzed as described in Materials and Methods. (A) Bacterial loads in the feces; (B) bacterial loads in the spleens; (C) bacterial loads in the livers; (D) total weight of the cecum (determined before the removal of samples for bacteriological or histopathologic analysis); (E) histopathological analysis. Samples of the cecal tissue were cryoembedded, and 5-μm thin sections were stained with H&E. Edema in the submucosa (black), PMN infiltration (medium gray), reduction of the number of goblet cells (dark gray), and erosion or ulceration of the epithelial layer (light gray) were scored separately (see Materials and Methods) and plotted as stacked vertical bars. The combined score equals the sum of the separate scores. For the statistical analysis, see Table 4. NS, not statistically significant; dashed line, limit of detection; bars, median bacterial loads.
FIG. 14.
FIG. 14.
Cecal inflammation in serovar Typhimurium-infected LTβR−/− and wild-type C57BL/6 mice. Representative images of the ceca of the LTβR−/− and wild-type C57BL/6 mice from the experiment in Fig. 13 are shown. Each cecum was cryoembedded, and 5-μm thin sections were stained with H&E (A to D) or processed for immunofluorescence microscopy (E to P). (A, E, I, and M) Streptomycin-pretreated LTβR−/− mice infected with serovar Typhimurium; (B, F, J, and N) streptomycin-pretreated LTβR−/− mice mock infected with PBS; (C, G, K, and O) streptomycin-pretreated wild-type C57BL/6 mice infected with serovar Typhimurium; (D, H, L, and P) streptomycin-pretreated wild-type C57BL/6 mice mock infected with sterile PBS. In panels A to D, the cecum sections of LTβR−/− and wild-type C57BL/6 mice were stained with H&E. In panels E to H, infiltration and transmigration of CD18+ cells is shown. Cecum sections were stained with DAPI, rat α-mouse CD18, and α-rat IgG-FITC antibodies (DNA = blue; CD18 = green). In panels I to L, induction of ICAM-1 expression is shown. Cecum sections were stained with DAPI, hamster α-mouse ICAM-1, and α-hamster IgG-TRITC antibodies (DNA = blue, ICAM-1 = red). In panels M to P, the distribution of B220high B cells is shown. Cecum sections were stained with DAPI, rat α-mouseB220, and α-rat IgG-TRITC antibodies (DNA = blue, B220 = red). L, intestinal lumen; e, edema; p, PMN; er, erosion or ulceration of the epithelial layer; g, goblet cell; sa, submucosa; lp, lamina propria; c, crypt. Magnifications are indicated by bars. “S. Tm + or −” indicates whether the mice were infected with serovar Typhimurium SL1344 or mock infected with sterile PBS; “Sm + or −” indicates whether the mice were pretreated with streptomycin or with water.

References

    1. Baumler, A. J., R. M. Tsolis, and F. Heffron. 1996. The lpf fimbrial operon mediates adhesion of Salmonella typhimurium to murine Peyer's patches. Proc. Natl. Acad. Sci. USA 93:279-283. - PMC - PubMed
    1. Bohnhoff, M., B. L. Drake, and C. P. Miller. 1954. Effect of streptomycin on susceptibility of intestinal tract to experimental Salmonella infection. Proc. Soc. Exp. Biol. 86:132-137. - PubMed
    1. Bohnhoff, M., and C. P. Miller. 1962. Enhanced susceptibility to Salmonella infection in streptomycin-treated mice. J. Infect. Dis. 111:117-127. - PubMed
    1. Bohnhoff, M., C. P. Miller, and W. R. Martin. 1964. Resistance of the mouse intestinal tract to experimental Salmonella infection. (I) Factors which interfere with the initiation of infection by oral inoculation. J. Exp. Med. 120:805-816. - PMC - PubMed
    1. Bohnhoff, M., C. P. Miller, and W. R. Martin. 1964. Resistance of the mouse intestinal tract to experimental Salmonella infection. II. Factors responsible for its loss following streptomycin treatment. J. Exp. Med. 120:817-828. - PMC - PubMed

Publication types

MeSH terms

LinkOut - more resources