

Neuropathologies in transgenic mice expressing human immunodeficiency virus type 1 Tat protein under the regulation of the astrocyte-specific glial fibrillary acidic protein promoter and doxycycline
- PMID: 12707054
- PMCID: PMC1851199
- DOI: 10.1016/S0002-9440(10)64304-0
Neuropathologies in transgenic mice expressing human immunodeficiency virus type 1 Tat protein under the regulation of the astrocyte-specific glial fibrillary acidic protein promoter and doxycycline
Abstract
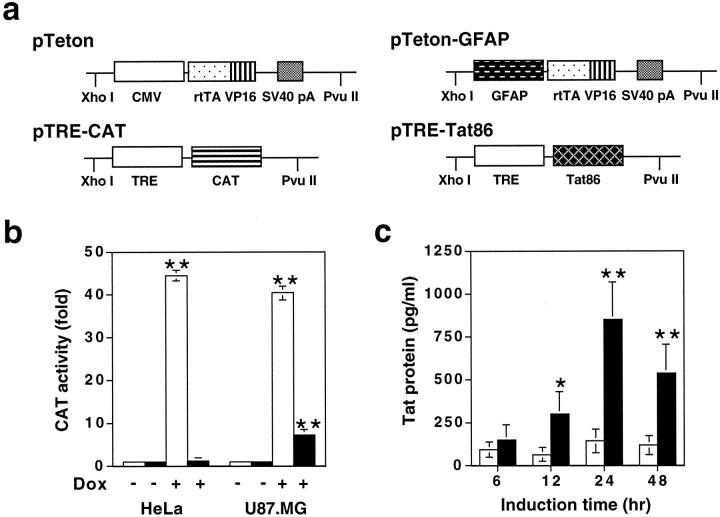
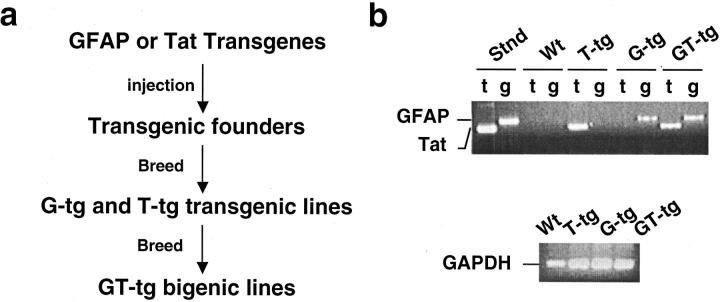
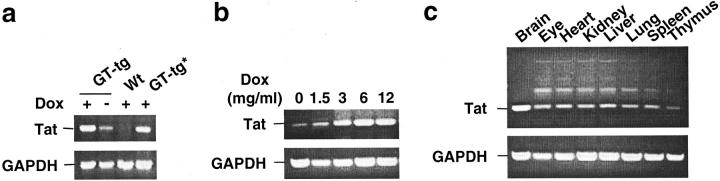
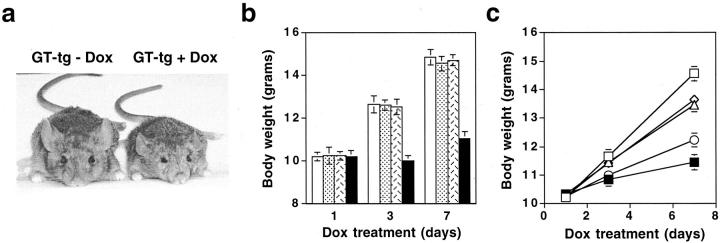
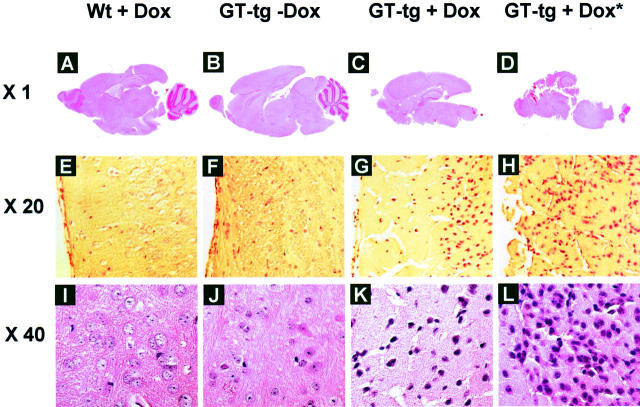
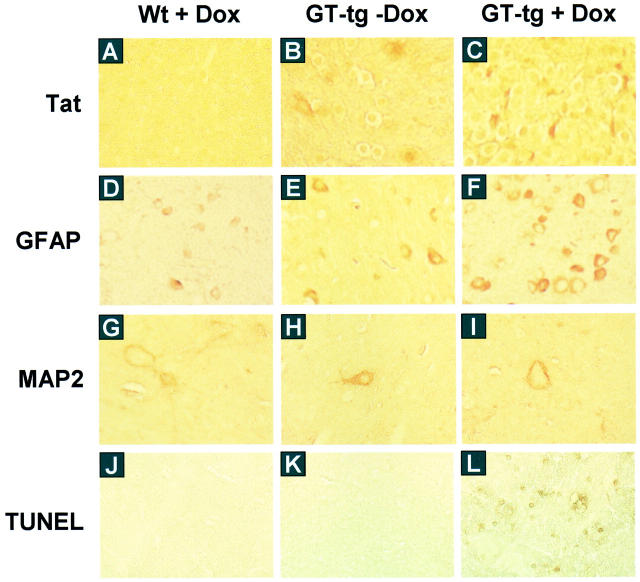
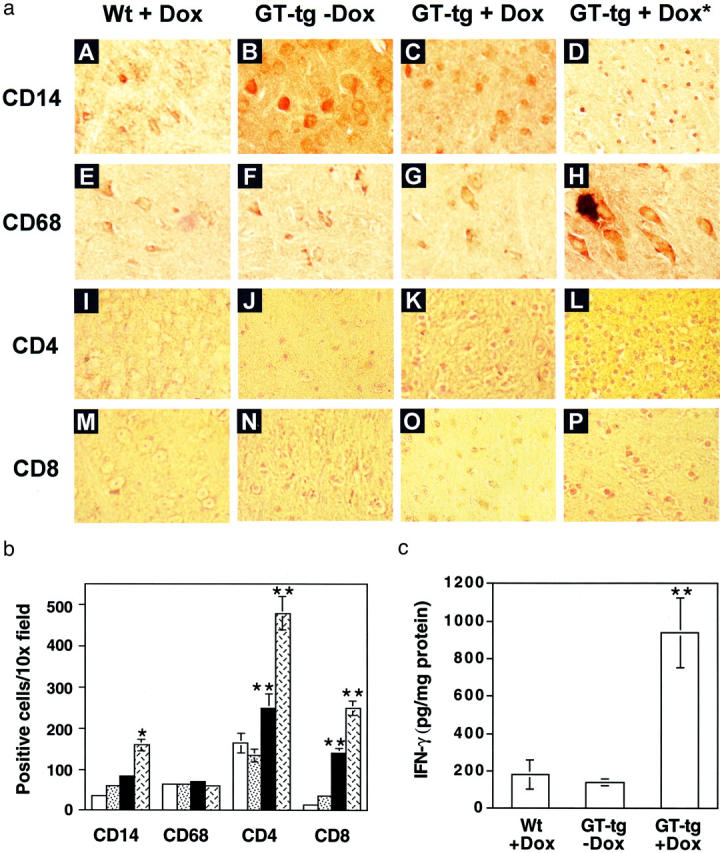
The human immunodeficiency virus type 1 (HIV-1) Tat protein is a key pathogenic factor in a variety of acquired immune deficiency syndrome (AIDS)-associated disorders. A number of studies have documented the neurotoxic property of Tat protein, and Tat has therefore been proposed to contribute to AIDS-associated neurological diseases. Nevertheless, the bulk of these studies are performed in in vitro neuronal cultures without taking into account the intricate cell-cell interaction in the brain, or by injection of recombinant Tat protein into the brain, which may cause secondary stress or damage to the brain. To gain a better understanding of the roles of Tat protein in HIV-1 neuropathogenesis, we attempted to establish a transgenic mouse model in which Tat expression was regulated by both the astrocyte-specific glial fibrillary acidic protein promoter and a doxycycline (Dox)-inducible promoter. In the present study, we characterized the phenotypic and neuropathogenic features of these mice. Both in vitro and in vivo assays confirmed that Tat expression occurred exclusively in astrocytes and was Dox-dependent. Tat expression in the brain caused failure to thrive, hunched gesture, tremor, ataxia, and slow cognitive and motor movement, seizures, and premature death. Neuropathologies of these mice were characterized by breakdown of cerebellum and cortex, brain edema, astrocytosis, degeneration of neuronal dendrites, neuronal apoptosis, and increased infiltration of activated monocytes and T lymphocytes. These results together demonstrate that Tat expression in the absence of HIV-1 infection is sufficient to cause neuropathologies similar to most of those noted in the brain of AIDS patients, and provide the first evidence in the context of a whole organism to support a critical role of Tat protein in HIV-1 neuropathogenesis. More importantly, our data suggest that the Dox inducible, brain-targeted Tat transgenic mice offer an in vivo model for delineating the molecular mechanisms of Tat neurotoxicity and for developing therapeutic strategies for treating HIV-associated neurological disorders.
Figures
Similar articles
-
Doxycycline-inducible and astrocyte-specific HIV-1 Tat transgenic mice (iTat) as an HIV/neuroAIDS model.J Neurovirol. 2018 Apr;24(2):168-179. doi: 10.1007/s13365-017-0598-9. Epub 2017 Nov 15. J Neurovirol. 2018. PMID: 29143286 Free PMC article. Review.
-
Protection against human immunodeficiency virus type 1 Tat neurotoxicity by Ginkgo biloba extract EGb 761 involving glial fibrillary acidic protein.Am J Pathol. 2007 Dec;171(6):1923-35. doi: 10.2353/ajpath.2007.070333. Epub 2007 Nov 30. Am J Pathol. 2007. PMID: 18055541 Free PMC article.
-
Astrocyte activation and dysfunction and neuron death by HIV-1 Tat expression in astrocytes.Mol Cell Neurosci. 2004 Nov;27(3):296-305. doi: 10.1016/j.mcn.2004.07.003. Mol Cell Neurosci. 2004. PMID: 15519244
-
HIV-1 Tat Induces Unfolded Protein Response and Endoplasmic Reticulum Stress in Astrocytes and Causes Neurotoxicity through Glial Fibrillary Acidic Protein (GFAP) Activation and Aggregation.J Biol Chem. 2016 Oct 21;291(43):22819-22829. doi: 10.1074/jbc.M116.731828. Epub 2016 Sep 8. J Biol Chem. 2016. PMID: 27609520 Free PMC article.
-
Transgenic mice expressing HIV-1 envelope protein gp120 in the brain as an animal model in neuroAIDS research.J Neurovirol. 2018 Apr;24(2):156-167. doi: 10.1007/s13365-017-0584-2. Epub 2017 Oct 26. J Neurovirol. 2018. PMID: 29075998 Free PMC article. Review.
Cited by
-
Conditional Tat protein expression in the GT-tg bigenic mouse brain induces gray matter density reductions.Prog Neuropsychopharmacol Biol Psychiatry. 2013 Jun 3;43:49-54. doi: 10.1016/j.pnpbp.2012.12.018. Epub 2012 Dec 23. Prog Neuropsychopharmacol Biol Psychiatry. 2013. PMID: 23269344 Free PMC article.
-
Brain Reward Function after Chronic and Binge Methamphetamine Regimens in Mice Expressing the HIV-1 TAT Protein.Curr HIV Res. 2019;17(2):126-133. doi: 10.2174/1570162X17666190703165408. Curr HIV Res. 2019. PMID: 31269883 Free PMC article.
-
HIV-1 Tat and cocaine impact astrocytic energy reservoirs and epigenetic regulation by influencing the LINC01133-hsa-miR-4726-5p-NDUFA9 axis.Mol Ther Nucleic Acids. 2022 Jul 6;29:243-258. doi: 10.1016/j.omtn.2022.07.001. eCollection 2022 Sep 13. Mol Ther Nucleic Acids. 2022. PMID: 35892093 Free PMC article.
-
Human immunodeficiency virus Tat impairs mitochondrial fission in neurons.Cell Death Discov. 2018 Feb 2;4:8. doi: 10.1038/s41420-017-0013-6. eCollection 2018 Dec. Cell Death Discov. 2018. PMID: 29531805 Free PMC article.
-
5α-reduced progestogens ameliorate mood-related behavioral pathology, neurotoxicity, and microgliosis associated with exposure to HIV-1 Tat.Brain Behav Immun. 2016 Jul;55:202-214. doi: 10.1016/j.bbi.2016.01.007. Epub 2016 Jan 13. Brain Behav Immun. 2016. PMID: 26774528 Free PMC article.
References
-
- Rappaport J, Joseph J, Croul S, Alexander G, Del Valle L, Amini S, Khalili K: Molecular pathway involved in HIV-1-induced CNS pathology: role of viral regulatory protein, Tat. J Leukoc Biol 1999, 65:458-465 - PubMed
-
- Nath A, Mattson MP, Magnuson DSK, Jones M, Berger JR: Role of viral proteins in HIV-1 neuropathogenesis with emphasis on Tat. NeuroAIDS 1998, :1
-
- Sodroski J, Patarca R, Rosen C, Wong-Staal F, Haseltine W: Location of the trans-activating region on the genome of human T-cell lymphotropic virus type III. Science 1985, 229:74-77 - PubMed
-
- Wei P, Garber ME, Fang SM, Fischer WH, Jones KA: A novel CDK9-associated C-type cyclin interacts directly with HIV-1 Tat and mediates its high-affinity, loop-specific binding to TAR RNA. Cell 1998, 92:451-462 - PubMed
-
- Cupp C, Taylor JP, Khalili K, Amini S: Evidence for stimulation of the transforming growth factor beta 1 promoter by HIV-1 Tat in cells derived from CNS. Oncogene 1993, 8:2231. - PubMed
Publication types
MeSH terms
Substances
Grants and funding
LinkOut - more resources
Full Text Sources
Other Literature Sources
Medical
Molecular Biology Databases
