. 2003 May;5(2):96-102.
doi: 10.1016/S1525-1578(10)60458-8.

Detection of FLT3 internal tandem duplication and D835 mutations by a multiplex polymerase chain reaction and capillary electrophoresis assay

Affiliations

Detection of FLT3 internal tandem duplication and D835 mutations by a multiplex polymerase chain reaction and capillary electrophoresis assay

Kathleen M Murphy et al. J Mol Diagn. 2003 May.

Abstract

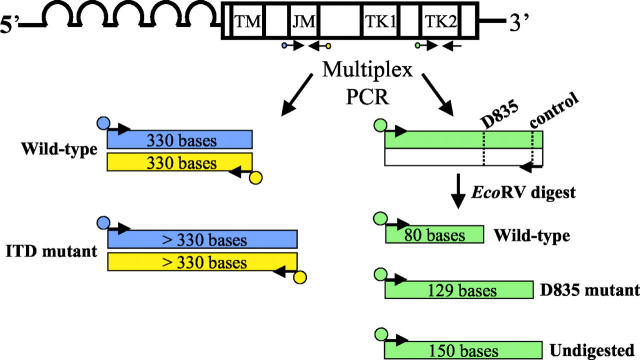
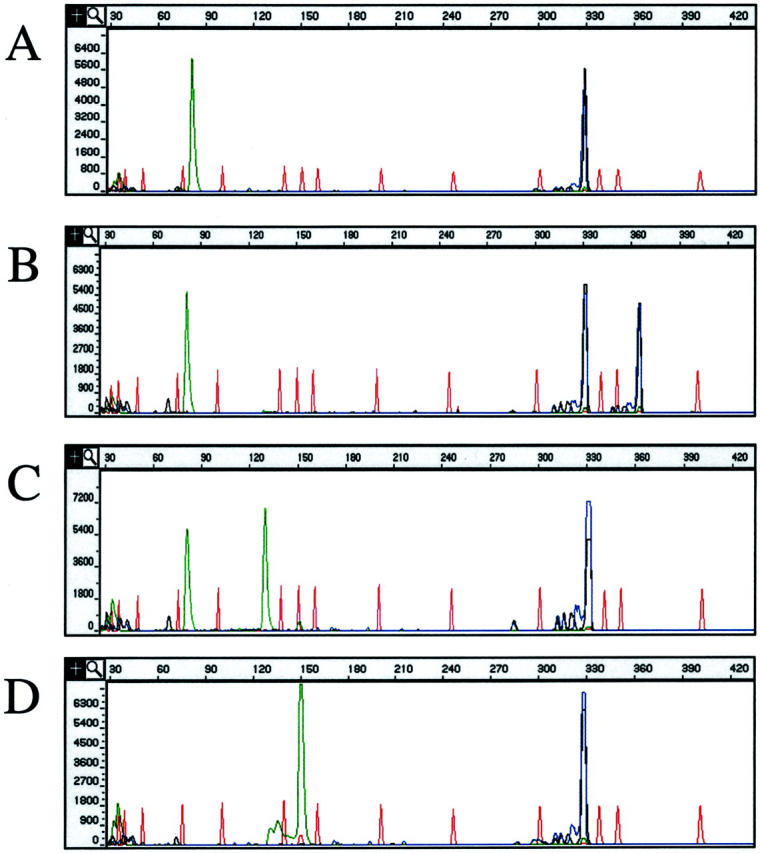
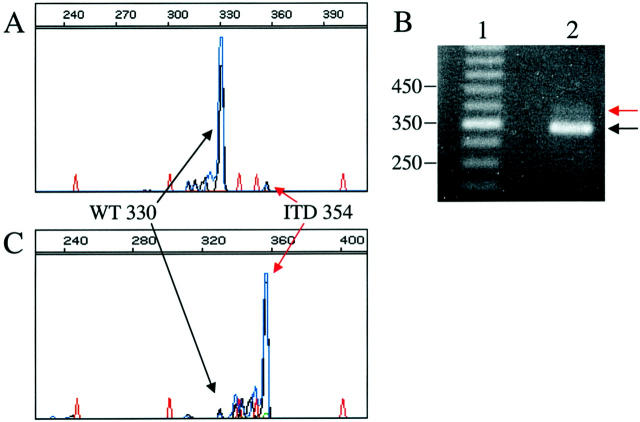
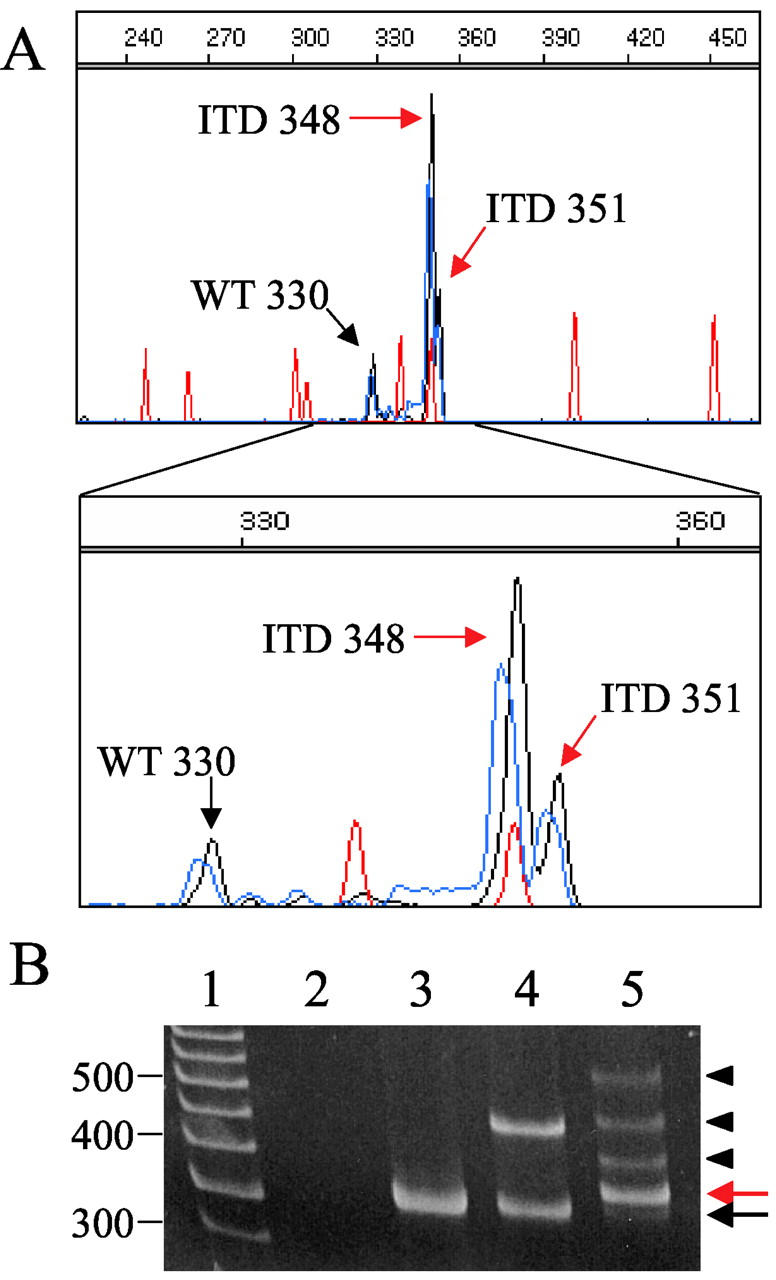
FLT3 is a receptor tyrosine kinase that is expressed on early hematopoietic progenitor cells and plays an important role in stem cell survival and differentiation. Two different types of functionally important FLT3 mutations have been identified. Internal tandem duplication mutations arise from duplications of the juxtamembrane portion of the gene and result in constitutive activation of the FLT3 protein. This alteration has been identified in approximately 20% to 30% of patients with acute myelogenous leukemia and appears to be associated with a worse prognosis. The second type of FLT3 mutation, missense mutations at aspartic acid residue 835, occurs in approximately 7.0% of acute myelogenous leukemia cases. These mutations also appear to be activating and to portend a worse prognosis. Identification of FLT3 mutations is important because it provides prognostic information and may play a pivotal role in determining appropriate treatment options. We have developed an assay to identify both internal tandem duplication and D835 FLT3 mutations in a single multiplex polymerase chain reaction. After amplification, the polymerase chain reaction products are analyzed by capillary electrophoresis for length mutations and resistance to EcoRV digestion. Here we describe the performance characteristics of the assay, assay validation, and our clinical experience using this assay to analyze 147 clinical specimens.


Figures

Figure 1.
Figure 1.
Diagram of the assay design. The FLT3 gene consists of five extracellular immunoglobulin-like domains, a transmembrane domain (TM), a JM domain, and an interrupted kinase domain (TK1 and TK2). PCR primers flanking the JM domain [forward primer labeled with FAM (blue), reverse primer labeled with NED (yellow)] and primers specific for the TK2 domain [forward labeled with TET (green), reverse unlabeled] are multiplexed into a single PCR reaction. After amplification, the PCR products are digested with EcoRV. The dotted lines in the TK2 PCR product represent the EcoRV cut sites, with the recognition sequence (GATATC). The JM portion of the PCR yields a wild-type PCR product of 330 bases labeled with both FAM and NED. FLT3 ITD mutations result in PCR products that are longer than wild type (>330 bp), also labeled with both FAM and NED. After digestion, the D835 portion of the assay yields wild-type products sizing at 80 bases that are TET labeled. D835 mutant TET-labeled products size at 129 bases, and undigested TET-labeled products size at 150 bases.
Figure 2.
Figure 2.
Examples of results of the FLT3 assay. A–D: CE pherograms; x axis represents size of the PCR products in bases, y axis represents relative fluorescence intensity. Red peaks represent internal size standard. Green (TET) PCR product peaks result from the D835 portion of the assay. Blue (FAM) and black (NED) peaks result form the ITD portion of the assay. A: Example of a FLT3 D835 wild-type/ITD wild-type result. B: Example of a FLT3 D835 wild-type/ITD mutant result. C: Example of a D835 mutant/ITD wild-type result. D: Example of an incomplete digest for the D835 assay and a wild-type ITD.
Figure 3.
Figure 3.
Example of enrichment of a sample containing a small number of FLT3 ITD mutant allele PCR products because of a low blast count in the sample tested. A: CE pherogram; x axis represents size of the PCR product in bases, y axis represents relative fluorescence intensity. Red peaks represent internal size standard. Blue/black peaks are the FAM/NED-labeled products of the ITD portion of the multiplexed assay. The large wild-type peak at 330 bases and small ITD mutant peak at 354 bases are indicated by black and red arrows, respectively. B: PAGE of the same PCR product as in A. Lane 1 is a 50-bp marker. Lane 2 is the same sample analyzed by CE in A. The black arrow indicates the 330-bp wild-type product, and the red arrow indicates the 354-bp ITD mutant PCR product. C: CE electropherogram after band-stab of the ITD mutant band and reamplification. Note that after band-stab and reamplification, the FLT3 ITD mutant PCR products are dominant compared to wild type.
Figure 4.
Figure 4.
Example of improved resolution of CE compared to PAGE. A: CE pherogram of a sample positive for two different ITD mutations; x axis represents size of the PCR product in bases, y axis represents relative fluorescence intensity. Red peaks represent the internal size standard. The wild-type peak at 330 bases (black arrow) and two ITD mutant peaks at 348 and 351 bases (red arrows) are indicated. Below, the electropherogram is magnified to highlight the two different ITD mutations. B: PAGE of the same PCR product as in A. Lane 1 is a 50-bp marker, lane 2 is a no template control, lane 3 is a FLT3 wild-type control, lane 4 is a FLT3 ITD control, and lane 5 is the same sample as run by CE in A. The black arrow indicates the small amount of wild-type PCR product. The red arrow indicates the two ITD bands at 348 and 351 identified by CE. The arrowheads identify bands that are not detected by CE. These bands appear to be the result of heteroduplex formation between the two ITD products and between wild-type and ITD PCR products (see text).

References

    1. Blume-Jensen P, Hunter T: Oncogenic kinase signalling. Nature 2001, 411:355-365 - PubMed
    1. Turner AM, Lin NL, Issarachai S, Lyman SD, Broudy VC: FLT3 receptor expression on the surface of normal and malignant human hematopoietic cells. Blood 1996, 88:3383-3390 - PubMed
    1. McKenna HJ, Stocking KL, Miller RE, Brasel K, De Smedt T, Maraskovsky E, Maliszewski CR, Lynch DH, Smith J, Pulendran B, Roux ER, Teepe M, Lyman SD, Peschon JJ: Mice lacking flt3 ligand have deficient hematopoiesis affecting hematopoietic progenitor cells, dendritic cells, and natural killer cells. Blood 2000, 95:3489-3497 - PubMed
    1. Birg F, Courcoul M, Rosnet O, Bardin F, Pebusque MJ, Marchetto S, Tabilio A, Mannoni P, Birnbaum D: Expression of the FMS/KIT-like gene FLT3 in human acute leukemias of the myeloid and lymphoid lineages. Blood 1992, 80:2584-2593 - PubMed
    1. Carow CE, Levenstein M, Kaufmann SH, Chen J, Amin S, Rockwell P, Witte L, Borowitz MJ, Civin CI, Small D: Expression of the hematopoietic growth factor receptor FLT3 (STK-1/Flk2) in human leukemias. Blood 1996, 87:1089-1096 - PubMed