

Colour analysis of skin lesion regions for melanoma discrimination in clinical images
- PMID: 12709126
- PMCID: PMC3196565
- DOI: 10.1034/j.1600-0846.2003.00024.x
Colour analysis of skin lesion regions for melanoma discrimination in clinical images
Abstract
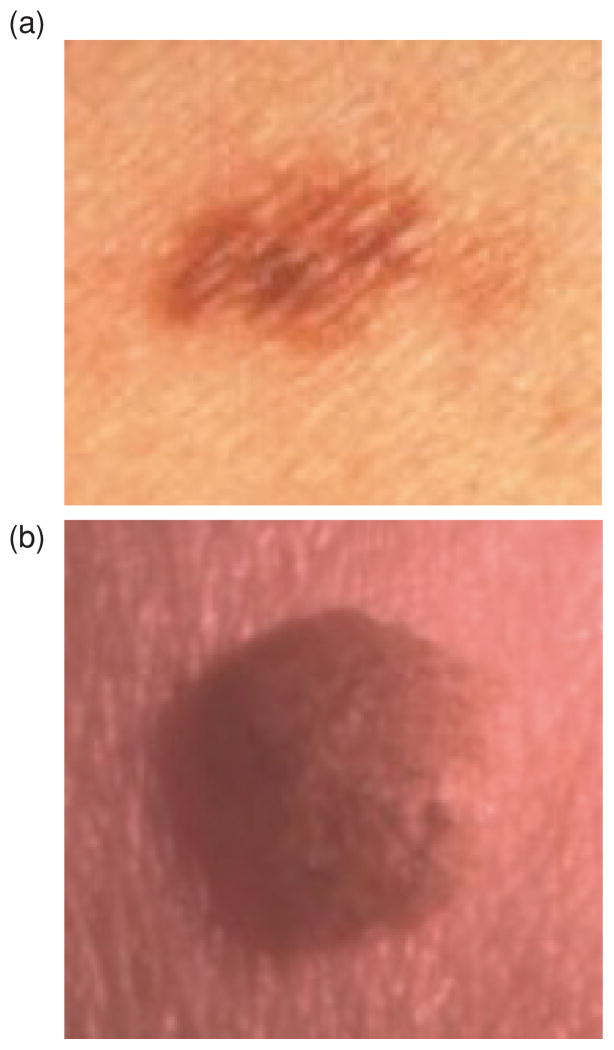
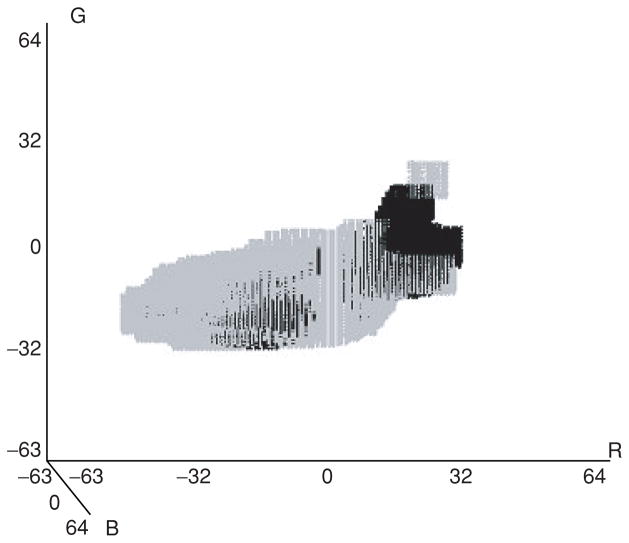
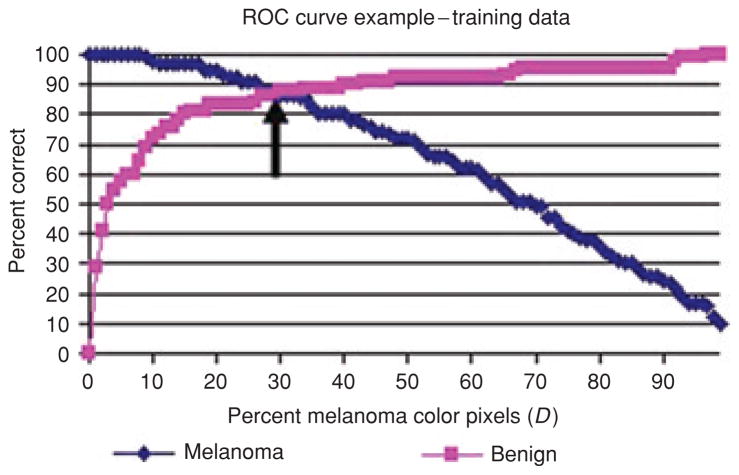
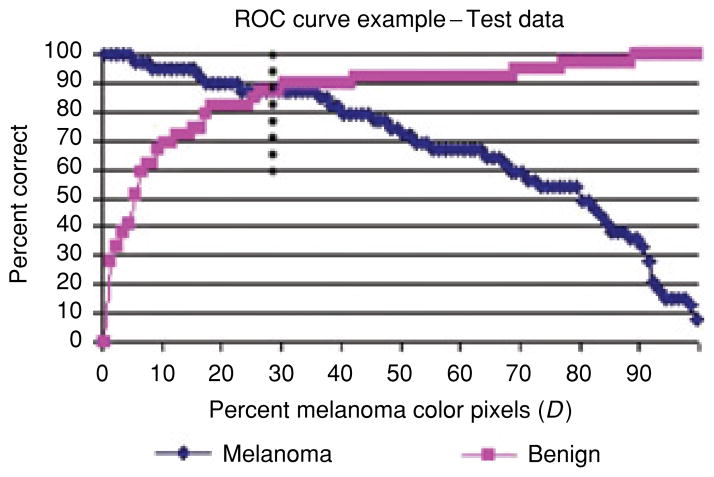
Background: Skin lesion colour is an important feature for diagnosing malignant melanoma. Colour histogram analysis over a training set of images has been used to identify colours characteristic of melanoma, i.e., melanoma colours. A percent melanoma colour feature defined as the percentage of the lesion pixels that are melanoma colours has been used as a feature to discriminate melanomas from benign lesions.
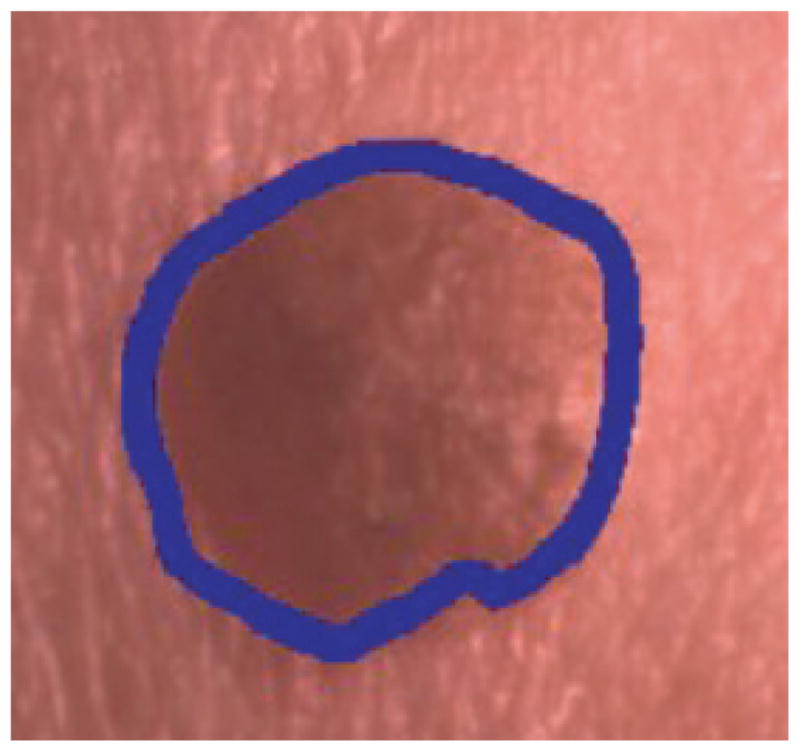
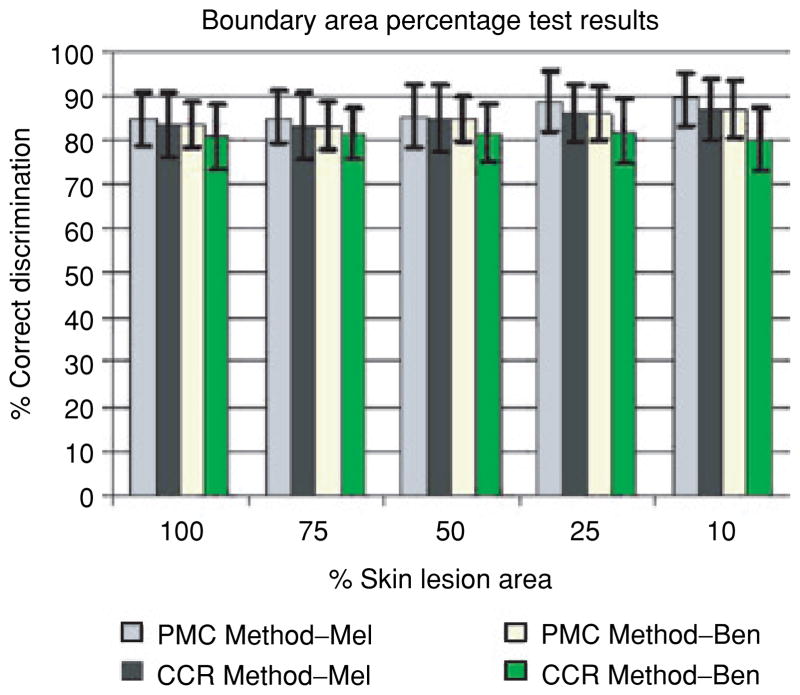
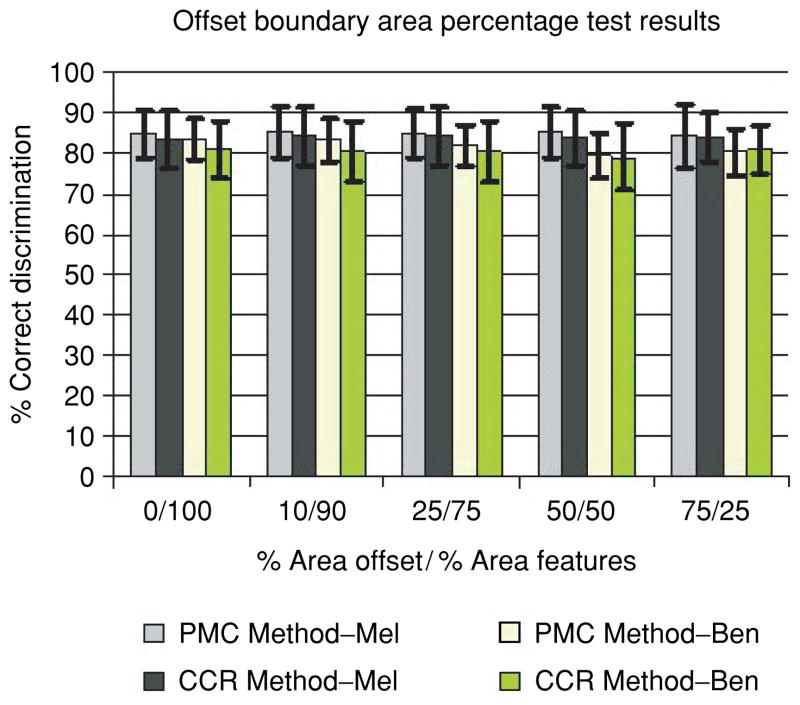
Methods: In this research, the colour histogram analysis technique is extended to evaluate skin lesion discrimination based on colour feature calculations in different regions of the skin lesion. The colour features examined include percent melanoma colour and a novel colour clustering ratio. Experiments are performed using clinical images of 129 malignant melanomas and 129 benign lesions consisting of 40 seborrheic keratoses and 89 nevocellular nevi.
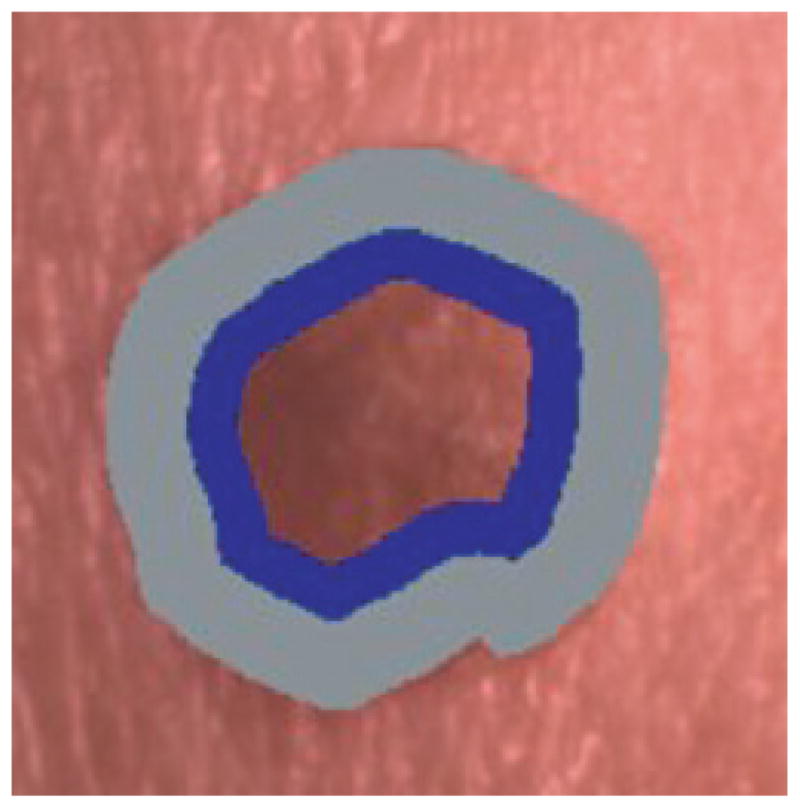
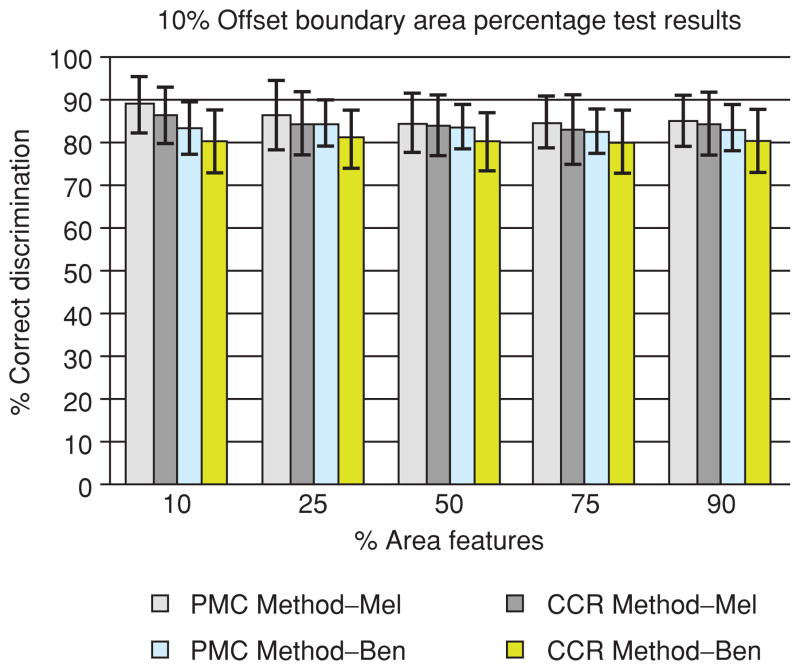
Results: Experimental results show improved discrimination capability for feature calculations focused in the lesion boundary region. Specifically, correct melanoma and benign recognition rates are observed as high as 89 and 83%, respectively, for the percent melanoma colour feature computed using only the outermost, uniformly distributed 10% of the lesion's area.
Conclusions: The experimental results show for the features investigated that the region closest to the skin lesion boundary contains the greatest colour discrimination information for lesion screening. Furthermore, the percent melanoma colour feature consistently outperformed the colour clustering ratio for the different skin lesion regions examined. The clinical application of this result is that clustered colours appear to be no more significant than colours of arbitrary distribution within a lesion.
Figures
References
-
- Friedman RJ, Rigel DS, Kopf AW. Early detection of malignant melanoma: the role of physician examination and self-examination of the skin. Ca-A Cancer J Clinicians. 1985;35:130–151. - PubMed
-
- Landau M, Matz H, Tur E, Dvir M, Brenner S. Computerized system to enhance the clinical diagnosis of pigmented cutaneous malignancies. Int J Dermatol. 1999;38:443–446. - PubMed
-
- Schindewolf T, Stolz W, Albert R, Abmayr R, Abmayr W, Harms H. Classification of melanocytic lesions with color and texture analysis using digital image processing. Anal Quant Cytol Histol. 1993;15:101–111. - PubMed
-
- Andreassi L, Perotti R, Burroni M, Dell’Eva G, Biagioli M. Computerized image analysis of pigmented lesions. Chronica Dermatol. 1995;1:11–24.
-
- Ercal F, Chawla A, Stoecker WV, Lee HC, Moss RH. Neural network diagnosis of malignant melanoma from color images. IEEE Trans Biomed Eng. 1994;41:837–845. - PubMed
Publication types
MeSH terms
Grants and funding
LinkOut - more resources
Full Text Sources
Medical
