

Antimicrobial and immunologic activities of clarithromycin in a murine model of Mycoplasma pneumoniae-induced pneumonia
- PMID: 12709330
- PMCID: PMC153317
- DOI: 10.1128/AAC.47.5.1614-1620.2003
Antimicrobial and immunologic activities of clarithromycin in a murine model of Mycoplasma pneumoniae-induced pneumonia
Abstract
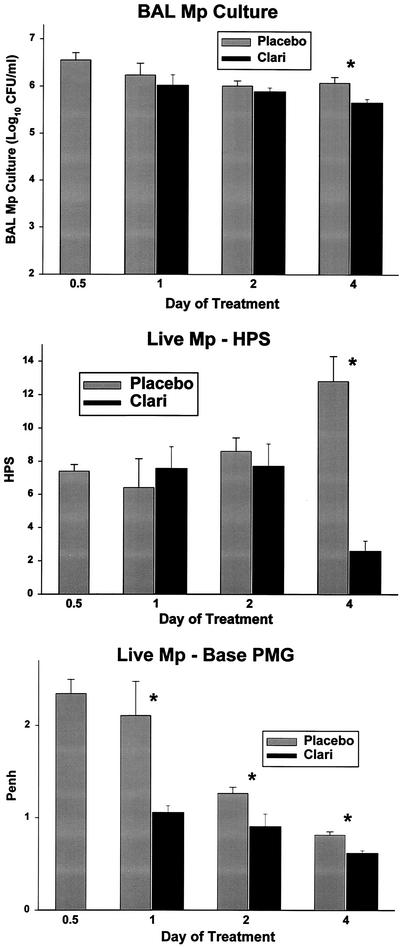
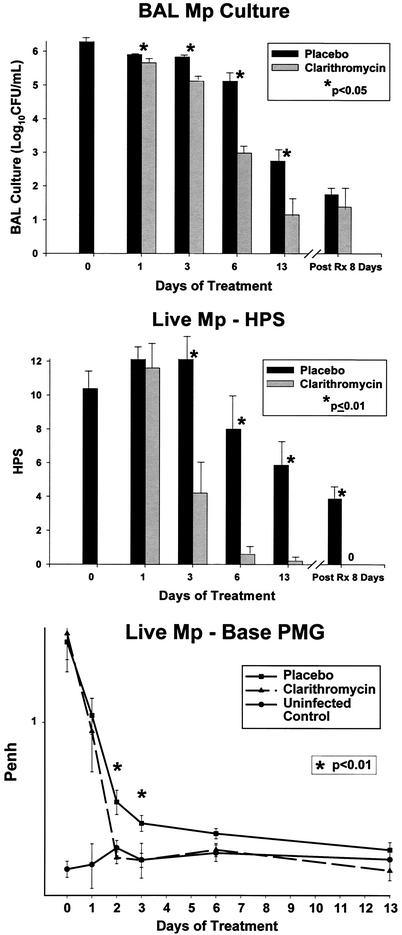
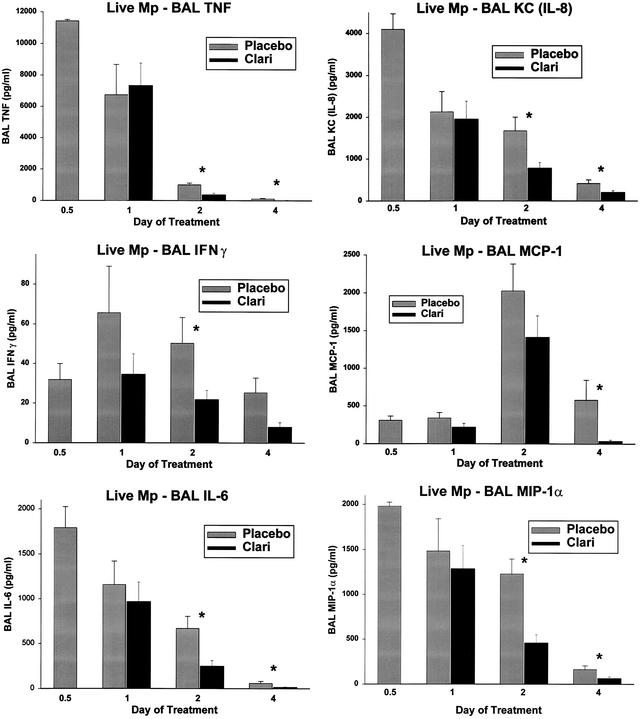
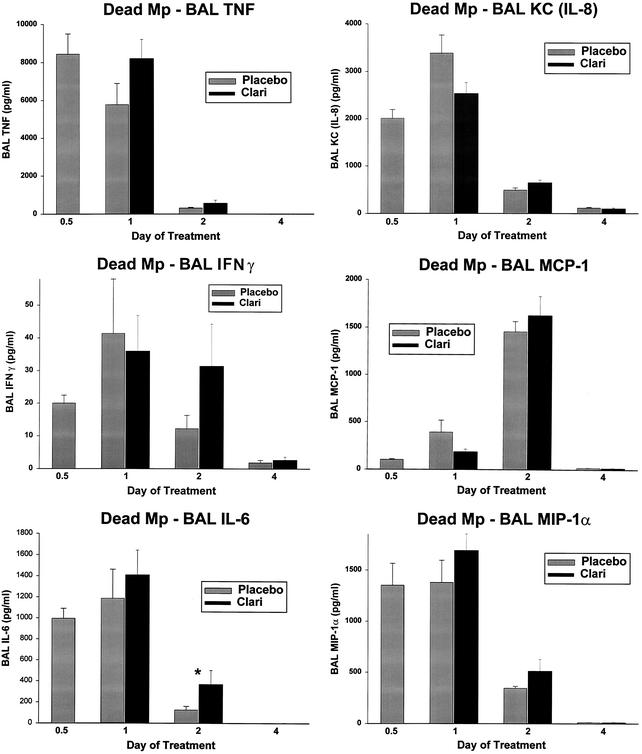
Because macrolide antibiotics are hypothesized to possess immunomodulatory activity independent of their antimicrobial activity, we evaluated the immunomodulatory effect of clarithromycin in a murine model of lung inflammation induced by either live or UV-killed Mycoplasma pneumoniae. BALB/c mice were intranasally inoculated once with live or UV-killed M. pneumoniae. Clarithromycin (25 mg/kg of body weight) or placebo was subcutaneously administered once daily in both groups of mice. In mice infected with live M. pneumoniae, clarithromycin treatment significantly reduced quantitative M. pneumoniae bronchoalveolar lavage (BAL) culture, pulmonary histopathologic scores (HPS), and airway resistance-obstruction (as measured by plethysmography) compared with placebo. Concentrations of tumor necrosis factor alpha, gamma interferon, interleukin-6 (IL-6), mouse KC (functional IL-8), JE/MCP-1, and MIP-1alpha in BAL fluid were also significantly decreased in mice infected with live M. pneumoniae given clarithromycin. In contrast, mice inoculated with UV-killed M. pneumoniae had no significant reduction in HPS, airway resistance-obstruction, or BAL cytokine or chemokine concentrations in response to clarithromycin administration. Clarithromycin therapy demonstrated beneficial effects (microbiologic, histologic, respiratory, and immunologic) on pneumonia in the mice infected with live M. pneumoniae; this was not observed in the mice inoculated with UV-killed M. pneumoniae.
Figures
References
-
- Cimolai, N., G. P. Taylor, D. Mah, and B. J. Morrison. 1992. Definition and application of a histopathological scoring scheme for an animal model of acute Mycoplasma pneumoniae pulmonary infection. Microbiol. Immunol. 36:465-478. - PubMed
-
- Denny, F. W., W. A. Clyde, Jr., and W. P. Glezen. 1971. Mycoplasma pneumoniae disease: clinical spectrum, pathophysiology, epidemiology, and control. J. Infect. Dis. 123:74-92. - PubMed
-
- Foy, H. M., J. T. Grayston, G. E. Kenny, E. R. Alexander, and R. McMahan. 1966. Epidemiology of Mycoplasma pneumoniae infection in families. JAMA 197:859-866. - PubMed
-
- Gonzalo, J. A., C. M. Lloyd, D. Wen, J. P. Albar, T. N. Wells, A. Proudfoot, A. C. Martinez, M. Dorf, T. Bjerke, A. J. Coyle, and J. C. Gutierrez-Ramos. 1998. The coordinated action of CC chemokines in the lung orchestrates allergic inflammation and airway hyperresponsiveness. J. Exp. Med. 188:157-167. - PMC - PubMed
Publication types
MeSH terms
Substances
LinkOut - more resources
Full Text Sources
Miscellaneous
