. 2003 May 1;31(9):2344-52.
doi: 10.1093/nar/gkg331.

Multiple, dispersed human U6 small nuclear RNA genes with varied transcriptional efficiencies

Affiliations

Multiple, dispersed human U6 small nuclear RNA genes with varied transcriptional efficiencies

Angela M Domitrovich et al. Nucleic Acids Res. .

Abstract

Vertebrate U6 small nuclear RNA (snRNA) gene promoters are among the founding members of those recognized by RNA polymerase III in which all control elements for initiation are located in the 5'-flanking region. Previously, one human U6 gene (U6-1) has been studied extensively. We have identified a total of nine full-length U6 loci in the human genome. Unlike human U1 and U2 snRNA genes, most of the full-length U6 loci are dispersed throughout the genome. Of the nine full-length U6 loci, five are potentially active genes (U6-1, U6-2, U6-7, U6-8 and U6-9) since they are bound by TATA-binding protein and enriched in acetylated histone H4 in cultured human 293 cells. These five all contain OCT, SPH, PSE and TATA elements, although the sequences of these elements are variable. Furthermore, these five genes are transcribed to different extents in vitro or after transient transfection of human 293 cells. Of the nine full-length U6 loci, only U6-7 and U6-8 are closely linked and contain highly conserved 5'-flanking regions. However, due to a modest sequence difference in the proximal sequence elements for U6-7 and U6-8, these genes are transcribed at very different levels in transfected cells.


Figures

Figure 1
Figure 1
Sequences of the promoter elements for the variant U6 promoters. (A) Distal regions containing the SPH and OCT sequences for the U6-1, U6-2, U6-7, U6-8 and U6-9 promoters. The letters in upper case indicate matches to the consensus sequence delineated at the top. The SPH consensus is from Schaub et al. (51). Each dash mark between the SPH and OCT elements represents one nucleotide. Note that the relative positions for the SPH and OCT elements are switched in the U6-2 and U6-9 promoters. (B) Proximal promoter regions containing the PSE and TATA sequences for the U6-1, U6-2, U6-7, U6-8 and U6-9 promoters. The letters in upper case indicate matches to the vertebrate PSE consensus sequence (52). Each dash mark between the PSE and TATA elements represents one nucleotide.
Figure 2
Figure 2
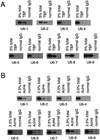
TATA-binding protein and acetylated histone H4 interact with U6-1, U6-2, U6-7, U6-8 and U6-9 promoters but not with the other potential full-length U6 genes. (A) Sheared chromatin from human 293 cells that had been cross-linked with formaldehyde was immunoselected with anti-TBP antibodies or normal IgG antibodies, and DNA was purified following reversal of cross-links. The relative amounts of the U6 promoter sequences in the antibody-selected DNA samples were determined by electrophoresis of radiolabeled PCR products on a 15% gel. As an input control, ‘5% total’ represents 5% of the unselected chromatin DNA compared with the amount of the antibody-selected chromatin DNA assayed by PCR. (B) Sheared chromatin from human 293 cells that had been cross-linked with formaldehyde was immunoselected with anti-AcH4 antibodies or normal IgG antibodies, and DNA was purified following reversal of cross-links. The relative amounts of the U6 promoter sequences in the antibody-selected DNA samples were determined by electrophoresis of radiolabeled PCR products on a 15% gel. As an input control, ‘2.5% total’ represents 2.5% of the unselected chromatin DNA compared with the amount of the antibody-selected chromatin DNA assayed by PCR.
Figure 3
Figure 3
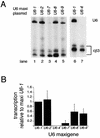
U6 genes with recognized promoter elements have transcriptional activity in transfected cells and in vitro. (A) Human 293 cells were transfected by the calcium phosphate technique with plasmid DNAs containing maxigenes of U6-1 or variant U6 promoters. Expression was detected by primer extension with a primer spanning only the maxigene insertion. ‘U6’ represents transcription from the U6 promoter, and ‘cβ3’ represents transcription from a co-transfected chicken β-tubulin plasmid used as a control to normalize for variable transfection efficiency. (B) The relative band intensities for (A) were quantitated by phosphorimaging. After background subtraction, the U6/cβ3 ratio was calculated and normalized to the value from the U6-1 promoter which was set to ‘1’. The height of each bar represents the mean of at least four different transfections, and the error bars show the standard deviation from the mean. (C) A 100 µg aliquot of HeLa S100 extract was incubated with 500 ng of the pGEM, U6-1 or the variant U6 promoter plasmids. ‘U6’ represents transcription from the U6 promoter. The ‘control’ is tRNAHis, which results from guanylyltransferase radiolabeling of endogenous RNA in the extract and serves as a recovery control for each sample. (D) The relative band intensities for (C) were quantitated by phosphorimaging. After background subtraction, the U6/control ratio was calculated and normalized to the value from the U6-1 promoter which was set to ‘1’. The height of the bar represents the mean of at least three different transcription assays, and the error bars show the standard deviation from the mean.
Figure 3
Figure 3
U6 genes with recognized promoter elements have transcriptional activity in transfected cells and in vitro. (A) Human 293 cells were transfected by the calcium phosphate technique with plasmid DNAs containing maxigenes of U6-1 or variant U6 promoters. Expression was detected by primer extension with a primer spanning only the maxigene insertion. ‘U6’ represents transcription from the U6 promoter, and ‘cβ3’ represents transcription from a co-transfected chicken β-tubulin plasmid used as a control to normalize for variable transfection efficiency. (B) The relative band intensities for (A) were quantitated by phosphorimaging. After background subtraction, the U6/cβ3 ratio was calculated and normalized to the value from the U6-1 promoter which was set to ‘1’. The height of each bar represents the mean of at least four different transfections, and the error bars show the standard deviation from the mean. (C) A 100 µg aliquot of HeLa S100 extract was incubated with 500 ng of the pGEM, U6-1 or the variant U6 promoter plasmids. ‘U6’ represents transcription from the U6 promoter. The ‘control’ is tRNAHis, which results from guanylyltransferase radiolabeling of endogenous RNA in the extract and serves as a recovery control for each sample. (D) The relative band intensities for (C) were quantitated by phosphorimaging. After background subtraction, the U6/control ratio was calculated and normalized to the value from the U6-1 promoter which was set to ‘1’. The height of the bar represents the mean of at least three different transcription assays, and the error bars show the standard deviation from the mean.
Figure 4
Figure 4
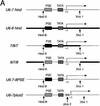
Different PSE elements are responsible for the differential expression of the U6-7 and U6-8 genes. (A) Proximal promoter structures of the various U6-7 and U6-8 plasmids used in these experiments. The PSE for the U6-7 promoter is a striped box, while the PSE for the U6-8 promoter is solid. The HindIII and XhoI arrows show where a HindIII site or XhoI site was inserted by site-directed mutagenesis. The ‘+1’ represents the transcriptional start site. A thin line represents the U6-7 gene, while a thick black line represents the U6-8 gene. The ‘XX’ in the U6-7plus2 promoter represents the addition of two nucleotides in that region. (B) Effect of swapping U6-7 and U6-8 proximal regions. Human 293 cells were transfected by the calcium phosphate method with plasmid DNAs containing the U6-7 hind (lane 1), U6-8 hind (lane 2), 7/8/7 (lane 3) and 8/7/8 (lane 4) promoters. Expression was detected by primer extension with a primer spanning only the maxigene insertion. ‘U6’ represents transcription from the variant U6 promoters, and ‘cβ3’ represents transcription from a co-transfected chicken β-tubulin plasmid used as a control to normalize for variable transfection efficiency. (C) Transfection experiments were carried out as described in (B), except that the plasmid DNAs contained either the U6-7 and U6-8 promoter without the HindIII site or the U6-7-8PSE or U6-7plus2 promoters.
Figure 4
Figure 4
Different PSE elements are responsible for the differential expression of the U6-7 and U6-8 genes. (A) Proximal promoter structures of the various U6-7 and U6-8 plasmids used in these experiments. The PSE for the U6-7 promoter is a striped box, while the PSE for the U6-8 promoter is solid. The HindIII and XhoI arrows show where a HindIII site or XhoI site was inserted by site-directed mutagenesis. The ‘+1’ represents the transcriptional start site. A thin line represents the U6-7 gene, while a thick black line represents the U6-8 gene. The ‘XX’ in the U6-7plus2 promoter represents the addition of two nucleotides in that region. (B) Effect of swapping U6-7 and U6-8 proximal regions. Human 293 cells were transfected by the calcium phosphate method with plasmid DNAs containing the U6-7 hind (lane 1), U6-8 hind (lane 2), 7/8/7 (lane 3) and 8/7/8 (lane 4) promoters. Expression was detected by primer extension with a primer spanning only the maxigene insertion. ‘U6’ represents transcription from the variant U6 promoters, and ‘cβ3’ represents transcription from a co-transfected chicken β-tubulin plasmid used as a control to normalize for variable transfection efficiency. (C) Transfection experiments were carried out as described in (B), except that the plasmid DNAs contained either the U6-7 and U6-8 promoter without the HindIII site or the U6-7-8PSE or U6-7plus2 promoters.
Figure 5
Figure 5
SNAPc binds to the U6-9 promoter. Sheared chromatin from human 293 cells that had been cross-linked with formaldehyde was immunoselected with anti-SNAP43 antibodies or normal IgG antibodies. The relative amounts of the U6-4, U6-9 and U6-1 promoter sequences in the antibody-selected DNA samples were determined by electrophoresis of radiolabeled PCR products on a 15% gel. As an input control, ‘5% total’ represents 5% of the unselected chromatin DNA compared with the amount of the antibody-selected chromatin DNA assayed by PCR.

Similar articles

Cited by

References

    1. Hernandez N. (2001) Small nuclear RNA genes: a model system to study fundamental mechanisms of transcription. J. Biol. Chem., 276, 26733–26736. - PubMed
    1. Mattaj I.W., Dathan,N.A., Parry,H.D., Carbon,P. and Krol,A. (1988) Changing the RNA polymerase specificity of U snRNA gene promoters. Cell, 55, 435–442. - PubMed
    1. Lobo S.M. and Hernandez,N. (1989) A 7 bp mutation converts a human RNA polymerase II snRNA promoter into an RNA polymerase III promoter. Cell, 58, 55–67. - PubMed
    1. Schaub M., Myslinski,E., Schuster,C., Krol,A. and Carbon,P. (1997) Staf, a promiscuous activator for enhanced transcription by RNA polymerases II and III. EMBO J., 16, 173–181. - PMC - PubMed
    1. Kunkel G.R., Cheung,T.C., Miyake,J.H., Urso,O., McNamara-Schroeder,K.J. and Stumph,W.E. (1996) Identification of a SPH element in the distal region of a human U6 small nuclear RNA gene promoter and characterization of the SPH binding factor in HeLa cell extracts. Gene Expr., 6, 59–72. - PMC - PubMed

Publication types