. 2003 May;91(6):673-95.
doi: 10.1093/aob/mcg073.

Efficiency of lignin biosynthesis: a quantitative analysis

Affiliations

Efficiency of lignin biosynthesis: a quantitative analysis

Jeffrey S Amthor. Ann Bot. 2003 May.

Abstract

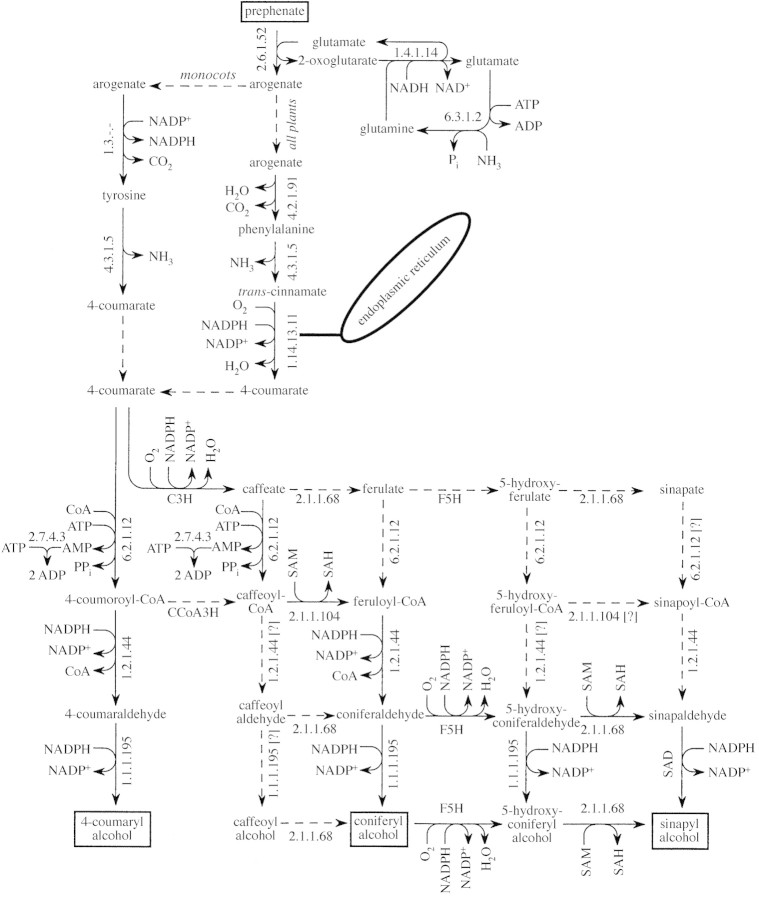
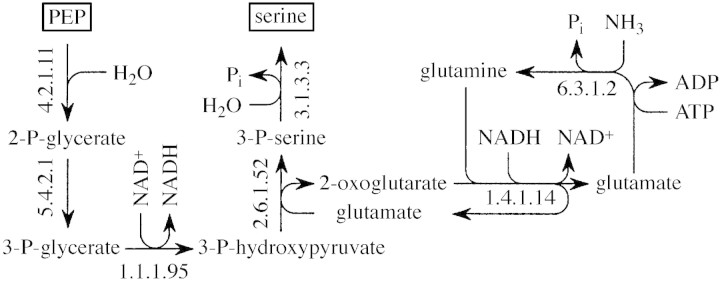
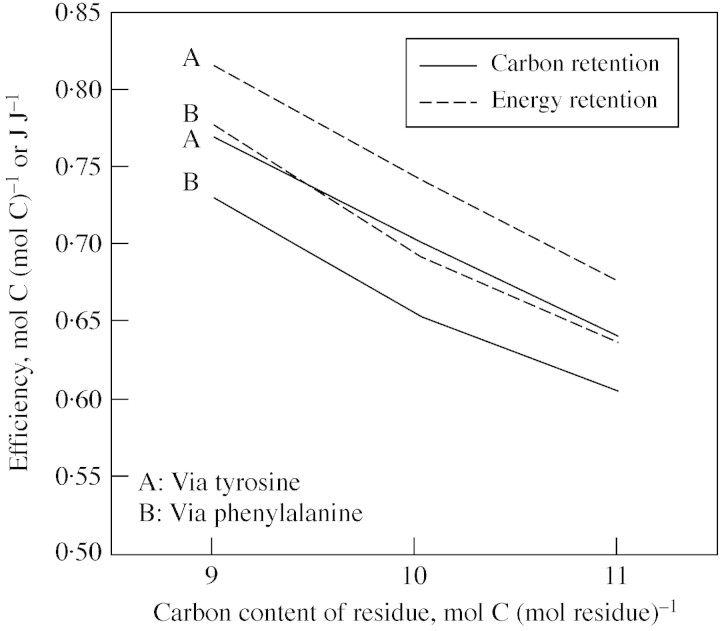
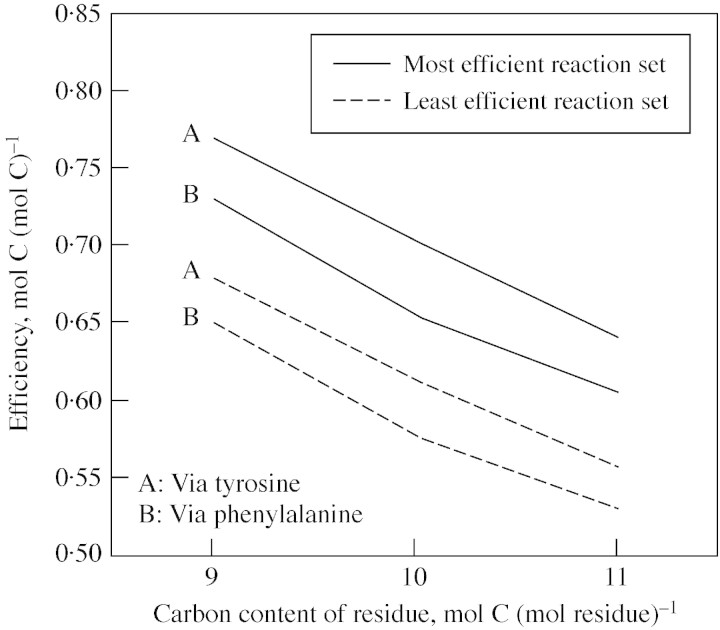
Lignin is derived mainly from three alcohol monomers: p-coumaryl alcohol, coniferyl alcohol and sinapyl alcohol. Biochemical reactions probably responsible for synthesizing these three monomers from sucrose, and then polymerizing the monomers into lignin, were analysed to estimate the amount of sucrose required to produce a unit of lignin. Included in the calculations were amounts of respiration required to provide NADPH (from NADP(+)) and ATP (from ADP) for lignin biosynthesis. Two pathways in the middle stage of monomer biosynthesis were considered: one via tyrosine (found in monocots) and the other via phenylalanine (found in all plants). If lignin biosynthesis proceeds with high efficiency via tyrosine, 76.9, 70.4 and 64.3 % of the carbon in sucrose can be retained in the fraction of lignin derived from p-coumaryl alcohol, coniferyl alcohol and sinapyl alcohol, respectively. The corresponding carbon retention values for lignin biosynthesis via phenylalanine are less, at 73.2, 65.7 and 60.7 %, respectively. Energy (i.e. heat of combustion) retention during lignin biosynthesis via tyrosine could be as high as 81.6, 74.5 and 67.8 % for lignin derived from p-coumaryl alcohol, coniferyl alcohol and sinapyl alcohol, respectively, with the corresponding potential energy retention values for lignin biosynthesis via phenylalanine being less, at 77.7, 69.5 and 63.9 %, respectively. Whether maximum efficiency occurs in situ is unclear, but these values are targets that can be considered in: (1) plant breeding programmes aimed at maximizing carbon or energy retention from photosynthate; (2) analyses of (minimum) metabolic costs of responding to environmental change or pest attack involving increased lignin biosynthesis; (3) understanding costs of lignification in older tissues; and (4) interpreting carbon balance measurements of organs and plants with large lignin concentrations.


Figures

None
Fig. 1. Pathways from sucrose to prephenate. Substrate and end product of the reaction set are enclosed in boxes. Enzyme Commission (EC) numbers are given with each reaction. Many reactions are reversible; arrows indicate direction for lignin biosynthesis and for respiration. Sucrose is split by either invertase (β‐fructofuranosidase; EC 3.2.1.26) or sucrose synthase (EC 2.4.1.13). Dashed arrows at the top differentiate alternative ‘starting points’ for sucrose catabolism. Products of sucrose breakdown contribute to a pool of cytosolic glucose 6‐P and fructose 6‐P (ap Rees, 1988), which are freely interconvertible in what is labelled ‘hexose‐P pool’. In the cytosol, fructose 6‐P can be converted to fructose 1,6‐P2 by two different reactions, one catalysed by 6‐phosphofructokinase (EC 2.7.1.11) and the other by PPi–fructose‐6‐P 1‐phosphotransferase (EC 2.7.1.90). Dashed arrows indicate alternative sources of fructose 1,6‐P2. [PPi–fructose‐6‐P 1‐phosphotransferase is confined to cytosol (Plaxton, 1996), so if fructose 6‐P is phosphorylated in plastids, only one reaction is available.] Fructose 1,6‐P2 is converted to 2 phosphoenolpyruvate (PEP) in glycolysis. As drawn, glycerone‐P moves from cytosol to plastid, although other glycolytic intermediates (e.g. glucose 1‐P, 3‐P‐glycerate and PEP) can also move from cytosol to plastids (Plaxton, 1996). The Pi exchanged for glycerone‐P during cytosolic‐plastidic countertransport is balanced by net Pi releases in the plastid. As drawn, the hexose‐P pool supplies glucose 6‐P to plastids, where erythrose 4‐P (E4P) is produced by cyclic operation of the oxidative pentose phosphate pathway (OPPP) (ap Rees, 1985; Copeland and Turner, 1987; Debnam and Emes, 1999). The PEP and E4P formed by glycolysis and the OPPP, respectively, are combined in the shikimate pathway to produce prephenate. Naming of shikimate pathway intermediates follows Herrmann and Weaver (1999). NAD is required by 3‐dehydroquinate synthase (EC 4.6.1.3). Shikimate 5‐dehydrogenase (EC 1.1.1.25) and 3‐dehydroquinate dehydratase (EC 4.2.1.10) are bifunctional forms of a single polypeptide (Herrmann and Weaver, 1999). [Oxidation of NADPH by shikimate 5‐dehydrogenase is not explicitly shown in Herrmann and Weaver (1999, their Fig. 4).] Chorismate synthase (EC 4.6.1.4) requires NADPH and reduced flavin (FMN) (Higuchi, 1997). Shikimate pathway reactions through to at least chorismate production are presumably confined to plastids (Herrmann and Weaver, 1999). Chorismate and chorismate mutase (EC 5.4.99.5) may exist in plastids and cytosol (Eberhard et al., 1996a, b; Sommer and Heide, 1998; Mobley et al., 1999). It is assumed that NAD+/NADH, NADP+/NADPH and ADP/ATP shuttles maintain cytosolic/plastidic metabolite balances without additional inputs.
None
Fig. 2. Pathways from prephenate to 4‐coumaryl alcohol, coniferyl alcohol and sinapyl alcohol. Substrate and end products of the reaction set are enclosed in boxes. EC numbers are given for most reactions; conversion of arogenate to tyrosine with NADP+ as cosubstrate follows Rösler et al. (1997), though no EC number for the catalysing enzyme has been assigned, and enzymes labelled C3H (4‐hydroxycinnamate 3‐hydroxylase) (e.g. Higuchi, 1997), F5H (ferulate 5‐hydroxylase) (e.g. Higuchi, 1997), CCoA3H (caffeoyl‐CoA 3‐hydroxylase) (e.g. Eckardt, 2002) and SAD (sinapyl alcohol dehydrogenase) (e.g. Li et al., 2001) have apparently not been assigned EC numbers. Two routes from arogenate to 4‐coumarate are shown (indicated by dashed arrows at branch points). The tyrosine route is found in monocots and the phenylalanine route in all plants. Activity of phenylalanine ammonia‐lyase (EC 4.3.1.5) with both phenylalanine and tyrosine as substrate resides in a single polypeptide (Rösler et al., 1997). The NH3 released in both routes is assumed to be re‐assimilated in a reaction coupled to regeneration of glutamate from 2‐oxoglutarate, which is consistent with measurements by Razal et al. (1996). Predominant pathways converting 4‐coumarate to 4‐coumaryl alcohol, coniferyl alcohol and sinapyl alcohol are shown with solid lines (e.g. Guo et al., 2001; Li et al., 2001; Eckardt, 2002). Dashed lines in the lower part of the figure indicate possible alternative routes of coniferyl alcohol and sinapyl alcohol biosyntheses (e.g. Whetten et al., 1998; Zhong et al., 1998; Chen et al., 1999; Guo et al., 2001; Eckardt, 2002). It is assumed here that reactions shown with dashed lines in the lower part of the figure involve the same cosubstrates and by‐products shown for reactions to their left or right (for vertical arrows), or above or below (for horizontal arrows). Thus, input–output balances are equal for any pathway from 4‐coumarate to a given monolignol. Glutamate‐ammonia ligase (EC 6.3.1.2) is active in the cytosol (Lea et al., 1990) and plastids. Pathways from prephenate to tyrosine and phenylalanine might occur in plastids or the cytosol. The P450‐mono‐oxygenase (EC 1.14.13.11) catalysing conversion of trans‐cinnamate to 4‐coumarate is bound to an endoplasmic reticulum.
None
Fig. 3. Monolignol transport from cytosol to apoplast, followed by polymerization. Monolignol starting points and lignin polymer end points are shown in boxes. Enzyme Commission (EC) numbers are given with each reaction. Three alternatives are shown for monolignol transport to apoplast (one including an intermediate stage of glycosylation and vacuolar storage) and two alternatives are shown for polymerization. ATP hydrolysis is probably not directly coupled to monolignol transport from cytosol to apoplast as shown, but may involve H+ pumping to apoplast followed by H+ re‐entry into cytosol coupled to countertransport of monolignols. Alternatively, monolignols (or monolignol glucosides) might move from cytosol to apoplast freely. ‘Ligninn’ indicates a lignin polymer composed of n monolignol residues. The reaction sequence for H2O2 production, required for peroxidase (EC 1.11.1.x) activity, is based on Elstner (1987) and Higuchi (1997) among others. Regeneration of malate from oxaloacetate is required for continued operation of the H2O2‐producing reaction set, and this is assumed to occur in cytosol. Laccase (EC 1.10.3.2) uses only dissolved molecular oxygen as cosubstrate (Yaropolov et al., 1994). (Laccase does not use 0·5 O2 in a reaction, nor is 0·5 H2O2 used in combination with cycling of 0·5 OAA and 0·5 malate for peroxidase activity; the stoichiometries relative to 1 monolignol are shown, and assume a limited chain reaction of radical propagation.) Only net O2 uptake and H2O production (or consumption) accompany polymerization in the apoplast, though this is linked to cytosolic NADH oxidation when peroxidase is active. Önnerud et al. (2002) proposed that peroxidase is never in direct contact with a monolignol during polymerization, but rather that a diffusible redox shuttle (they used Mn‐based systems in their experiments) could facilitate the radical polymerization process. The net stoichiometry of lignin polymerization might be unaffected by such a diffusible redox shuttle.
None
Fig. 4. Pathways regenerating S‐adenosylmethionine (SAM) from S‐adenosylhomocysteine (SAH). Substrates and end product of the reaction set are enclosed in boxes. EC numbers are given with each reaction. Many reactions are reversible; arrows indicate direction required for SAM regeneration. The first reaction (on the left) releases adenosine. Two reaction sets converting that adenosine to ADP are shown (differentiated by dashed arrows). The first begins with adenosine kinase (EC 2.7.1.20) activity, and the second begins with adenosine nucleosidase (EC 3.2.2.7) activity. The second includes α‐5‐phosphoribosylpyrophosphate (PRPP) as an intermediate. The preferred reaction set in plants is unknown; in yeasts with impaired adenosine kinase, SAH can accumulate, indicating that the adenosine kinase‐based reaction set is most important in these organisms (Ravanel et al., 1998). Two reaction subsets (differentiated by dashed arrows) are shown for conversion of 2 5,6,7,8‐tetrahydrofolate (THF) to 2 5,10‐methylene‐THF. The first (top, centre) consumes serine (and produces CO2) and the second (top, right) consumes formate (e.g. Chen et al., 1997). In plants, serine hydroxymethyltransferase (EC 2.1.2.1) was found in mitochondria, plastids and cytosol (Ravanel et al., 1998), and formate‐tetrahydrofolate ligase (EC 6.3.4.3) was found mainly in cytosol (Cossins and Chen, 1997). These reaction sets regenerate two SAM from two SAH so that when serine is used as substrate the glycine produced is also consumed in 5,10‐methylene‐THF production, giving only H2O, CO2 and NH3 as by‐products (the NH3 is assumed to be re‐assimilated during serine biosynthesis; Fig. 6). The 5,10‐methylene‐THF reductase (EC 1.5.1.20) reaction is known to occur in mammals. The enzyme in bacteria (EC 1.7.99.5) uses FADH2 rather than NADPH. It is unknown whether FADH2 or NADPH serve as the reductant in plants (Ravanel et al., 1998), or indeed, whether NADH might be used (Cossins and Chen, 1997); the NADPH‐requiring form was chosen here for convenience. THF might exist in mono‐ or polyglutamate forms (Cossins and Chen, 1997). Additional energy might be required to reattach any glutamate residues cleaved during operation of these reaction sets. In this analysis it was assumed that THF‐bound glutamate residues were not cleaved during SAM regeneration.
None
Fig. 5. Potential pathways of formate production from methanol (e.g. Igamberdiev et al., 1999). EC numbers are given with each reaction. The two pathways shown are equivalent in terms of net inputs and net outputs.
None
Fig. 6. Potential pathway of serine production from PEP (after Fig. 4·4–1 in Michal, 1999). EC numbers are given with each reaction. Some reactions are reversible; arrows indicate the direction for serine biosynthesis. In photosynthetically active cells, serine (and glycine) metabolism may be associated directly with photosynthesis, but such an association was ignored in the present analysis of lignin biosynthesis.
None
Fig. 7. Efficiency of biosynthesis of fractions of lignins associated with the three main monolignol residues containing nine (hydroxyphenol), 10 (guaiacyl) or 11 (syringyl) carbon atoms per residue when the most efficient reaction sets of biosynthesis were used. Efficiency was quantified by the retention of carbon (solid lines) and energy (dashed lines) in lignin per unit carbon (or energy) contained in the sucrose substrate of lignin biosynthesis (Table 7) (reaction sets including methanol as cosubstrate were not considered here). Energy retention was larger than carbon retention because lignins are more reduced (more energy per carbon atom) than sucrose. All calculations were based on YATP,sucrose = 60 ATP per sucrose, YATP,cyt‐NADH = 1·5 ATP formed per NADH oxidized, and YATP,cyt‐NADPH = 1·5 ATP formed per NADPH oxidized.
None
Fig. 8. Efficiency of biosynthesis of fractions of lignins associated with the three main monolignol residues containing nine (hydroxyphenol), 10 (guaiacyl) or 11 (syringyl) carbon atoms per residue when the most efficient (solid lines) and the least efficient (dashed lines) reaction sets of biosynthesis were compared. Efficiency was quantified by the retention of carbon in lignin per unit carbon contained in the sucrose substrate of lignin biosynthesis (Table 7) (reaction sets including methanol as cosubstrate were not considered here). All calculations were based on YATP,sucrose = 60 ATP per sucrose, YATP,cyt‐NADH = 1·5 ATP formed per NADH oxidized, and YATP,cyt‐NADPH = 1·5 ATP formed per NADPH oxidized.

Similar articles

Cited by

References

    1. AgarwalUP, Atalla RH.1986. In‐situ microprobe studies of plant cell walls: macromolecular organization and compositional variability in the secondary wall of Picea mariana (Mill.) B.S.P. Planta 169: 325–332. - PubMed
    1. AmthorJS.1994. Respiration and carbon assimilate use. In: Boote KJ, Bennett JM, Sinclair TR, Paulsen GM, eds. Physiology and determination of crop yield Madison: American Society of Agronomy, 221–250.
    1. AmthorJS.2000. The McCree–de Wit–Penning de Vries–Thornley respiration paradigms: 30 years later. Annals of Botany 86: 1–20.
    1. ap ReesT.1985. The organization of glycolysis and the oxidative pentose phosphate pathway in plants. In: Douce R, Day DA, eds. Encyclopedia of plant physiology, new series, volume 18 Berlin: Springer‐Verlag, 391–417.
    1. ap ReesT.1988. Hexose phosphate metabolism by nonphotosynthetic tissues of higher plants. In: Preiss J, ed. The biochemistry of plants, volume 14 San Diego: Academic Press, 1–33.

Publication types