. 2003 Apr 15;23(8):3186-95.
doi: 10.1523/JNEUROSCI.23-08-03186.2003.

Independent sources of quantal variability at single glutamatergic synapses

Affiliations

Independent sources of quantal variability at single glutamatergic synapses

Kevin M Franks et al. J Neurosci. .

Abstract

Variability in the size of single postsynaptic responses is a feature of most central neurons, although the source of this variability is not completely understood. The dominant source of variability could be either intersynaptic or intrasynaptic. To quantitatively examine this question, a biophysically realistic model of an idealized central axospinous synapse was used to assess mechanisms underlying synaptic variability measurements. Three independent sources of variability were considered: stochasticity of postsynaptic receptors ("channel noise"), variations of glutamate concentration in the synaptic cleft (Deltaq), and differences in the potency of vesicles released from different locations on the active zone [release-location dependence (RLD)]. As expected, channel noise was small (8% of the total variance) and Deltaq was the dominant source of variability (58% of total variance). Surprisingly, RLD accounted for a significant amount of variability (36%). Our simulations show that potency of release sites decreased with a length constant of approximately 100 nm, and that receptors were not activated by release events >300 nm away, which is consistent with the observation that single active zones are rarely >300 nm. RLD also predicts that the manner in which receptors are added or removed from synapses can dramatically affect the nature of the synaptic response, with increasing receptor density being more efficient than merely increasing synaptic area. Saturation levels and synaptic geometry were also important in determining the size and shape of the distribution of amplitudes recorded at different synapses.


Figures
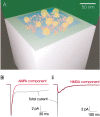
Fig. 1.
Fig. 1.
Simulated miniature EPSCs (mEPSCs) are composed of AMPA and NMDA components. A, AMPA and NMDA receptors (red icons) were distributed on the top surface of a spine head (gray cube). A presynaptic bouton (green) was separated from the spine by a 20 nm synaptic cleft. Synaptic vesicles (yellow) were randomly assigned above the PSD, on a surface adjacent to the bottom of the PSD (blue). This structure was embedded within a complex three-dimensional tortuous neuropil (not shown). B, Ensemble miniature EPSCs (black) showing the AMPA (i) and NMDA (ii) components (red).
Fig. 2.
Fig. 2.
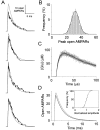
Distribution of synaptic amplitudes at a single synapse. A, Typical individual traces (thick traces) plotted with the ensemble average (thin traces; 1100 simulations averaged together). B, Normalized distribution of peaks from all 1000 simulations (100 from each of the 11 release locations). The solid line is a theoretical fit to the data using Equation 2(r = 0.977).
Fig. 3.
Fig. 3.
Noise caused by stochastic flicker of receptors.A, Examples of four typical individual trials. Raw traces (thick traces) are plotted with ensemble averages (thin traces;n = 1000) after release of exactly 2000 glutamate molecules. B, Distribution of synaptic responses. A normal distribution could be fit to the data (solid line;r = 0.995). C, Glutamate (Glu) concentration in a sampling volume within the synaptic cleft for nine trials (thin gray traces) plotted with the ensemble average of 1000 trials (thick black trace) shows little trial-to-trial variability.D, Ensemble average of traces with (black) and without (gray) desensitization states. Inset, Cumulative histogram of normalized amplitudes with (black) and without (gray) variability.
Fig. 4.
Fig. 4.
Variability in quantal size contributes to most synaptic variability. A, B, Distribution of quantal sizes (A) and resulting synaptic responses with vesicle–lumen diameters set to 25 ± 3.4 nm (B; n = 1000). Solid lines are forced fits of q and mini amplitudes to the distribution predicted by Equation 2. C, Summary of increasing synaptic variability plotted against increasing variability in vesicle diameter. D, Dose–response curves for 200 AMPARs at a 350- nm-diameter PSD. The solid line is an exponential fit to the data Nopen = 172 × (1 − eq/7400) − 8.2.
Fig. 5.
Fig. 5.
The shape of mini amplitude distributions depends on vesicle concentration. A, Distribution ofq (i) and peak (ii) amplitudes for vesicles with = 1000 glutamate molecules.B, Distribution of q(i) and peak (ii) amplitudes for vesicles with = 4000 glutamate molecules. Solid lines in Ai andBi are forced fits to Equation 2. Solid lines inAii and Bii are Gaussian fits to the data. Note that for both cases, the shape of the input (q) was the same, whereas the shape of the output (peak number of open AMPARs) was drastically different.
Fig. 6.
Fig. 6.
The shape of mini amplitude distributions does not depend on receptor number. A–C, Normalized distribution of mini amplitude after release at synapses containing 50 (A), 200 (B), and 800 (C) AMPARs after release with variableq. Solid lines indicate the shape of the forced Gaussian distribution using the mean and SD of the mini distribution. Data inB are the same as shown in Figure 3B but normalized to a mean amplitude of 1. Note that the shape, variability, and saturation levels were similar at synapses with a large range of receptors.
Fig. 7.
Fig. 7.
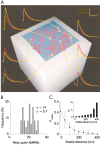
Synaptic efficacy depends on release location.A, Schematic representation of the synaptic cleft. Individual AMPARs (red) were distributed across a 350 nm disk atop the spine (gray). Release sites were distributed across a flat active zone 350 nm on a side (blue) adjacent to the underside of the presynaptic bouton (data not shown). Yellow traces represent the ensemble average of simulations released from a single point, whose location is indicated by the yellow disks. Each trace is plotted with the ensemble average from all locations (red traces) for comparison with relative efficacy. B, Distribution of all peak open AMPARs from ensemble averages 51 release locations (release from the center, 50 randomly assigned locations). C, Decreasing average probability of activating individual receptors displaced with increasing radial distance from the site of release. The solid line is an exponential fit to the data; Popen = 0.42×e−r/88 nm, wherer is the radial distance from the center of the PSD. NMDAR efficacy displayed similar spatially dependent properties, with an e-fold decrement of ∼125 nm (data not shown). Inset, CV increased with increasing radial distance from the site of release.
Fig. 8.
Fig. 8.
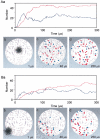
Differences in receptor activation with central and peripheral release events. A, Release from the center of the synapse. a, Evolution of single-bound (dark blue) and double-bound (red) AMPAR states with release att = 0. b, Schematic showing the synaptic cleft and synaptic face of the postsynaptic cell 1 μsec after release. Glutamate is indicated by small black spheres. The white disk shows 350-nm-diameter PSD. AMPARs are 60-nm-diameter pentagonal structures with state-dependent color coding: single-bound, dark blue; double-bound, red; all other receptor states, including unbound and desensitized, light blue. c, Forty microseconds after release, the transmitter had equilibrated across the synapse and the number of double-bound receptors increased most steeply.d, By 250 μsec, most of the transmitter had left the cleft, and the number of double-bound receptors, distributed uniformly across the synapse, had peaked. B, Release from the edge of the synapse. a, Evolution of single- and double-bound AMPARs states. b, Glutamate distribution 1 μsec after release from the edge of synapse. c, One-half of the transmitter had left the cleft, although its distribution was not yet uniform after 40 μsec. Primarily receptors near the release site were bound. d, Significantly fewer AMPARs, primarily those close to the release site, were double-bound 250 μsec after peripheral release.
Fig. 9.
Fig. 9.
Signaling properties with different synaptic configurations. A, Schematic view of the three synaptic configurations that were used (from left to right): circular PSD, rectangular PSD, and annular PSD. Note that all PSD areas and receptor densities are the same. Twenty release locations were randomly assigned to the release plane (blue) located just below the presynaptic bouton.B, Ensemble averages (n = 1000; 50 trials from each location) for the three synaptic configurations.C, Release-location-dependent variability for the three synaptic configurations. The data shown are variability in the peak number of open receptors from the ensemble averages for each of the 20 release locations.

References

    1. Andrasfalvy BK, Magee JC. Distance-dependent increase in AMPA receptor number in the dendrites of adult hippocampal CA1 pyramidal neuron. J Neurosci. 2001;21:9151–9159. - PMC - PubMed
    1. Auger C, Marty A. Heterogeneity of functional synaptic parameters among single release sites. Neuron. 1997;19:139–150. - PubMed
    1. Auger C, Marty A. Quantal currents at single-site central synapses. J Physiol (Lond) 2000;526:3–11. - PMC - PubMed
    1. Bartol TM, Jr, Land BR, Salpeter EE, Salpeter MM. Monte Carlo simulation of miniature endplate current generation in the vertebrate neuromuscular junction. J Biophys. 1991;59:1290–1307. - PMC - PubMed
    1. Bekkers JM, Richardson G, Stevens CF. Origin of variability in quantal size in cultured hippocampal neurons and hippocampal slices. Proc Natl Acad Sci USA. 1990;87:5359–5362. - PMC - PubMed

Publication types

MeSH terms