. 2003 Apr 15;23(8):3251-61.
doi: 10.1523/JNEUROSCI.23-08-03251.2003.

Activity-dependent trafficking and dynamic localization of zipcode binding protein 1 and beta-actin mRNA in dendrites and spines of hippocampal neurons

Affiliations

Activity-dependent trafficking and dynamic localization of zipcode binding protein 1 and beta-actin mRNA in dendrites and spines of hippocampal neurons

Dhanrajan M Tiruchinapalli et al. J Neurosci. .

Abstract

RNA binding proteins may be important mediators of the activity-dependent transport of mRNAs to dendritic spines of activated synapses. We used fluorescence microscopy and digital imaging techniques applied to both fixed and live cultured hippocampal neurons to visualize the localization of the mRNA binding protein, zipcode binding protein 1 (ZBP1), and its dynamic movements in response to KCl-induced depolarization at high spatial and temporal resolution. With the use of immunofluorescence, image deconvolution, and three-dimensional reconstruction, ZBP1 was localized in the form of granules that were distributed in dendrites, spines, and subsynaptic sites. KCl depolarization increased the dendritic localization of ZBP1 that was not attributed to an increase in ZBP1 expression. Live cell imaging of single cells before and after perfusion of KCl revealed the rapid and directed efflux of ZBP1 granules from the cell body into dendrites in a proximo-distal gradient. High-speed imaging of enhanced green fluorescence protein-ZBP1 granules revealed rapid anterograde and retrograde movements in dendrites as well as dynamic movements in dendritic spines. A population of ZBP1 granules colocalized with beta-actin mRNA, and their spatial association in dendrites was increased by KCl depolarization. The NMDA receptor antagonist AP-5 impaired the dendritic localization of ZBP1 and beta-actin mRNA and inhibited the KCl-induced transport of ZBP1. The activity-dependent trafficking of ZBP1 and its dynamic movements within dendritic spines provide new evidence to implicate RNA binding proteins as regulators of mRNA transport to activated synapses in response to synaptic activity.


Figures
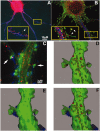
Fig. 1.
Fig. 1.
ZBP1 granules are localized in dendrites and beneath synapses of dendritic spines of cultured hippocampal neurons.A, Double-label immunofluorescence detection of ZBP1 (red) and microtubule-associated protein MAP2 (blue) overlaid on DIC optics. ZBP1 was abundant in the cell body and distributed throughout dendrites in the form of granules, which frequently were observed to extend beyond the microtubule-rich region of the dendritic shaft and into spine-like protrusions [small box is enlarged (arrow)].B, Triple-label fluorescence of ZBP1 (red), MAP2 (blue), and F-actin detected with phalloidin (green). ZBP1 granules were localized in the neck and head of spine-like structures (arrow, enlarged inset) and filopodia (arrowhead, enlarged inset).C, Triple-label fluorescence of ZBP1 (red), synaptophysin (blue), and F-actin detected with phalloidin (green). Use of conventional digital imaging and color overlay show colocalization (arrows) of ZBP1 granules (red) with synaptophysin (blue) and phalloidin-labeled spines (green). D–F, Three-dimensional reconstruction of a deconvolvedz-series of the region shown in C depicts a track-like or clustered arrangement of several ZBP1 (red) granules in the dendritic shaft (video 1, available at www.jneurosci.org). A cluster of ZBP1 granules also is observed on one side of a large spine (green) beneath a large presynaptic contact (blue) along the spine neck in a crevasse between the dendritic shaft and the bulbous spine head.D, ZBP1 (red) and phalloidin (green) merged.E, Synaptophysin (blue) and phalloidin (green) merged.F shows all three channels merged.
Fig. 2.
Fig. 2.
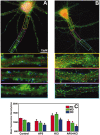
KCl-induced localization of ZBP1 granules in dendrites is dependent on NMDA receptor activity. A, Triple-label fluorescence detection of ZBP1 (red), synaptophysin (blue), and phalloidin (green). The colored boxes overlaid on top of the dendrites show schematically how the dendrite was divided into three regions of interest (proximal, middle, and distal) for performing quantitative digital imaging analysis of pixel intensities with IPLab software (Scanalytics). These three regions have been enlarged at the bottom of each panel by using the same color-coded border. All images were acquired with shorter exposure times than those used in Figure 1, such that the ZBP1 signal in dendrites was sparse and undetectable in distal regions of unstimulated neurons.B, The addition of 20 mm KCl to the culture medium for 15 min increased ZBP1 levels in all three dendritic regions as compared with unstimulated neurons. After KCl treatment ZBP1 fluorescence was now apparent in distal regions. C, Histogram of mean ZBP1 immunofluorescence intensities for each treatment; 45 dendrites, one per neuron, were analyzed from three experiments. KCl elicited a statistically significant increase in ZBP1 levels (mean 19.8% increase) as compared with nonstimulated control neurons. The NMDA receptor antagonist AP-5 completely inhibited the KCl response. Exposure of neurons to AP-5 alone for 15 min decreased ZBP levels (mean 12.6% decrease), which was not increased by KCl treatment in the presence of AP-5. Bars show group mean fluorescence intensity/area ± SEM ;*p < 0.01, two-tailed Mann–Whitney t test. Black asterisks denote significance as compared with control untreated neurons. Red asterisks denote significant difference between AP-5+KCl as compared with KCl treatment.
Fig. 3.
Fig. 3.
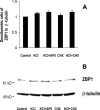
Western blot analysis of ZBP1 expression.A, KCl treatment for 15 min did not have a statistically significant effect on ZBP1 levels (normalized band intensities from three experiments). Densitometric ratio of ZBP1 to β-tubulin from the unstimulated neurons was scaled to 100%. ZBP1 levels from neurons treated with KCl, cycloheximide (CHX), KCl plus cycloheximide, or KCl plus APV showed <10% fluctuation in normalized intensities (which were not statistically significant). B, One representative Western blot for ZBP1 and β-tubulin (normalized control) is shown as an example.
Fig. 4.
Fig. 4.
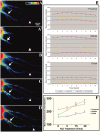
Rapid stimulation of EGFP-ZBP1 granule transport into dendrites visualized in live neurons after KCl depolarization. Neurons were transfected with EGFP-ZBP1 and imaged live before and after perfusion of 20 mm KCl containing culture medium. A short time lapse (10 frames) was acquired at t = 0, 5, 15, and 30 min after perfusion of KCl. A, EGFP-ZBP1 signal in proximal dendrite (arrow) from frame 1. Intensity was thresholded so no signal was apparent at distal sites (arrowhead). Fluorescence intensity was displayed as a heat-map (inset).A′, Frame 10 just before KCl perfusion shows comparable signal to Frame 1. B, At 5 min after KCl perfusion there is a marked increase in EGFP-ZBP1 levels at proximal site (arrow; note warmer colors via the heat map). Some weak signal is apparent at a distal site (arrowhead). C, D, EGFP-ZBP1 signals continue to increase at 15 and 30 min time points. E, Plot of timed average fluorescence intensities over time for proximal, middle, and distal dendritic regions of the cell imaged inA–D. Each of the four time lapses is shown in a different color (t = 0, 5, 15, and 30 min).F, The effects of KCl perfusion-induced increase in ZBP1 localization were analyzed in three live neurons, and the average fluorescence intensities in each region were plotted over time in KCl.
Fig. 5.
Fig. 5.
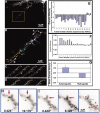
Tracking dynamic movements of single EGFP-ZBP1 granules in dendrites and spines. EGFP-ZBP1 granules are displayed in white for the higher contrast needed for particle tracking.A, Transfected neurons showing granules at low magnification. ZBP1 granules from boxed dendritic region are analyzed in detail. B, Higher magnification of this subregion revealed many moving granules. The trajectory of a granule moving rapidly in the retrograde (R, arrow) direction was tracked and analyzed frame by frame. The granule trajectory is shown as a heat map (granule moving from red to yellow to green to blue; see also video 2, available at www.jneurosci.org). Also tracked in this region was a rapidly moving anterograde granule (A, arrow). The granule trajectory is shown as a heat map (granule moving from red to yellow to green; see also video 3, available at www.jneurosci.org). C, D, Montage of selected frames from the time lapse for retrograde (C) and anterograde (D) granules. Colored arrows correspond to the heat map trajectories displayed in B. E, Histogram plots of instantaneous velocities (distance traveled between adjacent frames) for the retrograde granule. F, Instantaneous velocities for the anterograde granule. G, Average non-zero velocities of anterograde and retrograde granules (trajectories and frame-by-frame analysis for 15 granules that were analyzed). These average velocities included zero values where granules paused during a trajectory. H, EGFP-ZBP1 granules frequently observed at sites of dynamic dendritic filopodia. Here a filopodia emerges after 9 sec of time lapse (green arrowhead). I, EGFP-ZBP1 granule observed within a dendritic spine (red arrow). After 9 sec of time lapse a new granule emerges at the base of this spine (green). Granules were pseudo-colored (right panel) to compare pixels that contained ZBP1 in the first frame (red), both frames (yellow), or only in the second frame (green). ZBP1 granules present only in the second frame were attributed to movement of a new granule into the field of view.
Fig. 6.
Fig. 6.
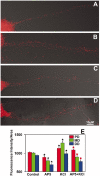
KCl-induced localization of β-actin mRNA granules. A, Localization of β-actin mRNA granules in dendrites of an unstimulated neuron. B, Increased localization of β-actin mRNA in dendrites 15 min after KCl stimulation. C, Exposure to the NMDA receptor antagonist AP-5 reduced the localization of β-actin mRNA in dendrites.D, Inhibition of NMDA receptor activation with AP-5 in the presence of KCl did not impair the depolarization-induced localization of β-actin mRNA in dendrites. E, Quantitative analysis of mean fluorescence intensities from 45 neurons per treatment demonstrated a significant increase in ZBP1 levels after KCl treatment in proximal, middle, and distal dendritic regions. Treatment of AP-5 alone significantly decreased the localization of β-actin mRNA as compared with control unstimulated neurons but did not inhibit the KCl-induced increase in β-actin mRNA. Bars show group means ± SEM; p ≤ 0.05*, two-tailed Mann–Whitney t test. Black asterisks denote significance as compared with control untreated neurons. Red asterisks denote comparison of AP-5- and AP-5+KCl-treated neurons.
Fig. 7.
Fig. 7.
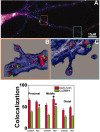
Overlapping distribution between ZBP1 and β-actin mRNA granules: effects of 15 min KCl depolarization.A, Triple-label fluorescence detection of β-actin mRNA (red), ZBP1 (green), and F-actin, using phalloidin (blue). By conventional digital imaging ZBP1 and β-actin mRNA both exhibited a granular pattern in dendrites with evidence for overlapping, but not highly colocalized, signals. A 3-D deconvolution and volume restoration were performed on two dendritic subregions that appeared to contain ZBP1 and β-actin mRNA signal in dendritic spines (orange and blue boxes). B, Enlargement of orange-boxed region depicts a granule within a bulbous dendritic spine that contains both β-actin mRNA (red) and ZBP1 (green). In the dendritic shaft the granules containing ZBP1 and β-actin mRNA varied in size from small puncta to larger clusters or aggregates. C, Enlargement of blue-boxed region also depicts granules that contain both ZBP1 and β-actin mRNA signal within the spine and shaft (see also video 4, available at www.jneurosci.org). D, Quantitative colocalization analysis of the spatial relationship between pixels containing ZBP1 (green) and β-actin mRNA (red). KCl treatment resulted in an overall 31.7% increase in the percentage of ZBP1 pixels that also contained β-actin mRNA (green bars), with statistical significance observed in proximal (25% increase) and middle (66% increase) dendritic regions. KCl treatment resulted in an 11.4% increase in the percentage of β-actin mRNA pixels that also contained ZBP1 (red bars), with statistical significance observed in middle dendritic regions (25% increase). Bars show group means ± SEM;p ≤ 0.01*, two-tailed Mann–Whitneyt test. Black asterisks denote significance as compared with control untreated neurons.

References

    1. Ainger K, Avossa D, Morgan F, Hill SJ, Barry C, Barbarese E, Carson JH. Transport and localization of exogenous myelin basic protein mRNA microinjected into oligodendrocytes. J Cell Biol. 1993;123:431–441. - PMC - PubMed
    1. Allison DW, Gelfand VI, Spector I, Craig AM. Role of actin in anchoring postsynaptic receptors in cultured hippocampal neurons: differential attachment of NMDA versus AMPA receptors. J Neurosci. 1998;18:2423–2436. - PMC - PubMed
    1. Bagni C, Mannucci L, Dotti CG, Amaldi F. Chemical stimulation of synaptosomes modulates α-Ca2+/calmodulin-dependent protein kinase II mRNA association to polysomes. J Neurosci 20 2000. RC76(1–6). - PMC - PubMed
    1. Bartlett WP, Banker GA. An electron microscopic study of the development of axons and dendrites by hippocampal neurons in culture. II. Synaptic relationships. J Neurosci. 1984;4:1954–1965. - PMC - PubMed
    1. Bassell GJ, Singer RH. Neuronal mRNA localization and the cytoskeleton. In: Richter D, editor. Cell polarity and subcellular RNA localization. Springer; Berlin: 2001. pp. 41–56. - PubMed

Publication types

MeSH terms