. 2003 Apr 15;23(8):3278-94.
doi: 10.1523/JNEUROSCI.23-08-03278.2003.

Autocrine/paracrine activation of the GABA(A) receptor inhibits the proliferation of neurogenic polysialylated neural cell adhesion molecule-positive (PSA-NCAM+) precursor cells from postnatal striatum

Affiliations

Autocrine/paracrine activation of the GABA(A) receptor inhibits the proliferation of neurogenic polysialylated neural cell adhesion molecule-positive (PSA-NCAM+) precursor cells from postnatal striatum

Laurent Nguyen et al. J Neurosci. .

Abstract

GABA and its type A receptor (GABA(A)R) are present in the immature CNS and may function as growth-regulatory signals during the development of embryonic neural precursor cells. In the present study, on the basis of their isopycnic properties in a buoyant density gradient, we developed an isolation procedure that allowed us to purify proliferative neural precursor cells from early postnatal rat striatum, which expressed the polysialylated form of the neural cell adhesion molecule (PSA-NCAM). These postnatal striatal PSA-NCAM+ cells were shown to proliferate in the presence of epidermal growth factor (EGF) and formed spheres that preferentially generated neurons in vitro. We demonstrated that PSA-NCAM+ neuronal precursors from postnatal striatum expressed GABA(A)R subunits in vitro and in situ. GABA elicited chloride currents in PSA-NCAM+ cells by activation of functional GABA(A)R that displayed a typical pharmacological profile. GABA(A)R activation in PSA-NCAM+ cells triggered a complex intracellular signaling combining a tonic inhibition of the mitogen-activated protein kinase cascade and an increase of intracellular calcium concentration by opening of voltage-gated calcium channels. We observed that the activation of GABA(A)R in PSA-NCAM+ neuronal precursors from postnatal striatum inhibited cell cycle progression both in neurospheres and in organotypic slices. Furthermore, postnatal PSA-NCAM+ striatal cells synthesized and released GABA, thus creating an autocrine/paracrine mechanism that controls their proliferation. We showed that EGF modulated this autocrine/paracrine loop by decreasing GABA production in PSA-NCAM+ cells. This demonstration of GABA synthesis and GABA(A)R function in striatal PSA-NCAM+ cells may shed new light on the understanding of key extrinsic cues that regulate the developmental potential of postnatal neuronal precursors in the CNS.


Figures

Fig. 1.
Fig. 1.
Purification and in vitroamplification of proliferative and neurogenic PSA-NCAM+ progenitors from early postnatal striatum.A, Bands of color-coded density marker beads in ultracentrifuged Percoll gradient. According to their isopycnic buoyant densities, living PSA-NCAM+ cells (B) were separated from differentiated neural cells and cell debris in a continuous Percoll gradient. Cells were collected in the interphase located between the ranges of density: 1052–1102 gm/ml as determined by a tube containing control density beads that was ultracentrifuged simultaneously. C, D, Confocal images of acutely dissociated cell suspension from newborn rat striatum before (C) and after (D) selection by centrifugation in a Percoll density gradient. Cells were immunostained for PSA-NCAM (green) and counterstained with the nuclear dye Etd1 (red). Cells acutely purified from early postnatal striatum (1 hr) or dissociated from 3-DIV-old spheres were allowed to adhere onto poly-ornithine-coated coverslips and were assessed by immunostaining. E, Histogram comparing the percentage of total cells expressing various markers 1 hr after purification (blue bars) and after 3 d of growth in vitro in EGF-containing medium (red bars). F–H, Confocal images of representative fields showing acutely purified cells immunostained for markers of neuronal commitment: F, Tuj1 (green); G, MAP2ab (green); H, NF-M (green), and FH, counterstaining with Etd1 (red). Purified cells cultured in EGF-containing medium for 3 d in uncoated conditions formed spheres (I) that were composed almost exclusively of PSA-NCAM+ cells. J, PSA-NCAM in green and Etd1 in red. K, Confocal optical section of a 3-DIV sphere immunostained for BrdU after 18 hr of BrdU incorporation assay in EGF-containing medium (PSA-NCAM in green and BrdU in red).L, Histograms representing the percentage of total cells that incorporated BrdU (20 μm) for each immunophenotype (left panel) and the percentage of total BrdU+ cells that expressed a given immunophenotype (right panel), respectively, in the presence (black bars) or absence (open bar) of EGF (20 ng/ml).M–O, Confocal optical section of 3-DIV spheres expressing markers of neuron commitment: M, Tuj1 (green); N, MAP2ab (green); O, NF-M (green) and counterstaining with Etd1 (red). Scale bars:BD, 10 μm;FK, 25 μm; MO, 20 μm.
Fig. 2.
Fig. 2.
GABAA receptors are expressed by PSA-NCAM+ progenitors from early postnatal striatum.A, B, RT-PCR amplification of GABAAR α1–5, β1–3, γ1–3, and δ subunit transcripts using RNA extracted from 3-DIV PSA-NCAM+ spheres (A) and adult rat brain tissue (B). Bands corresponding to α2 (549 bp), α4 (532 bp), α5 (300 bp), β1 (578 bp), β3 (587 bp), γ1(296 bp), and γ3 (336 bp) were detected (+, with RT; −, without RT). Left margins indicate migration of standard DNA markers with size indicated in base pairs. C, Z-series confocal image of 3-DIV PSA-NCAM+ cells immunoreactive for GABAAR α subunits (green). D, E, Confocal images of 3-DIV PSA-NCAM+ spheres showing GABAAR β+ cells (D, green), and GABAAR γ+ cells (E, green), respectively. All cultures were counterstained with Etd1 (red). Scale bars: CE, 10 μm.
Fig. 3.
Fig. 3.
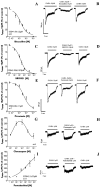
GABAA receptor activation triggers chloride-mediated inward currents in PSA-NCAM+ progenitor cells. A, Confocal image showing a GABA-responsive cell injected with Lucifer yellow (green) and expressing PSA-NCAM (red). B, Histogram representing the mean maximum current induced by GABA 1 mm and the percentage of responding cells in the total recorded population of 3 DIV PSA-NCAM+ cells, respectively. C, Concentration–response curve obtained from GABA-responsive PSA-NCAM+ progenitors.E, The specific GABAAR agonist muscimol also induced concentration-dependent currents in PSA-NCAM+ cells. D, F, Traces illustrating inward currents elicited by different concentrations of GABA (D) and muscimol (D).G–J, Reversal potential of GABA-induced currents (EGABA). I,J, Current–voltage relationship of GABA-evoked currents was studied by applying voltage steps ranging from −140 to +100 mV repetitively every 5 sec before, during, and after GABA (100 μm) application. Mean control currents (before and after GABA application) were subtracted from the currents recorded at the peak of the GABA response. G–I, Using the currents obtained in I, we constructed a current–voltage curve reversing at +5.89 mV (n = 4 cells), which is close to the calculated Nernst chloride equilibrium potential (−1.1 mV) (left panel). H–J, When extracellular chloride concentration was lowered (J), the reversal potential shifted to +30.63 mV (n = 5 cells), which again is close to the expected chloride equilibrium potential in this condition (+29.00 mV).
Fig. 4.
Fig. 4.
Pharmacological characterization of GABAAR expressed by PSA-NCAM+progenitors. A–F, GABA was applied at 10 μm (IGABA 10 μm), a concentration close to its EC50. GABA-evoked currents were reversibly inhibited by bicuculline (A, B), SR-95531 (C, D), and picrotoxin (E, F). G–J, We also tested positive allosteric modulators of GABAAR. Clonazepam potentiated GABA-induced currents (GABA at 1 μm, EC10) in a range of concentrations between 10 nm and 100 μm, with a maximal effect at 1 μm (G, H). I–J, Pentobarbital also enhanced GABA-evoked currents in a concentration-dependent manner.
Fig. 5.
Fig. 5.
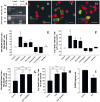
GABAAR activation inhibits the proliferation of PSA-NAM+ cells at both Tuj1 and Tuj1+ stages. Cells were incubated simultaneously with drugs and BrdU (20 μm) for 18 hr in EGF-free medium. The anti-mitotic agent cytosine arabinoside (AraC, 10 μm) was used as an internal control condition. (A, D, G). GABAAR agonists (100 μm GABA and 100 μm muscimol) inhibited the incorporation of BrdU (n = 6; ANOVA-1 followed by a Dunnett's post-test; *p < 0.05, **p < 0.01, ***p < 0.0001) in total PSA-NCAM+ cells (A), in Tuj1+/PSA-NCAM+ cells (D), and in Tuj1/PSA-NCAM+ cells (G). The effect of muscimol was totally abolished by SR-95531 (100 μm). Baclofen (100 μm), a GABABR agonist, had no effect on BrdU incorporation. (A, D, G). Muscimol (100 μm) significantly inhibited (n = 4; Student's t test; *p < 0.05) the mitogenic effect of EGF (20 ng/ml) (n = 4, Student's t test; **p < 0.01, ***p < 0.0001) in total PSA-NCAM+ cells (B) and in Tuj1+/PSA-NCAM+ cells (E), but not in Tuj1/PSA-NCAM+ cells (H). C, F, I, Confocal images of double-immunostaining for PSA-NCAM (red) and BrdU (green) (C), triple-immunostaining for PSA-NCAM (red), Tuj1 (blue), and BrdU (green) (F, I), respectively, showing that both Tuj1+/PSA-NCAM+ and Tuj1/PSA-NCAM+ cells are proliferative. Because a vast majority of cells constituting 3-DIV spheres expressed PSA-NCAM, we found similar results on the whole-cell population, and these results were confirmed in [3H]thymidine incorporation assay (data not shown, but see Fig. 8). Scale bars: C, F,I, 10 μm.
Fig. 6.
Fig. 6.
EGF-dependent production of endogenous GABA intrinsically inhibits the proliferation of PSA-NCAM+ precursor cells. A, RT-PCR amplification of both GAD 65 and GAD 67 transcripts from 3-DIV PSA-NCAM+ spheres and from control adult rat brain using specific sets of primers. RT-PCR analysis yielded bands with the appropriate amplicon size for GAD 65 (698 bp) and for the full-length functional GAD 67 (252 bp). Left margin indicates migration of standard DNA markers with size indicated in base pairs. B,C, Three-DIV-old dissociated PSA-NCAM+ spheres labeled for GAD 65 (B, green) or GAD 67 (C, green) and counterstained by Etd1 (red). D, Dissociated 3-DIV progenitors immunostained for GABA (green) and counterstained with Etd1 (red). Scale bars: BD, 10 μm.E, F, Histograms representing the differences of BrdU incorporation index (BrdU+cells/total cells, %) between treated and untreated conditions, respectively, in total PSA-NCAM+(E) and Tuj1+/PSA-NCAM+ cells (F). Antagonists and positive allosteric modulators of GABAAR were applied on 3-DIV-old synchronized cells for 18 hr of BrdU incorporation assay. GABAAR antagonists (10 μm SR-95531, 5 μmpicrotoxin, and 100 μm bicuculline) significantly increased the percentage of PSA-NCAM+/BrdU+ cells (n = 3; ANOVA-1 followed by a Dunnett's post-test, ns; *p < 0.05) (E) and Tuj1+/PSA-NCAM+/BrdU+cells (n = 3; ANOVA-1 followed by a Dunnett's post-test; *p < 0.05, **p < 0.01) (F). Conversely, GABAAR-positive allosteric modulators decreased the percentage of PSA-NCAM+/BrdU+cells (E) and Tuj1+/PSA-NCAM+/BrdU+cells (F) as compared with control. Saclofen (10 μm), a GABABR antagonist, had no effect (E, F). G,H, In the presence of EGF (20 ng/ml) (n = 4; Student's t test; ***p < 0.0001), SR-95531 (10 μm) (n = 4; Student's t test; **p < 0.01, ***p < 0.0001) had no effect on proliferation of total PSA-NCAM+cells (G) and of Tuj1+/PSA-NCAM+ cells (H). I, Histogram showing the concentration of GABA measured by HPLC in synchronized 3-DIV-old PSA-NCAM+ spheres treated or not with EGF for 18 hr. EGF-treated spheres contained a lower amount of GABA than that of untreated cultures (n = 3; Student'st test; *p < 0.05).
Fig. 7.
Fig. 7.
GABAAR modulators do not interfere with PSA-NCAM+ cell survival. A, Histogram showing a TUNEL bioassay that demonstrated the absence of effect of GABAAR modulators on apoptotic events in PSA-NCAM+ cell cultures (3-DIV, 18 hr of treatment in the different conditions. Roscovitine (40 μm) was used as a positive control (n = 3; ANOVA-1 followed by a Dunnett's post-test; **p < 0.01).B, Confocal images displaying representative fields comparing the percentage of TUNEL+ cells (green) in control (top row) versus roscovitine-treated (bottom row) conditions.
Fig. 8.
Fig. 8.
GABAAR activation inhibits proliferation of PSA-NCAM+ progenitors by blocking MAPK signaling pathways. Histogram shows that the increase of [3H]-thymidine incorporation induced by the GABAAR antagonist SR95531 (10 μm) and by EGF (20 ng/ml) was significantly blocked by U0126 (10 μm), a specific inhibitor of the mitogen-activated protein kinase kinases MEK1 and MEK2 (n = 5; Student's t test; *p < 0.05, **p < 0.01).
Fig. 9.
Fig. 9.
GABAAR activation inhibits the proliferation of Tuj1+/PSA-NCAM+progenitors by inducing a rise of intracellular calcium concentration.A, Time course (Ft/F0) of intracellular calcium concentration [Ca]i assessed in cultured (3 DIV) fluo-3 AM-loaded PSA-NCAM+ cells. We displayed fluorescence data recordings and fluo-3 AM on the basis of confocal images from two different cells (i.e., depolarization and muscimol responsive, open circles in the dot plot; depolarization responsive and muscimol nonresponsive, black circles in the dot plot) during successive treatments with solutions containing a high extracellular K+ concentration (50 mm), muscimol (100 μm), or muscimol (100 μm) + nifedipine (10 μm). The [Ca]i increase mediated by muscimol (100 μm) was abolished by the L-type voltage-gated calcium channel-blocker nifedipine (10 μm) (open circle-containing curve). B, Histogram representing the increase of [Ca]iFt/F0, %) triggered by a high extracellular K+concentration (50 mm; n = 28) and muscimol (100 μm; n = 20) (ANOVA-1 followed by a Dunnett's post-test; **p < 0.01). Moreover, the [Ca]i increase induced by muscimol (100 μm) was significantly reduced by nifedipine (10 μm; n = 20) (ANOVA-1 followed by a Dunnett's post-test; **p < 0.01). Examples of responsive cells are represented on the right in the image series. Cells that were both depolarization responsive and muscimol responsive are indicated by open arrows, and cells that were depolarization responsive but muscimol nonresponsive are indicated by white arrows.C, Histograms showing that the inhibition of proliferation induced by muscimol (100 μm) in Tuj1+/PSA-NCAM+ cells was completely blocked by nifedipine (10 μm). When applied alone, nifedipine significantly increased the proliferation of Tuj1+/PSA-NCAM+ cells (n = 4–5; Student's t test; ***p < 0.0001). D, In contrast, nifedipine (10 μm) did not block the inhibition of proliferation mediated by muscimol (100 μm) in Tuj1/PSA-NCAM+ cells and did not increase the proliferation of these cells when applied alone (n = 4–5; Student's t test; *p < 0.05).
Fig. 10.
Fig. 10.
GABAAR expression and activation in brain slices: the activation of GABAAR inhibits the proliferation of PSA-NCAM+ cells in the postnatal striatum and adjacent SVZ. A1–3, Confocal single plane images of immunohistochemical stainings (30-μm-thick tissue sections) showing a field containing the striatum separated from the subventricular zone (SVZ) by a white dotted line and bordered by the lateral ventricle (LV). PSA-NCAM staining appears in green (A1), GABAAR α appears in red (A2), and merge of A1 andA2 appears in A3. B1–4, High-magnification views of the field delimited by the boxed areaB of A1, which is a representative field of the striatum, with nuclei in blue (B1), PSA-NCAM in green (B2), GABAAR α in red (B3), and merge of B1, B2, and B3 in B4. Insets display two PSA-NCAM+ cells (high magnification) that are immunoreactive (arrowhead) or not immunoreactive (arrow), respectively, for GABAAR α. C1–4, High-magnification views of the field delimited by the boxed area C ofA1, which is a representative field of the SVZ, with nuclei in blue (C1), PSA-NCAM in green (C2), GABAAR α in red (C3), and merge of C1, C2, andC3 in C4. Insets show two PSA-NCAM+ cells (high magnification) immunoreactive (arrowhead) or not immunoreactive (arrow), respectively, for GABAAR α. E, F, Confocal images showing immunostaining of a striatal area (E) and an SVZ area (F) with nuclei in red and GABA staining in green. Insets display a GABA+ cell (arrow in full image) at higher magnification. G, Proliferation assay in acutely dissected organotypic tissue slices from postnatal striatum (Z-series confocal image) treated with EGF. We show BrdU (green) immunostaining in a PSA-NCAM (red)-expressing cell of a striatal slice after 18 hr of BrdU incorporation. Inset displays one cell (corresponding to the arrow in the full image) viewed as stacked Z-dimension images, comprising 0.5 μm optical sections taken 3 μm apart. The Z-dimension reconstruction was also observed orthogonally in both X–Z and Y–Z planes that are shown under and to the right of each Z-dimension composite, respectively. H, Confocal image of acutely isolated cells derived from mechanical dissociation of the striatal part of 400-μm-thick tissue slices at the end of the BrdU incorporation assay. These cells were immunostained for PSA-NCAM (red) and BrdU (green). Scale bars: C1–4, 30 μm;B1–4, EH, 40 μm;A1–3, 500 μm. I–L, Histograms showing BrdU labeling indexes in Tuj1/PSA-NCAM+ (I, K) and Tuj1+/PSA-NCAM+ (J, L) cells from the striatum (I, J) and the SVZ (K, L), as defined in A1. Striatal and SVZ areas were separated by microdissection of organotypic slices, placed in the same well, and then incubated with drugs and BrdU (20 μm) for 18 hr. In EGF-free medium, 100 μmmuscimol inhibited the incorporation of BrdU in Tuj1/PSA-NCAM+ and Tuj1+/PSA-NCAM+ cells from the striatum (I, J) and from the SVZ (K, L). These effects were totally abolished by SR-95531 (10 μm). Moreover, when applied alone, SR-95531 significantly increased the incorporation of BrdU in Tuj1/PSA-NCAM+ cells and in Tuj1+/PSA-NCAM+ cells from the striatum (I, J) and from the SVZ (K, L) (n = 2–4; ANOVA-1 followed by a Dunnett's post-test; *p < 0.05,**p < 0.01). EGF (20 ng/ml) significantly increased the incorporation of BrdU in Tuj1/PSA-NCAM+ and Tuj1+/PSA-NCAM+ cells from the striatum (I, J) and from the SVZ (K, L). In EGF-containing medium, muscimol exerted similar but less significant effects than in EGF-free conditions, and SR95531 had no effect when applied alone (n = 2–5; Student'st test; *p < 0.05, **p < 0.01).

Similar articles

Cited by

References

    1. Barker JL, Behar T, Li YX, Liu QY, Ma W, Maric D, Maric I, Schaffner AE, Serafini R, Smith SV, Somogyi R, Vautrin JY, Wen XL, Xian H. GABAergic cells and signals in CNS development. Perspect Dev Neurobiol. 1998;5:305–322. - PubMed
    1. Belachew S, Malgrange B, Rigo JM, Rogister B, Leprince P, Hans G, Nguyen L, Moonen G. Glycine triggers an intracellular calcium influx in oligodendrocyte progenitor cells which is mediated by the activation of both the ionotropic glycine receptor and Na+-dependent transporters. Eur J Neurosci. 2000;12:1924–1930. - PubMed
    1. Ben Hur T, Rogister B, Murray K, Rougon G, Dubois-Dalcq M. Growth and fate of PSA-NCAM+ precursors of the postnatal brain. J Neurosci. 1998;18:5777–5788. - PMC - PubMed
    1. Bettendorff L, Sallanon-Moulin M, Touret M, Wins P, Margineanu I, Schoffeniels E. Paradoxical sleep deprivation increases the content of glutamate and glutamine in rat cerebral cortex. Sleep. 1996;19:65–71. - PubMed
    1. Bettendorff L, Lakaye B, Margineanu I, Grisar T, Wins P. ATP-driven, NA+-independent inward Cl- pumping in neuroblastoma cells. J Neurochem. 2002;81:792–801. - PubMed

Publication types

MeSH terms