

Internal state of monkey primary visual cortex (V1) predicts figure-ground perception
- PMID: 12716948
- PMCID: PMC6742343
- DOI: 10.1523/JNEUROSCI.23-08-03407.2003
Internal state of monkey primary visual cortex (V1) predicts figure-ground perception
Abstract
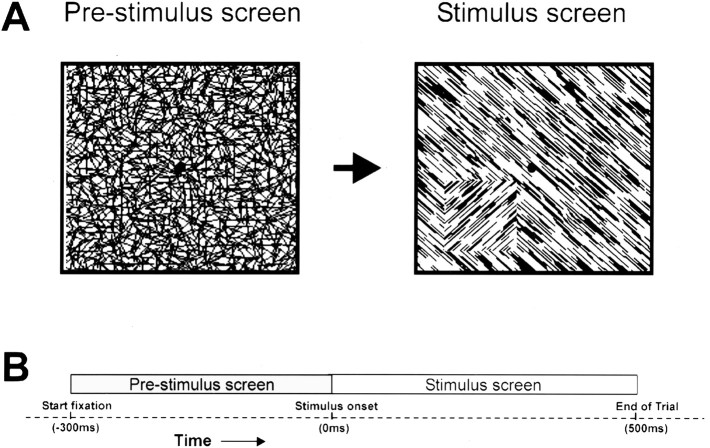
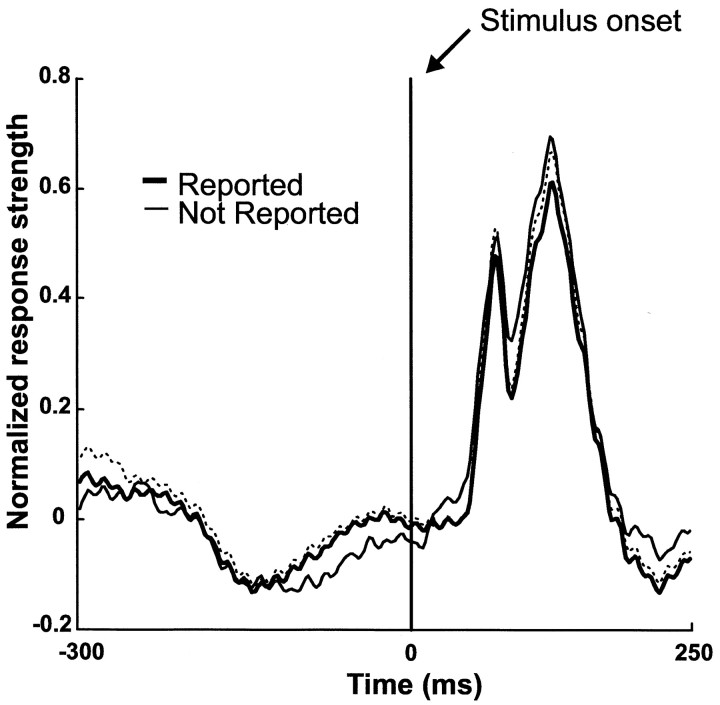
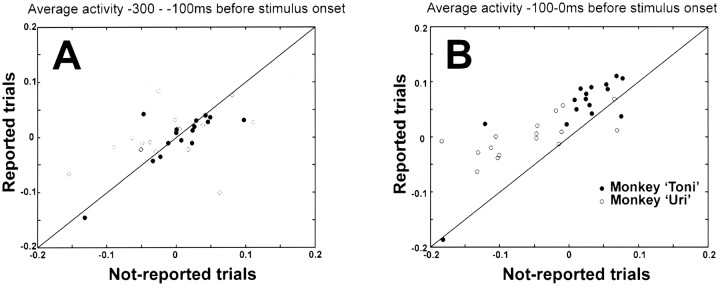
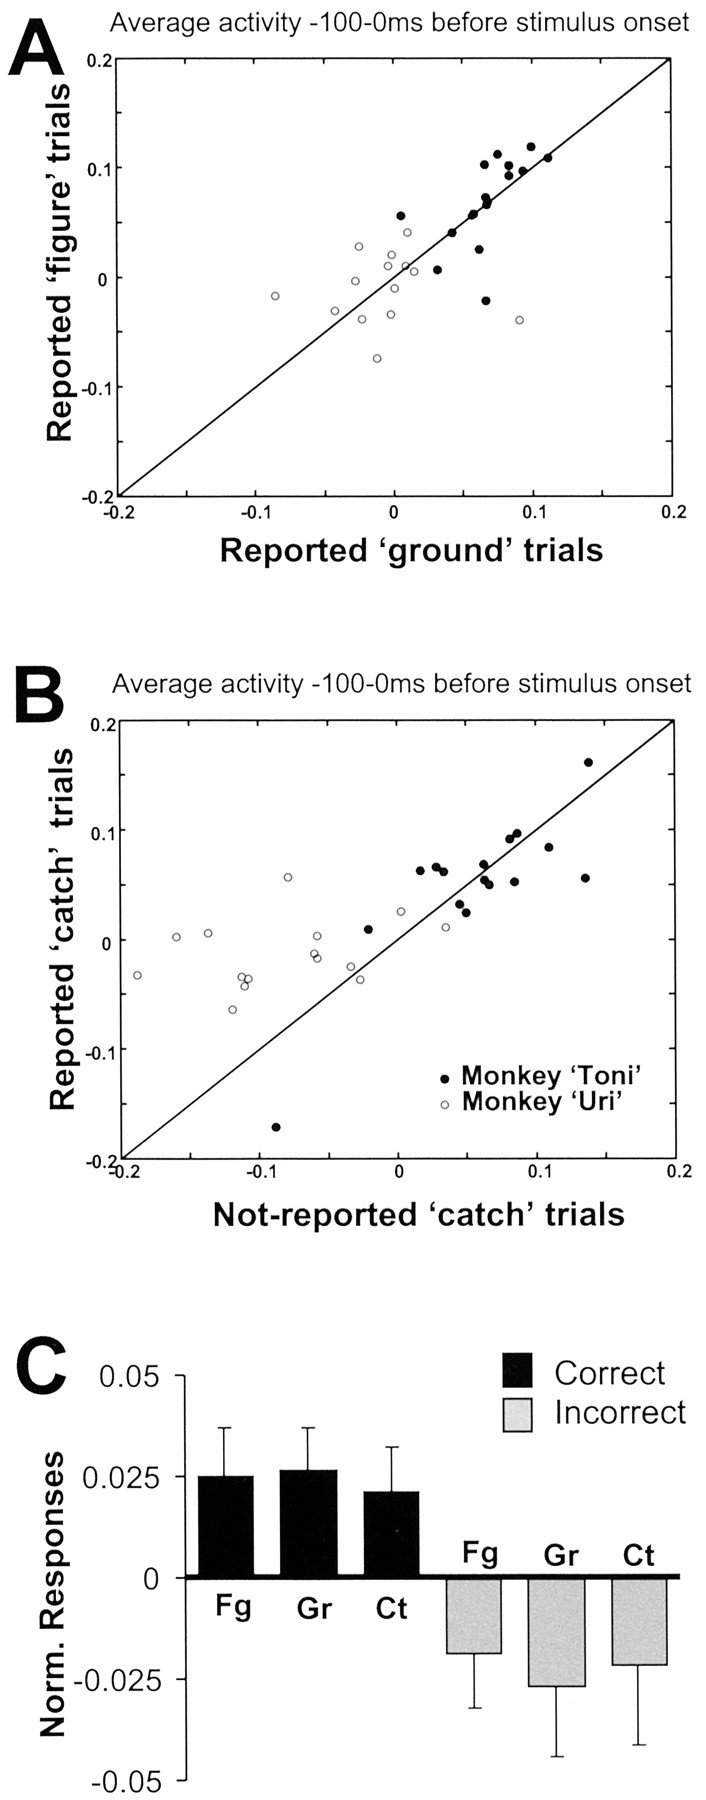
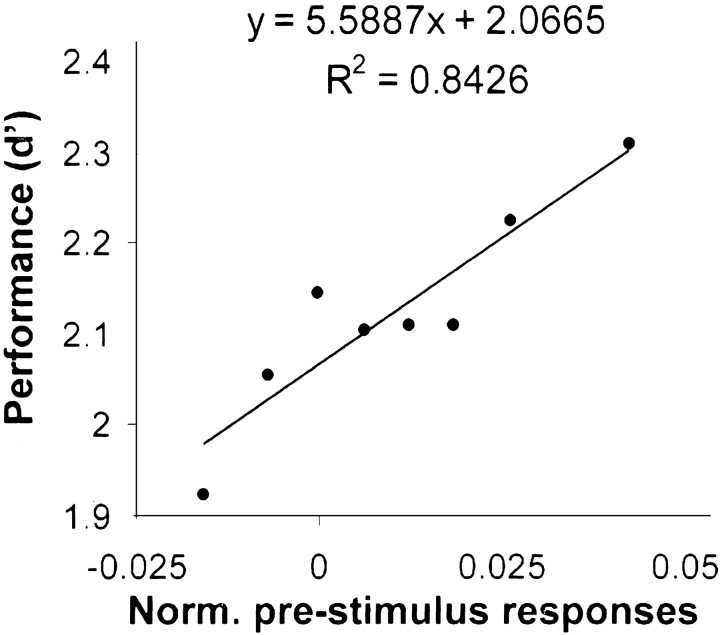
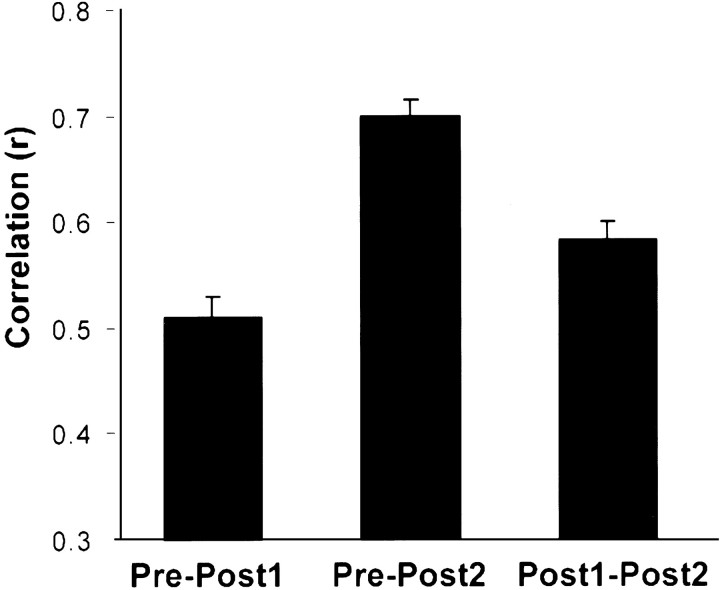
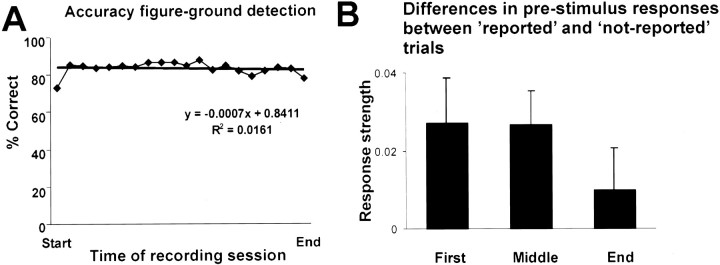
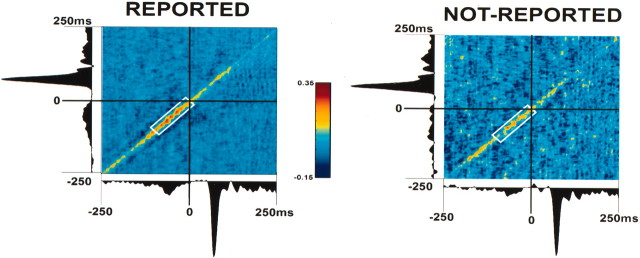
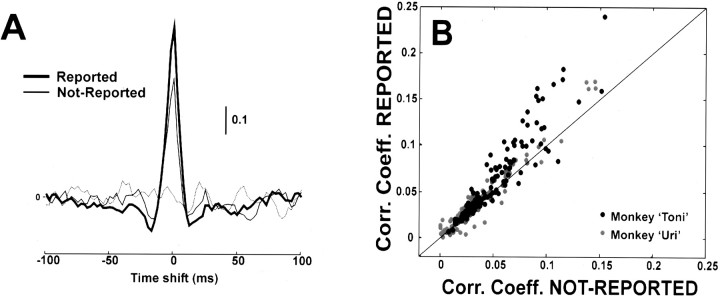
When stimulus information enters the visual cortex, it is rapidly processed for identification. However, sometimes the processing of the stimulus is inadequate and the subject fails to notice the stimulus. Human psychophysical studies show that this occurs during states of inattention or absent-mindedness. At a neurophysiological level, it remains unclear what these states are. To study the role of cortical state in perception, we analyzed neural activity in the monkey primary visual cortex before the appearance of a stimulus. We show that, before the appearance of a reported stimulus, neural activity was stronger and more correlated than for a not-reported stimulus. This indicates that the strength of neural activity and the functional connectivity between neurons in the primary visual cortex participate in the perceptual processing of stimulus information. Thus, to detect a stimulus, the visual cortex needs to be in an appropriate state.
Figures
Similar articles
-
A neural correlate of working memory in the monkey primary visual cortex.Science. 2001 Jul 6;293(5527):120-4. doi: 10.1126/science.1060496. Science. 2001. PMID: 11441187
-
Contextual modulation in primary visual cortex of macaques.J Neurosci. 2001 Mar 1;21(5):1698-709. doi: 10.1523/JNEUROSCI.21-05-01698.2001. J Neurosci. 2001. PMID: 11222659 Free PMC article.
-
Two distinct modes of sensory processing observed in monkey primary visual cortex (V1).Nat Neurosci. 2001 Mar;4(3):304-10. doi: 10.1038/85170. Nat Neurosci. 2001. PMID: 11224548
-
A physiological perspective on fixational eye movements.Vision Res. 2016 Jan;118:31-47. doi: 10.1016/j.visres.2014.12.006. Epub 2014 Dec 20. Vision Res. 2016. PMID: 25536465 Free PMC article. Review.
-
Figure-ground activity in V1 and guidance of saccadic eye movements.J Physiol Paris. 2006 Jul-Sep;100(1-3):63-9. doi: 10.1016/j.jphysparis.2006.09.002. Epub 2006 Oct 27. J Physiol Paris. 2006. PMID: 17070677 Review.
Cited by
-
Noise destroys feedback enhanced figure-ground segmentation but not feedforward figure-ground segmentation.Front Physiol. 2012 Jul 17;3:274. doi: 10.3389/fphys.2012.00274. eCollection 2012. Front Physiol. 2012. PMID: 22934028 Free PMC article.
-
Challenges for theories of consciousness: seeing or knowing, the missing ingredient and how to deal with panpsychism.Philos Trans R Soc Lond B Biol Sci. 2018 Sep 19;373(1755):20170344. doi: 10.1098/rstb.2017.0344. Philos Trans R Soc Lond B Biol Sci. 2018. PMID: 30061458 Free PMC article. Review.
-
Feedforward attentional selection in sensory cortex.Nat Commun. 2023 Sep 26;14(1):5993. doi: 10.1038/s41467-023-41745-1. Nat Commun. 2023. PMID: 37752171 Free PMC article.
-
Spontaneous Activity Patterns in Primary Visual Cortex Predispose to Visual Hallucinations.J Neurosci. 2015 Sep 16;35(37):12947-53. doi: 10.1523/JNEUROSCI.1520-15.2015. J Neurosci. 2015. PMID: 26377478 Free PMC article.
-
High baseline activity in inferior temporal cortex improves neural and behavioral discriminability during visual categorization.Front Syst Neurosci. 2014 Nov 3;8:218. doi: 10.3389/fnsys.2014.00218. eCollection 2014. Front Syst Neurosci. 2014. PMID: 25404900 Free PMC article.
References
-
- Aertsen AMHJ, Gerstein GL, Habib MK, Palm G. Dynamics of neuronal firing correlation: modulation of “effective connectivity”. J Neurophysiol. 1989;61:900–917. - PubMed
-
- Arnott SR, Pratt J, Shore DI, Alain C. Attentional set modulates visual areas: an event-related potential study of attentional capture. Brain Res Cogn Brain Res. 2001;12:383–395. - PubMed
-
- Atlas Task Force of the American Sleep Disorders Association. EEG arousals: scoring rules and examples. Sleep. 1992;15:174–184. - PubMed
-
- Bastiaansen MCM, Brunia CHM. Anticipatory attention: an event-related desynchronization approach. Int J Psychophysiol. 2001;43:91–107. - PubMed
-
- Block N. How can we find the neural correlate of consciousness? Trends Neurosci. 1996;19:456–459. - PubMed
Publication types
MeSH terms
LinkOut - more resources
Full Text Sources