Clinical Trial
. 2003 Jun 15;549(Pt 3):945-52.
doi: 10.1113/jphysiol.2003.040477. Epub 2003 Apr 25.

A phase response curve to single bright light pulses in human subjects

Collaborators, Affiliations
Clinical Trial

A phase response curve to single bright light pulses in human subjects

Sat Bir S Khalsa et al. J Physiol. .

Abstract

The circadian pacemaker is differentially sensitive to the resetting effects of retinal light exposure, depending upon the circadian phase at which the light exposure occurs. Previously reported human phase response curves (PRCs) to single bright light exposures have employed small sample sizes, and were often based on relatively imprecise estimates of circadian phase and phase resetting. In the present study, 21 healthy, entrained subjects underwent pre- and post-stimulus constant routines (CRs) in dim light (approximately 2-7 lx) with maintained wakefulness in a semi-recumbent posture. The 6.7 h bright light exposure stimulus consisted of alternating 6 min fixed gaze (approximately 10 000 lx) and free gaze (approximately 5000-9000 lx) exposures. Light exposures were scheduled across the circadian cycle in different subjects so as to derive a PRC. Plasma melatonin was used to determine the phase of the onset, offset, and midpoint of the melatonin profiles during the CRs. Phase shifts were calculated as the difference in phase between the pre- and post-stimulus CRs. The resultant PRC of the midpoint of the melatonin rhythm revealed a characteristic type 1 PRC with a significant peak-to-trough amplitude of 5.02 h. Phase delays occurred when the light stimulus was centred prior to the critical phase at the core body temperature minimum, phase advances occurred when the light stimulus was centred after the critical phase, and no phase shift occurred at the critical phase. During the subjective day, no prolonged 'dead zone' of photic insensitivity was apparent. Phase shifts derived using the melatonin onsets showed larger magnitudes than those derived from the melatonin offsets. These data provide a comprehensive characterization of the human PRC under highly controlled laboratory conditions.


Figures

Figure 1
Figure 1. A raster plot of the experimental protocol for subject 1843
Consecutive days are plotted from top to bottom. Clock time is indicated on the horizontal axis. The protocol began with three 24 h baseline days on the subject's habitual sleep–wake schedule with 16 h wake episodes in < 150 lx illumination (□) and 8 h sleep opportunities in darkness (▪). A pre-stimulus CR in dim light (< 15 lx, ▪) began on day 4 and continued until the 8 h sleep episode on day 5. The light exposure day consisted of 16 h of ambulatory wakefulness in dim light, interrupted by a seated 6.7 h bright light exposure (∼10 000 lx fixed gaze, □) centred in the middle of the wake episode. A subsequent 8 h scheduled sleep episode was followed by a post-stimulus CR and a recovery sleep episode. The timing of the melatonin midpoints for evaluation of the phase shift is indicated by ▵. For this subject, the light exposure generated a phase delay of −3.60 h in the melatonin midpoint..
Figure 3
Figure 3. The PRC to the bright light stimulus using melatonin midpoints as the circadian phase marker
Phase advances (positive values) and delays (negative values) are plotted against the timing of the centre of the light exposure relative to the melatonin midpoint on the pre-stimulus CR (defined to be 22 h), with the core body temperature minimum assumed to occur 2 h later at 0 h. Data points from circadian phases 6–18 are double plotted. The filled circles represent data from plasma melatonin, and the open circle represents data from salivary melatonin in subject 18K8 from whom blood samples were not acquired. The solid curve is a dual harmonic function fitted through all of the data points. The horizontal dashed line represents the anticipated 0.54 h average delay drift of the pacemaker between the pre- and post-stimulus phase assessments.
Figure 2
Figure 2. The melatonin profile from the pre-stimulus to the post-stimulus CRs
Plasma melatonin on the vertical axis is plotted against local time on the horizontal axis for subject 1843 in Fig. 1. The protocol procedure is indicated on the bar at the top of the figure. The 25 % threshold (89.5 pmol l−1, dotted horizontal line) of the peak amplitude of the fitted 3-harmonic curve from the pre-stimulus CR was used to calculate the pre- and post-stimulus DLMOn and DLMOff values (⋄). The midpoints between DLMOn and DLMOff used to calculate the light-induced phase delay for this subject (04:45 h to 08:21 h = −3.60 h) are indicated by the vertical dotted lines. Note suppression of the second melatonin peak in the figure during the light exposure.
Figure 4
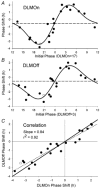
Figure 4. Comparison of the PRCs using melatonin onset (DLMOn) and offset (DLMOff)
A and B, PRCs plotted as in Fig. 3, except that all values are single plotted. The horizontal dashed line represents the anticipated 0.54 h average delay drift of the pacemaker between the pre- and post-stimulus phase assessments. The fitted peak-to-trough amplitude of the DLMOn PRC (5.41 h) appears slightly larger than that of the DLMOff PRC (4.60 h). C, correlation between the DLMOn and DLMOff phase shifts. The continuous line with a slope of unity represents identical phase shifts between the two phase markers. The dotted line is the linear regression through the data points with a slope (0.84) significantly less than unity (P < 0.05). This indicates that both phase advances and phase delays determined using DLMOff tend to be smaller than those determined using DLMOn.

Similar articles

Cited by

References

    1. Aschoff J, Wever R. The circadian system of man. In: Aschoff J, editor. Biological Rhythms: Handbook of Behavioral Neurobiology. New York: Plenum Press; 1981. pp. 311–331.
    1. Beersma DG, Daan S. Strong or weak phase resetting by light pulses in humans? J Biol Rhythms. 1993;8:340–347. - PubMed
    1. Buresová M, Dvoráková M, Zvolsky P, Illnerová H. Early morning bright light phase advances the human circadian pacemaker within one day. Neurosci Lett. 1991;121:47–50. - PubMed
    1. Cagnacci A, Soldani R, Yen SSC. Contemporaneous melatonin administration modifies the circadian response to nocturnal bright light stimuli. Am J Physiol. 1997;272:R482–486. - PubMed
    1. Czeisler CA. The effect of light on the human circadian pacemaker. In: Waterhouse JM, editor. Circadian Clocks and their Adjustment. Chichester: John Wiley and Sons, Inc.; 1995. pp. 254–302. Ciba Foundation Symposium no. 183.

Publication types

LinkOut - more resources