. 2003 May;12(5):903-13.
doi: 10.1110/ps.0235703.

Roles of conformational stability and colloidal stability in the aggregation of recombinant human granulocyte colony-stimulating factor

Affiliations

Roles of conformational stability and colloidal stability in the aggregation of recombinant human granulocyte colony-stimulating factor

Eva Y Chi et al. Protein Sci. 2003 May.

Abstract

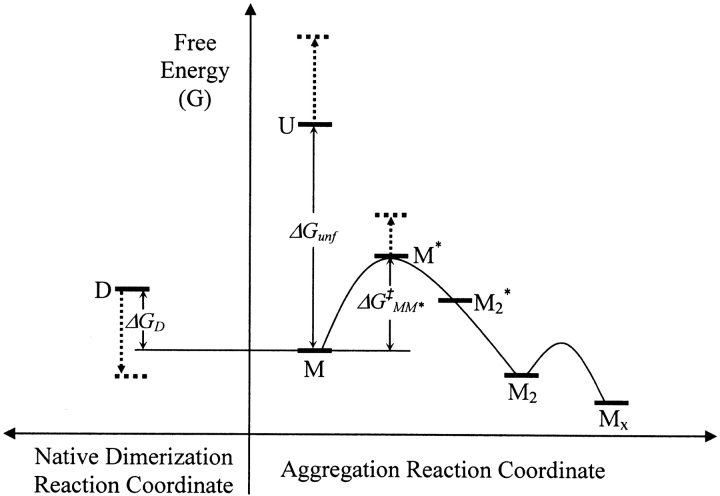
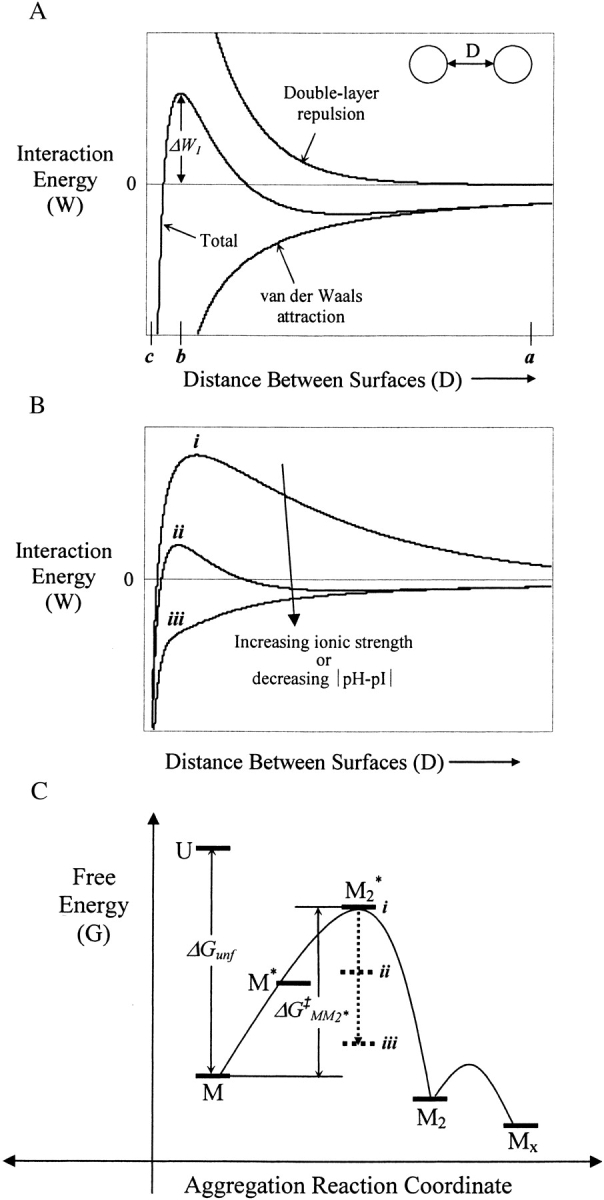
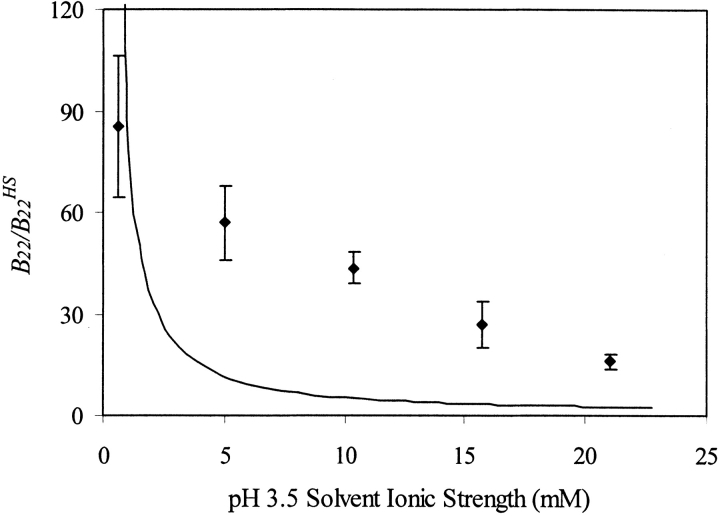
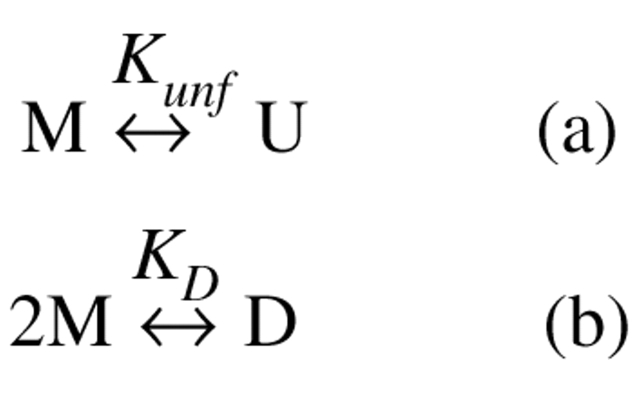
We studied the non-native aggregation of recombinant human granulocyte stimulating factor (rhGCSF) in solution conditions where native rhGCSF is both conformationally stable compared to its unfolded state and at concentrations well below its solubility limit. Aggregation of rhGCSF first involves the perturbation of its native structure to form a structurally expanded transition state, followed by assembly process to form an irreversible aggregate. The energy barriers of the two steps are reflected in the experimentally measured values of free energy of unfolding (DeltaG(unf)) and osmotic second virial coefficient (B(22)), respectively. Under solution conditions where rhGCSF conformational stability dominates (i.e., large DeltaG(unf) and negative B(22)), the first step is rate-limiting, and increasing DeltaG(unf) (e.g., by the addition of sucrose) decreases aggregation. In solutions where colloidal stability is high (i.e., large and positive B(22) values) the second step is rate-limiting, and solution conditions (e.g., low pH and low ionic strength) that increase repulsive interactions between protein molecules are effective at reducing aggregation. rhGCSF aggregation is thus controlled by both conformational stability and colloidal stability, and depending on the solution conditions, either could be rate-limiting.


Figures

Figure 1.
Figure 1.
Structural changes of rhGCSF accompanying aggregation during incubation at 37°C. Area normalized second derivative FTIR spectra of native rhGCSF (solid line, pH 3.5 HCl with 150 mM NaCl; dashed line, pH 7 PBS) show predominantly α-helical structures and aggregated rhGCSF (dotted line, pH 3.5 HCl with 150 mM NaCl; dashed and dotted line, pH 7 PBS) exhibit high levels of intermolecular β-sheet structures. Spectra of soluble and aggregated rhGCSF in pH 7 PBS were taken from Krishnan et al. 2002.
Figure 2.
Figure 2.
B22/B22HS values (A) and extrapolated mass averaged molecular weights (B) of rhGCSF from static light scattering experiments in pH 7 PBS at various sucrose concentrations. Concomitant with the large increase in B22/B22HS when 0.25 M or more sucrose was added, the apparent rhGCSF molecular weight was higher, indicating the presence of multimeric species. Extrapolated molecular weights for these samples correspond to 40–60 mole % dimers. Thus, B22/B22HS values measured in these solutions reflect overall two-body interactions, not just from aggregating monomeric species.
Figure 3.
Figure 3.
Schematic reaction profile for the aggregation of rhGCSF in pH 7 PBS on an arbitrary free energy y-axis. Curved lines illustrate kinetic energy barriers. M* is a structurally expanded transition state species and ΔGMM* is the activation free energy of aggregation. The initial rate of irreversible dimer (M2) formation is second order in native state monomer (M) concentration. Dotted arrows illustrate, relative to M, shifts in the free energies of native dimers (D), unfolded monomer (U), and M* when sucrose is added. The off-path reaction that generates D is depicted to the left of the aggregation reaction coordinate.
Figure 4.
Figure 4.
Schematic DLVO interaction energy of two spherical particles interacting at constant and uniform surface potential. (A) Total interaction energy is the sum of electric double-layer repulsion (∝ e−κD, where κ is the inverse Debye length) and van der Waals attraction (1/6 D; Israelachvili 1992). ΔW1 represents the maximum interaction energy barrier of the two particles. (B) Increasing salt concentration screens double layer repulsion, resulting in a decrease of ΔW1. When ΔW1 < 0 (curve iii), particles become unstable and coagulation occurs. Decreases in ΔW1 could also be resulted by decreasing the absolute value of the difference between solution pH and the isoelectric point of a protein. (C) Schematic reaction profile for the aggregation of rhGCSF in pH 3.5 HCl on an arbitrary free energy y-axis. Curved lines illustrate kinetic energy barriers. M2* is the dimeric transition state species and ΔGMM2* is the activation free energy of aggregation. Dotted arrows illustrate that increases in solution ionic strength (or decreases in |pH-pI|) decrease ΔGMM2*. At low ionic strength (i), ΔW1 is large and positive, resulting in a high ΔGMM2*. Increasing ionic strength sufficiently led to a negative ΔW1 (iii), lowering ΔGMM2* enough that M2* is no longer the transition state of the aggregation reactions. At high ionic strength, M* is expected to be the transition state of aggregation.
Figure 5.
Figure 5.
Comparison between experimental and theoretical B22/B22HS of rhGCSF at pH 3.5 as a function of ionic strength. Degree of acetic acid ionization was accounted for in calculating the ionic strength of sodium acetate buffers. Error bars on experimental B22/B22HS (filled diamond) are linear regression standard errors of SLS data using equation 2. Theoretical B22/B22HS (solid line) was calculated taking into account excluded volume and Coulombic charge–charge repulsion treating proteins as point charges (Petsev et al. 2000).
Scheme 1:
Scheme 1:
Aggregation pathway
Scheme 2:
Scheme 2:
Equilibrium reactions

Similar articles

Cited by

References

    1. Atkins, P. 1994. Physical chemistry, 5th ed., p. 1031. W.H. Freeman and Company, New York.
    1. B.I. Corporation. 1993. Instrument manual for BI-ZP software, version 4.0 & higher and BI-9025AT & BI-2025AT signal processors, version 1.1.b. Holtsville, NY.
    1. Chang, R.C., Asthagiri, D., and Lenhoff, A.M. 2000. Measured and calculated effects of mutations in bacteriophage T4 lysozyme on interactions in solution. Proteins 41 123–132. - PubMed
    1. Dong, A.C., Meyer, J.D., Brown, J.L., Manning, M.C., and Carpenter, J.F. 2000. Comparative Fourier transform infrared and circular dichroism spectroscopic analysis of α(1)-proteinase inhibitor and ovalbumin in aqueous solution. Arch. Biochem. Biophys. 383 148–155. - PubMed
    1. Farnum, M. and Zukoski, C. 1999. Effect of glycerol on the interactions and solubility of bovine pancreatic trypsin inhibitor. Biophys. J. 76 2716–2726. - PMC - PubMed

Publication types

LinkOut - more resources