. 2003 May;5(5):440-6.
doi: 10.1038/ncb980.

Regulation of calcium signals in the nucleus by a nucleoplasmic reticulum

Affiliations

Regulation of calcium signals in the nucleus by a nucleoplasmic reticulum

Wihelma Echevarría et al. Nat Cell Biol. 2003 May.

Abstract

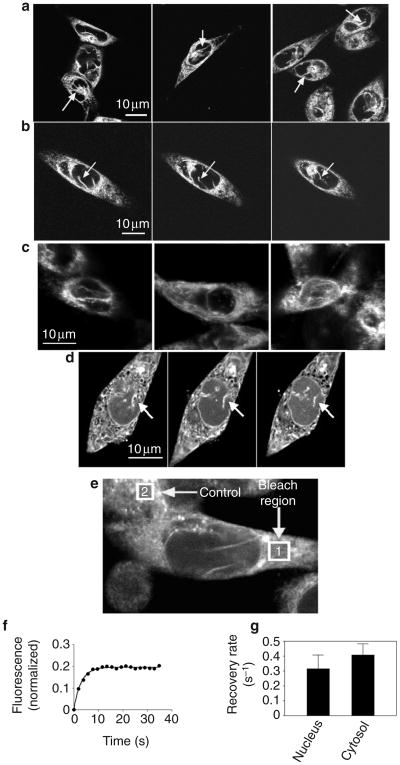
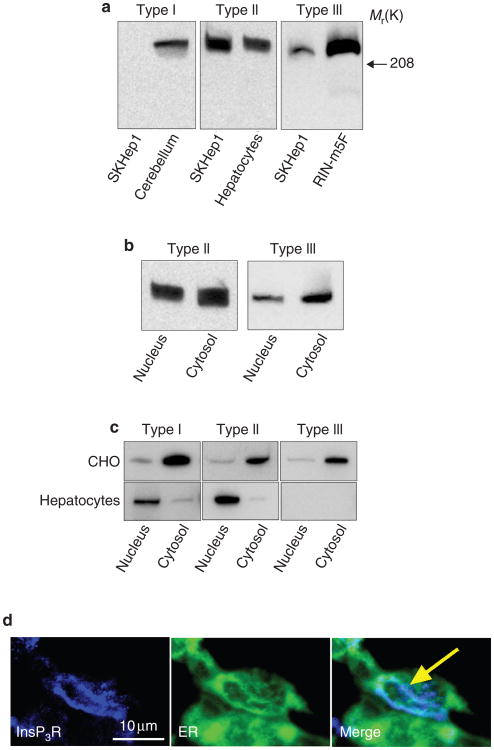
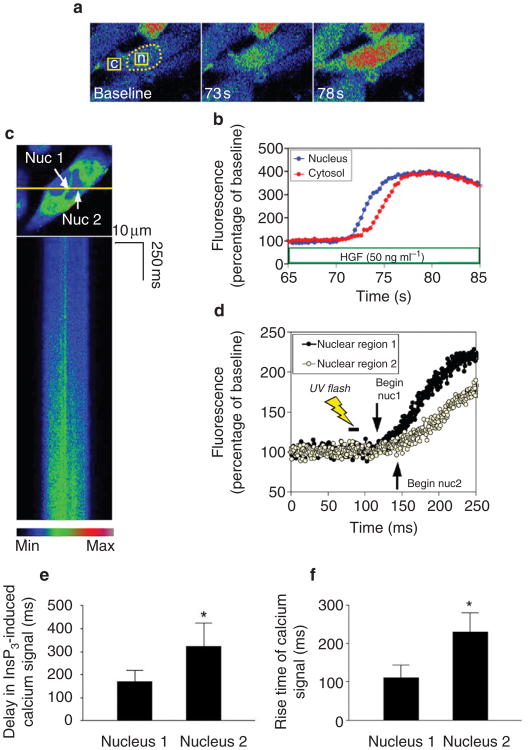
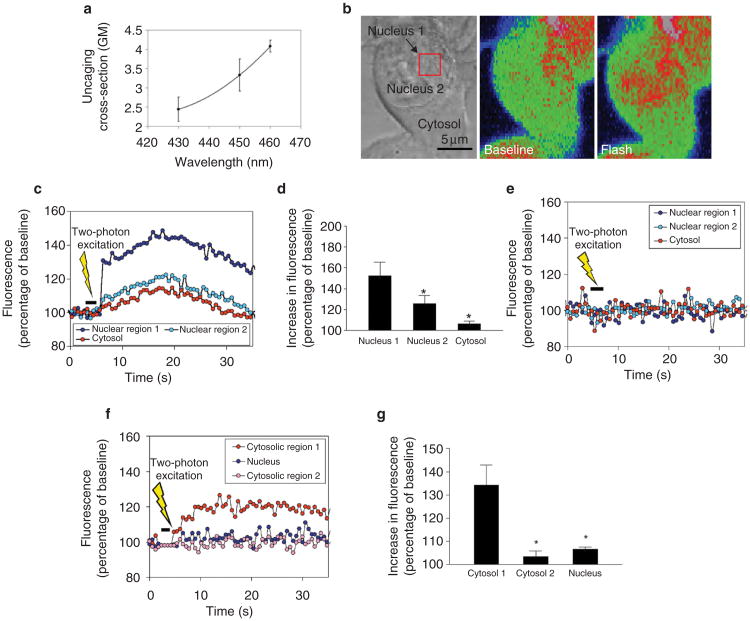
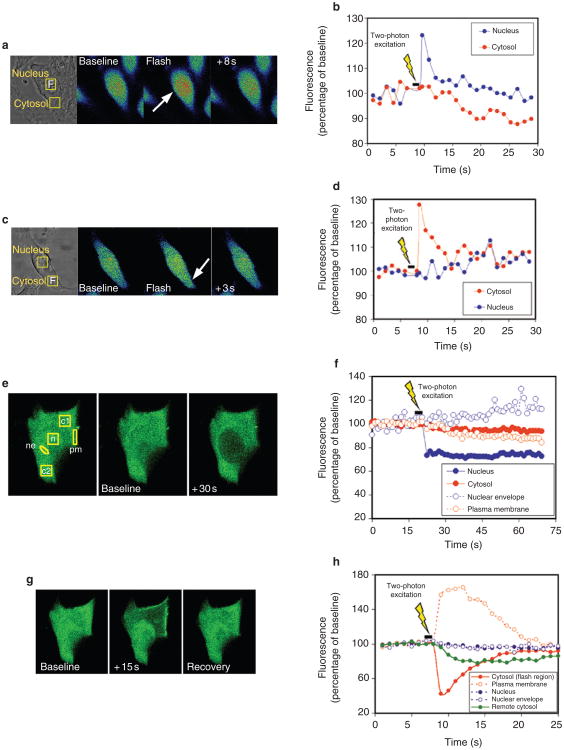
Calcium is a second messenger in virtually all cells and tissues. Calcium signals in the nucleus have effects on gene transcription and cell growth that are distinct from those of cytosolic calcium signals; however, it is unknown how nuclear calcium signals are regulated. Here we identify a reticular network of nuclear calcium stores that is continuous with the endoplasmic reticulum and the nuclear envelope. This network expresses inositol 1,4,5-trisphosphate (InsP3) receptors, and the nuclear component of InsP3-mediated calcium signals begins in its locality. Stimulation of these receptors with a little InsP3 results in small calcium signals that are initiated in this region of the nucleus. Localized release of calcium in the nucleus causes nuclear protein kinase C (PKC) to translocate to the region of the nuclear envelope, whereas release of calcium in the cytosol induces translocation of cytosolic PKC to the plasma membrane. Our findings show that the nucleus contains a nucleoplasmic reticulum with the capacity to regulate calcium signals in localized subnuclear regions. The presence of such machinery provides a potential mechanism by which calcium can simultaneously regulate many independent processes in the nucleus.


Figures

Figure 1
Figure 1. The nucleus of SKHep1 cells contains a nucleoplasmic reticulum
a, Different fields of SKHep1 cells labelled with the dye ER-Tracker and visualized by two-photon microscopy show the presence of reticular structures in the nucleus (arrows). b, Serial focal planes of a single cell show one of these reticular structures traversing the nucleus (arrows). c, Confocal immunofluorescence images of three different SKHep1 cells labelled with antibodies against calreticulin show the presence of reticular structures in the nucleus. d, Serial focal planes of an SKHep1 cell labelled with the calcium dye fluo-4/AM and visualized by confocal microscopy show that the nucleoplasmic reticulum (arrows) stores calcium. The nucleoplasmic reticulum can be followed from the ER and nuclear envelope into the nuclear interior. e, FRAP was used to examine the kinetics of refilling of mag-fluo-4 in the ER and the nucleoplasmic reticulum. The fluorescence of a bleach region (1) in the ER of a cell is monitored over time and is normalized to the fluorescence of a control region (2) in a nearby cell that is not photobleached. f, FRAP of the bleached region is closely described by a mono-exponential decay equation. Data points and the corresponding non-linear regression curve for a representative experiment are shown. g, Rate constants are similar for FRAP regions in the nucleus and the cytosol (P > 0.45).
Figure 2
Figure 2. SKHep1 cells express InsP3 receptors in the nucleoplasmic reticulum
a, Membranes extracted from SKHep1 whole-cell lysates and probed with antibodies specific for the InsP3 receptor isoforms show expression of type II and III receptors but not the type I receptor. Positive controls were rat cerebellum (type I receptor), rat hepatocytes (type II) and RIN-m5F cells (type III). b, Nuclear and cytosolic cell fractions probed with antibodies against the type II and type III InsP3 receptors show that each compartment expresses both isoforms. c, Nuclear and cytosolic fractions of CHO cells and hepatocytes probed with antibodies specific for the InsP3 receptor isoforms show cell-to-cell differences in the relative distribution of each isoform in the nucleus and the cytosol. d, Confocal immunofluorescence shows that the type II InsP3 receptor is expressed in both the cytosol and the nucleus of SKHep1 cells, and that it is distributed along the nucleoplasmic reticulum in the nucleus (arrow). The InsP3 receptor was labelled with the same antibodies used for immunoblots. The ER and its nuclear extensions were labelled with the calreticulin antibody used in Fig. 1. No InsP3 receptor labelling was observed in negative controls labelled with secondary antibody alone (not shown).
Figure 3
Figure 3. Nuclear calcium signals begin in the nucleoplasmic reticulum
a, Serial confocal images of an SKHep1 cell stimulated with HGF. Broken line delineates the nucleus; fluorescence was monitored in the nuclear and cytosolic regions of interest indicated by the squares in the left panel. Fluorescence increases first in the nucleus (73 s) and then in the cytosol (78 s). All calcium images are pseudocoloured according to the scale in c. b, Representation of the fluorescence increases in the nuclear and cytosolic regions indicated in a. The nuclear increase in calcium precedes the cytosolic increase. c, High-speed confocal line scanning microscopy in an SKHep1 cell labelled with fluo-4/AM. The nucleus is examined while microinjected NPE-caged InsP3 is released by ultraviolet flash photolysis. Top, the cell and the line used for line scanning (yellow); bottom, the line scan collected as InsP3 is uncaged. The calcium signal in the nucleoplasm begins near the area of the nucleoplasmic reticulum (nuc1) and then spreads to the rest of the nucleoplasm (nuc2). d, Representation of the fluorescence increases in the line scan. The increase in calcium begins in the region of the nucleoplasmic reticulum (nuclear region 1) and then spreads to more distant regions in the nucleoplasm (nuclear region 2). e, Calcium signals in the nucleus begin sooner in the region of the nucleoplasmic reticulum. The latency period between photorelease of InsP3 and the onset of nuclear calcium signalling was shorter in the region of the nucleoplasmic reticulum (*P < 0.05, n = 10). f, Calcium signals in the nucleus rise more quickly in the region of the nucleoplasmic reticulum. The time required for signals to increase from 25% to 75% of their maximum value was shorter in the region of the nucleoplasmic reticulum (*P < 0.002, n = 10).
Figure 4
Figure 4. The nucleoplasmic reticulum provides localized release of calcium
a, Optimal conditions for two-photon photorelease of NPE-caged compounds. The effective two-photon uncaging cross-section of the NPE caging group was measured using NPE-ATP and was maximal at 460 nm. b, Localized two-photon flash photolysis of caged InsP3 in the nucleus. Left, arrow indicates the cell injected with NPE-InsP3; the red square indicates the intranuclear region subjected to two-photon flash photolysis. Middle, pseudocoloured image of the injected cell before two-photon excitation. Right, two-photon photorelease of InsP3 increases calcium predominantly in the nucleus. Although spatial resolution is decreased in the pseudocolour images to maximize collection speed, distinct regions in the nucleus and cytosol can be distinguished. c, Representation of calcium signalling during localized intranuclear photorelease of InsP3. The increase in calcium begins in the region of the nucleoplasmic reticulum (nucleus 1), before spreading throughout the nucleus (nucleus 2) and into the cytosol. The increase in calcium is much smaller and slower in onset than when InsP3 is uncaged throughout the cell (see Fig. 3d). d, Summary of intranuclear uncaging experiments. The main increase in calcium occurs in the region of uncaging near the nucleoplasmic reticulum (nucleus 1). A smaller increase is detected elsewhere in the nucleus (nucleus 2), and a minimal calcium signal is detected in the cytosol. Data are the mean ± s.e.m of six experiments (*P < 0.001 by repeated measures analysis of variance; ANOVA). e, Two-photon excitation in sham-injected cells does not increase calcium. Results are representative of those seen in ten separate cells. f, Localized two-photon uncaging of InsP3 in the cytosol results in localized puffs of cytosolic calcium. An increase in calcium is detected in the region of uncaging (cytosol 1), but no significant increase is detected elsewhere in the cytosol (cytosol 2) or in the nucleus. g, Summary of cytosolic uncaging experiments. The main increase in calcium occurs in the region of uncaging in the cytosol (cytosol 1). A minimal increase is detected elsewhere in the cytosol (cytosol 2) and in the nucleus. Data are the mean ± s.e.m of six experiments (*P < 0.0005 by repeated measures ANOVA).
Figure 5
Figure 5. Nuclear and cytosolic calcium have distinct effects on PKC translocation
a, Localized uncaging of calcium in the nucleus of an SKHep1 cell using two-photon flash photolysis. Transmission image shows the rectangular regions in the nucleus and cytosol where calcium was monitored. Two-photon flash photolysis (F) was restricted to a volume of ∼40 fl (<1% of the total cell volume). Serial confocal images show that photorelease of calcium causes a transient increase in calcium that is restricted to the nucleus. b, Representation of a shows the transient increase in calcium in the nucleus but not the cytosol. Data are representative of 17 cells. c, Localized uncaging of calcium in the cytosol of an SKHep1 cell using two-photon flash photolysis as in a. The photorelease of calcium causes a transient increase in calcium that is restricted to the cytosol. d, Representation of c shows the transient increase in calcium in the cytosol but not the nucleus. Data are representative of 12 cells. e, Localized uncaging of calcium in the nucleus of an SKHep1 cell causes translocation of GFP–PKC-γ to the region of the nuclear envelope. Left, GFP–PKC-γ fluorescence (green) is distributed uniformly throughout the nucleus and cytosol before stimulation. The experimental regions of interest are labelled as follows: nucleus (n), nuclear envelope (ne), cytosolic region 1 (c1), cytosolic region 2 (c2), plasma membrane (pm). Middle and right, photorelease of calcium in the rectangular region in the nucleus shifts GFP fluorescence from the nuclear interior to the region of the nuclear envelope. f, Representation of e shows that two-photon uncaging of calcium in the nucleus causes a rapid decrease in nuclear GFP fluorescence plus an associated increase near the nuclear envelope. No change in fluorescence is detected in the cytosol or at the plasma membrane. Data are representative of eight experiments. g, Localized uncaging of calcium in region c1 of the cytosol causes translocation of GFP–PKCγ to the nearby portion of the plasma membrane. h, Representation of g shows that two-photon uncaging of calcium in cytosolic region 1 causes a rapid decrease in GFP fluorescence in that region plus an associated increase near the plasma membrane. A more gradual decrease in fluorescence occurs elsewhere in the cytosol (cytosolic region 2). No change in fluorescence is detected in the nucleus or in the region of the nuclear envelope. Data are representative of five experiments.

Comment in

  • Calcium is good for the nucleus.
    Thevananther S, Karpen SJ. Thevananther S, et al. J Hepatol. 2004 Apr;40(4):720-2. doi: 10.1016/j.jhep.2004.02.012. J Hepatol. 2004. PMID: 15030997 No abstract available.

References

    1. Berridge MJ, Lipp P, Bootman MD. The versatility and universality of calcium signalling. Nature Rev Mol Cell Biol. 2000;1:11–21. - PubMed
    1. Pinton P, Pozzan T, Rizzuto R. The Golgi apparatus is an inositol 1,4,5-trisphosphate-sensitive Ca2+ store, with functional properties distinct from those of the endoplasmic reticulum. EMBO J. 1998;17:5298–5308. - PMC - PubMed
    1. Jouaville LS, Ichas F, Holmuhamedov EL, Camacho P, Lechleiter JD. Synchronization of calcium waves by mitochondrial substrates in Xenopus laevis oocytes. Nature. 1995;377:438–441. - PubMed
    1. Stehno-Bittel L, Perez-Terzic C, Clapham DE. Diffusion across the nuclear envelope inhibited by depletion of the nuclear Ca2+ store. Science. 1995;270:1835–1838. - PubMed
    1. Perez-Terzic C, Pyle J, Jaconi M, Stehno-Bittel L, Clapham DE. Conformational states of the nuclear pore complex induced by depletion of nuclear Ca2+ stores. Science. 1996;273:1875–1877. - PubMed

Publication types

MeSH terms