

Feedback regulation in the lactose operon: a mathematical modeling study and comparison with experimental data
- PMID: 12719218
- PMCID: PMC1302849
- DOI: 10.1016/S0006-3495(03)70013-7
Feedback regulation in the lactose operon: a mathematical modeling study and comparison with experimental data
Erratum in
- Biophys J. 2007 Jan 15;92(2):699
Abstract
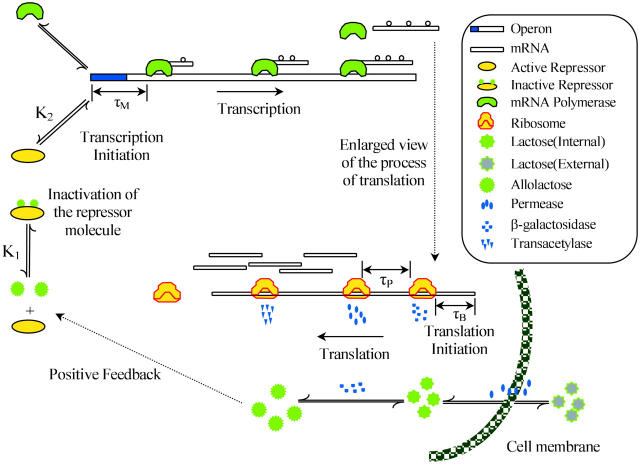
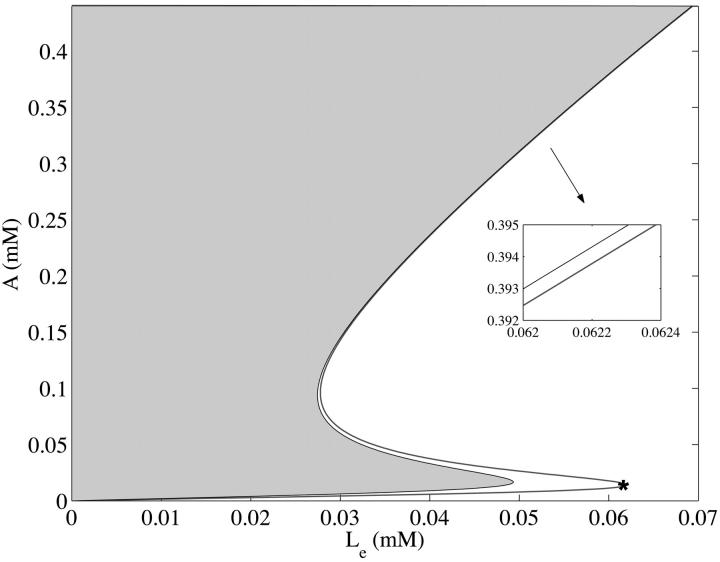
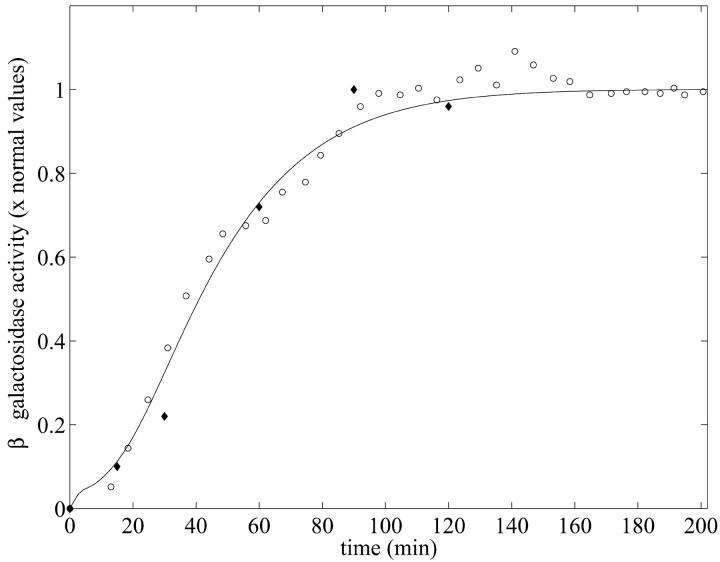
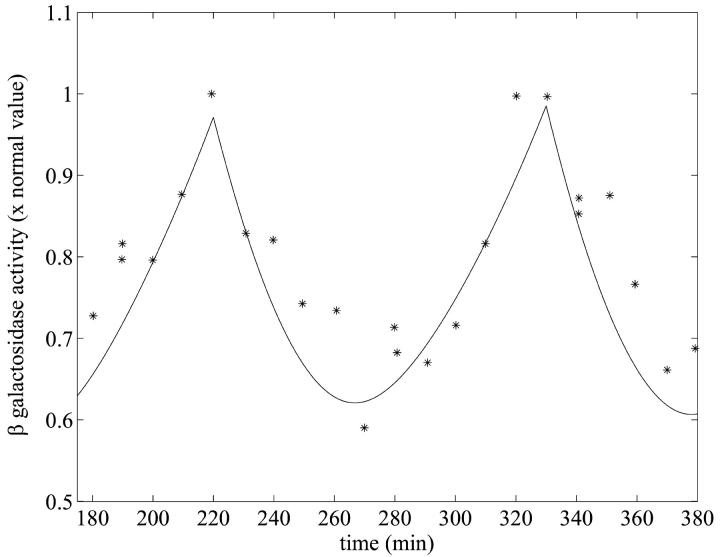
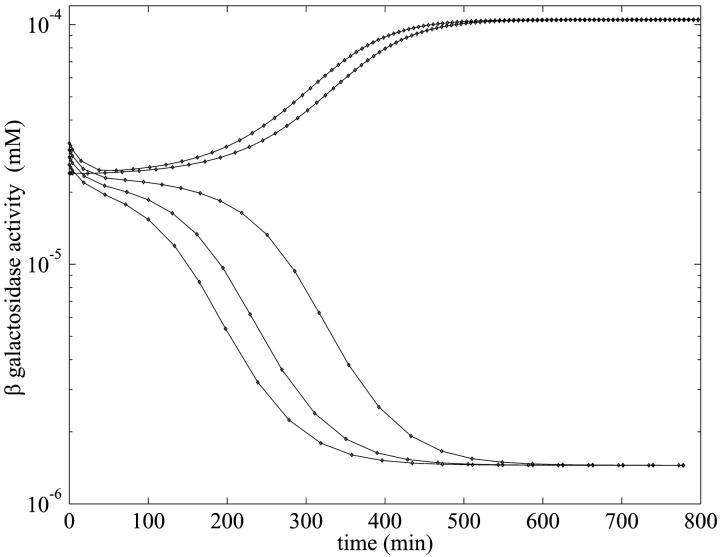
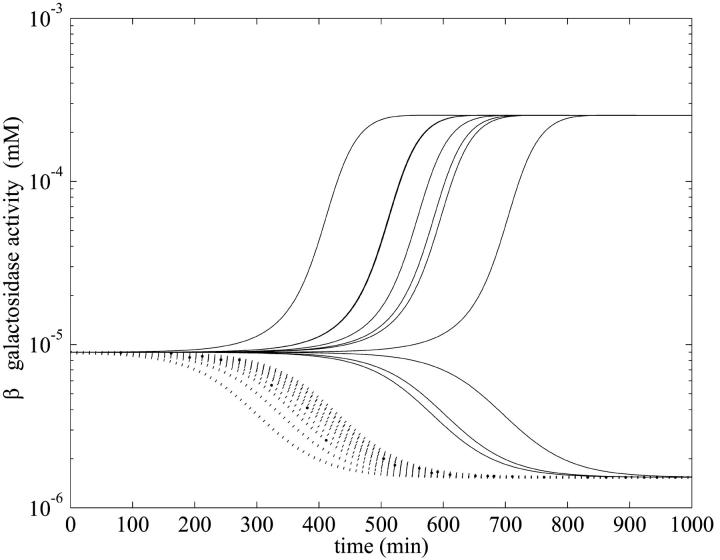
A mathematical model for the regulation of induction in the lac operon in Escherichia coli is presented. This model takes into account the dynamics of the permease facilitating the internalization of external lactose; internal lactose; beta-galactosidase, which is involved in the conversion of lactose to allolactose, glucose and galactose; the allolactose interactions with the lac repressor; and mRNA. The final model consists of five nonlinear differential delay equations with delays due to the transcription and translation process. We have paid particular attention to the estimation of the parameters in the model. We have tested our model against two sets of beta-galactosidase activity versus time data, as well as a set of data on beta-galactosidase activity during periodic phosphate feeding. In all three cases we find excellent agreement between the data and the model predictions. Analytical and numerical studies also indicate that for physiologically realistic values of the external lactose and the bacterial growth rate, a regime exists where there may be bistable steady-state behavior, and that this corresponds to a cusp bifurcation in the model dynamics.
Figures
Similar articles
-
Dynamics and bistability in a reduced model of the lac operon.Chaos. 2004 Jun;14(2):279-92. doi: 10.1063/1.1689451. Chaos. 2004. PMID: 15189056
-
Influence of catabolite repression and inducer exclusion on the bistable behavior of the lac operon.Biophys J. 2004 Mar;86(3):1282-92. doi: 10.1016/S0006-3495(04)74202-2. Biophys J. 2004. PMID: 14990461 Free PMC article.
-
Determinants of bistability in induction of the Escherichia coli lac operon.IET Syst Biol. 2008 Sep;2(5):293-303. doi: 10.1049/iet-syb:20080095. IET Syst Biol. 2008. PMID: 19045824
-
Modeling network dynamics: the lac operon, a case study.J Cell Biol. 2003 May 12;161(3):471-6. doi: 10.1083/jcb.200301125. J Cell Biol. 2003. PMID: 12743100 Free PMC article. Review.
-
[Synthesis of recombinant proteins under the control of regulatory elements of Lac operon].Antibiot Khimioter. 1991 Dec;36(12):27-33. Antibiot Khimioter. 1991. PMID: 1814271 Review. Russian. No abstract available.
Cited by
-
Quantitative approaches to the study of bistability in the lac operon of Escherichia coli.J R Soc Interface. 2008 Aug 6;5 Suppl 1(Suppl 1):S29-39. doi: 10.1098/rsif.2008.0086.focus. J R Soc Interface. 2008. PMID: 18426771 Free PMC article. Review.
-
Modular cell biology: retroactivity and insulation.Mol Syst Biol. 2008;4:161. doi: 10.1038/msb4100204. Epub 2008 Feb 12. Mol Syst Biol. 2008. PMID: 18277378 Free PMC article.
-
The utility of simple mathematical models in understanding gene regulatory dynamics.In Silico Biol. 2015;12(1-2):23-53. doi: 10.3233/ISB-140463. In Silico Biol. 2015. PMID: 25402755 Free PMC article. Review.
-
Driving Cells to the Desired State in a Bimodal Distribution through Manipulation of Internal Noise with Biologically Practicable Approaches.PLoS One. 2016 Dec 2;11(12):e0167563. doi: 10.1371/journal.pone.0167563. eCollection 2016. PLoS One. 2016. PMID: 27911933 Free PMC article.
-
Stochastic parameter search for events.BMC Syst Biol. 2014 Nov 8;8:126. doi: 10.1186/s12918-014-0126-y. BMC Syst Biol. 2014. PMID: 25380984 Free PMC article.
References
-
- Baneyx, F. 1999. Recombinant protein expression in Escherichia coli. Curr. Opin. Biotechnol. 10:411–421. - PubMed
-
- Beckwith, J. 1987a. The lactose operon. In Escherichia coli and Salmonella: Cellular and Molecular Biology, Vol. 2. F. C. Neidhardt, J. L. Ingraham, K. B. Low, B. Magasanik, and H. E. Umbarger, editors. American Society for Microbiology, Washington, DC. 1444–1452.
-
- Beckwith, J. 1987b. The operon: An historical account. In Escherichia coli and Salmonella: Cellular and Molecular Biology, Vol. 2. F. C. Neidhardt, J. L. Ingraham, K. B. Low, B. Magasanik, and H. E. Umbarger, editors. American Society for Microbiology, Washington, DC. 1439–1443.
-
- Bliss, R. D., R. P. Painter, and A. G. Marr. 1982. Role of feedback inhibition in stabilizing the classical operon. J. Theor. Biol. 97:177–193. - PubMed
Publication types
MeSH terms
Substances
LinkOut - more resources
Full Text Sources
Other Literature Sources
Molecular Biology Databases
