

The Ca2+ dynamics of isolated mouse beta-cells and islets: implications for mathematical models
- PMID: 12719219
- PMCID: PMC1302850
- DOI: 10.1016/S0006-3495(03)70014-9
The Ca2+ dynamics of isolated mouse beta-cells and islets: implications for mathematical models
Abstract
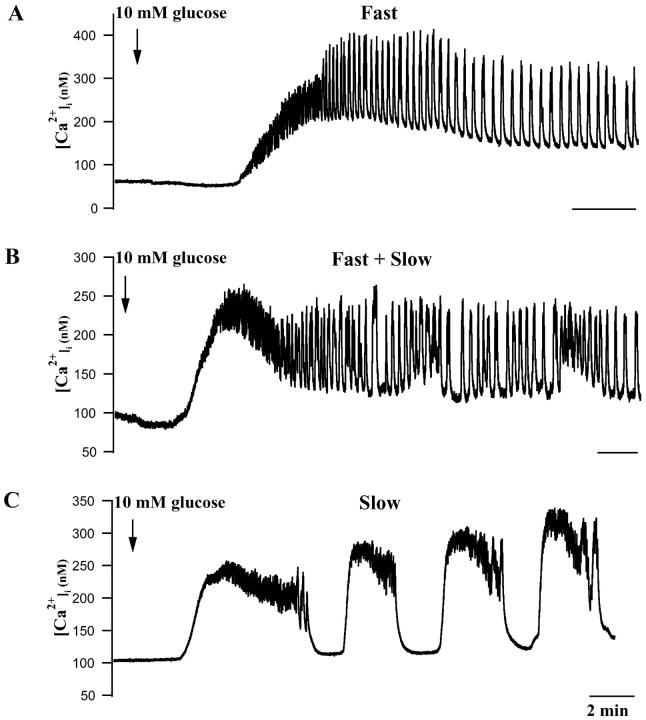
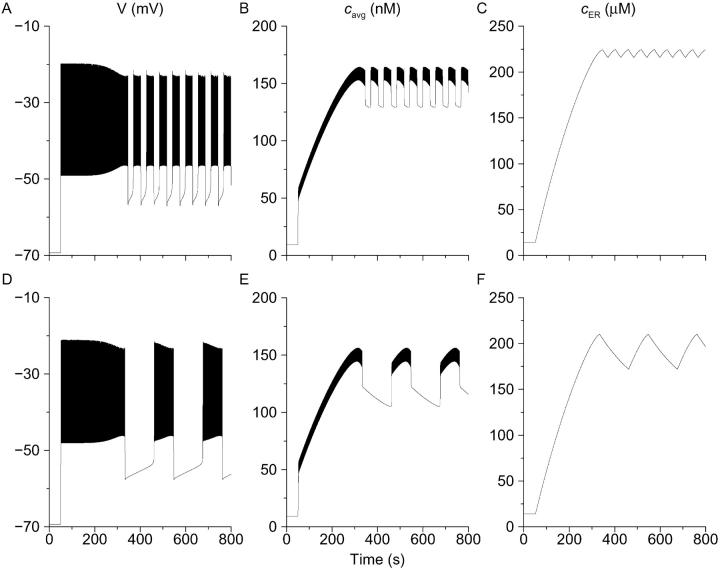
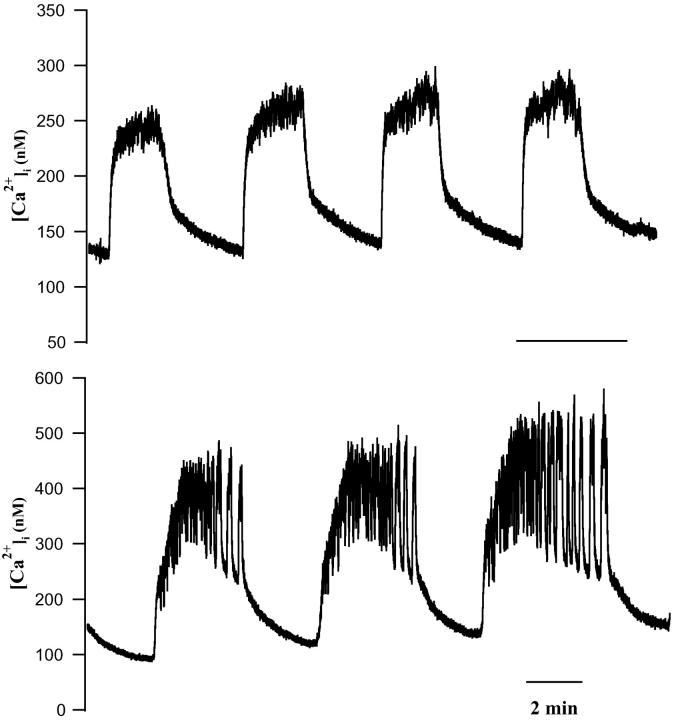
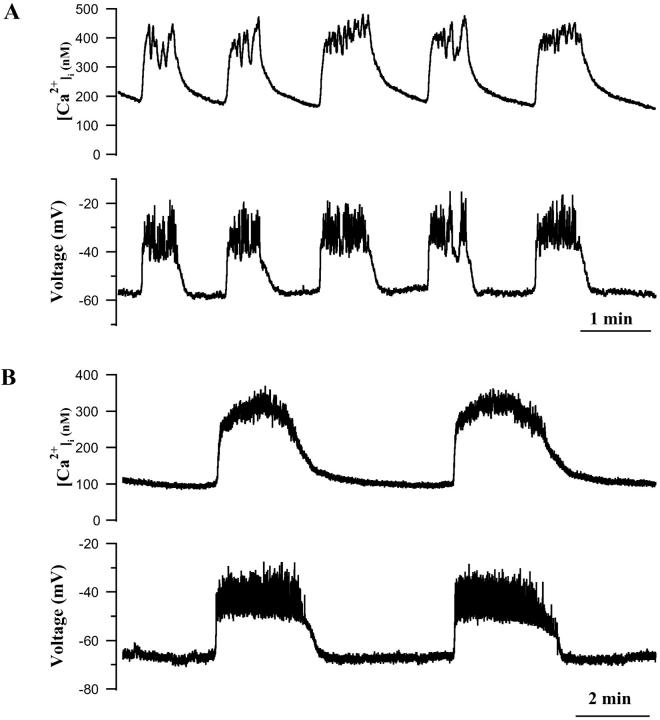
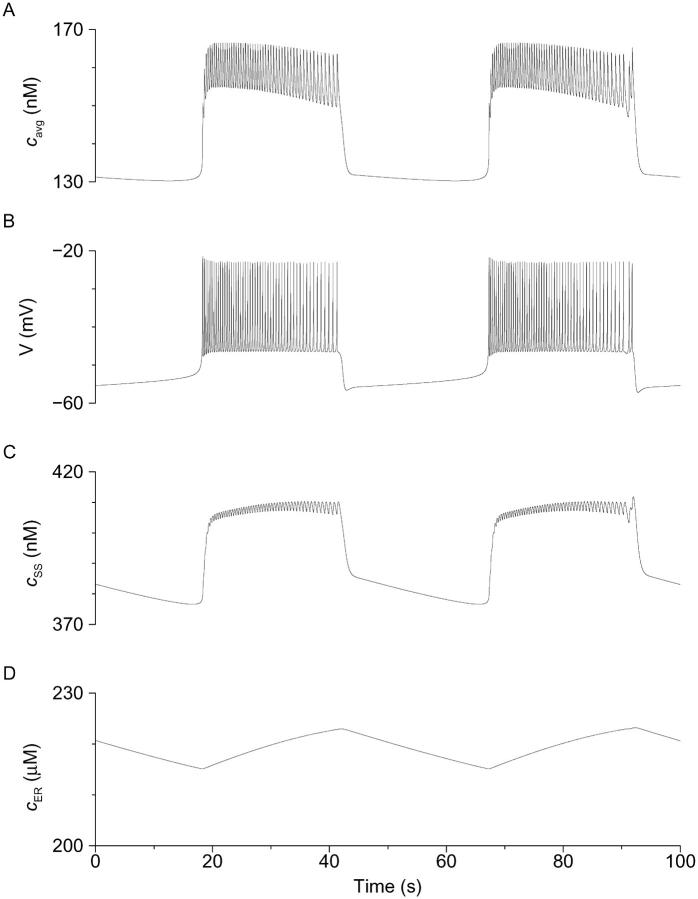
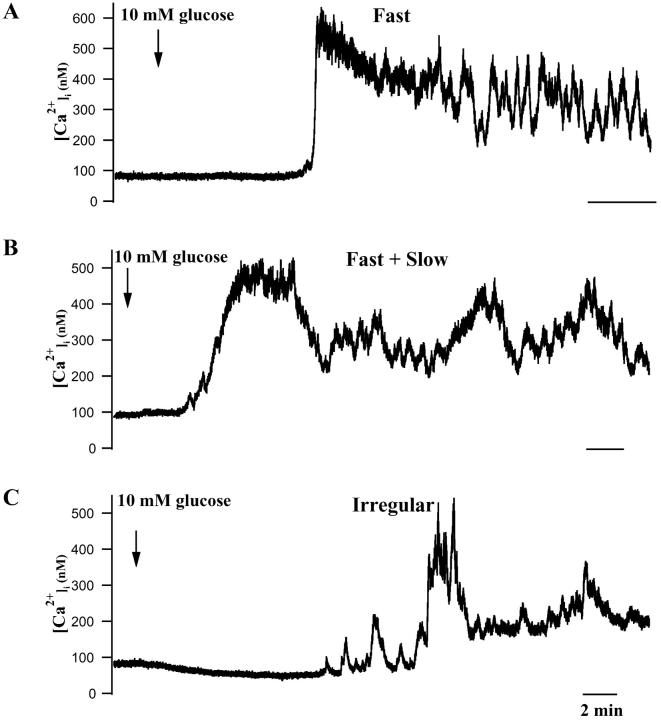
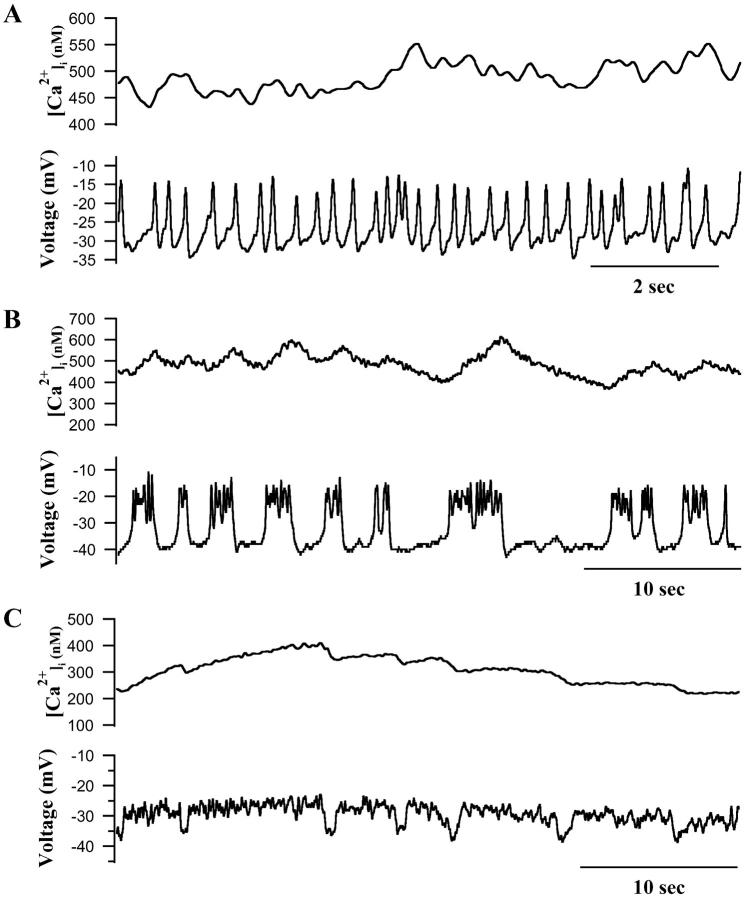
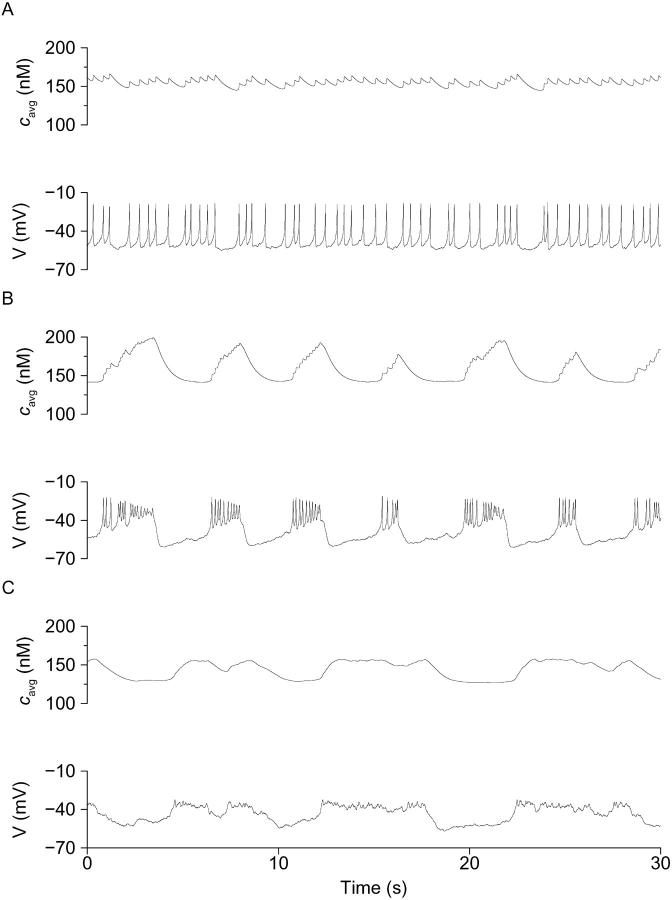
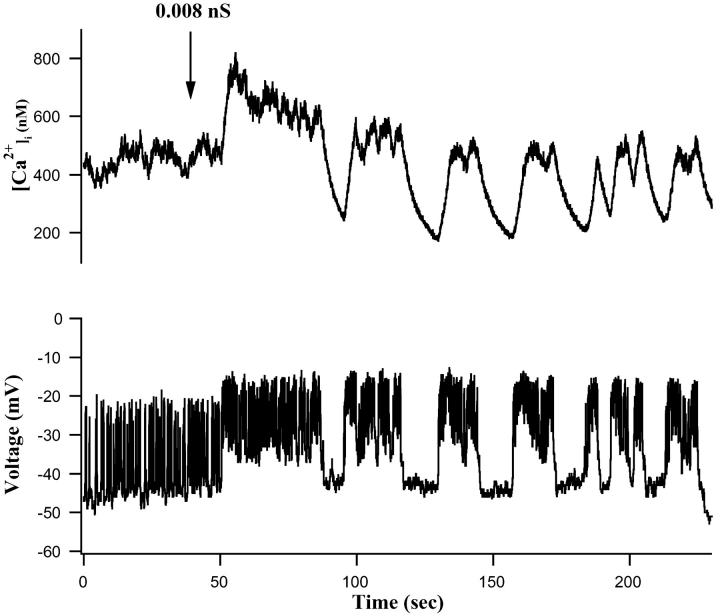
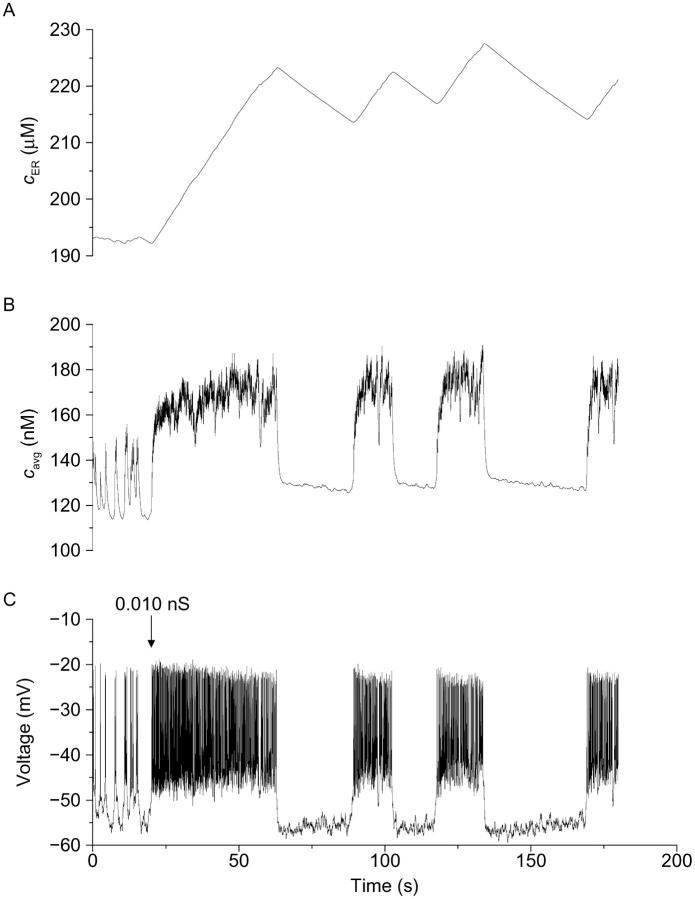
[Ca(2+)](i) and electrical activity were compared in isolated beta-cells and islets using standard techniques. In islets, raising glucose caused a decrease in [Ca(2+)](i) followed by a plateau and then fast (2-3 min(-1)), slow (0.2-0.8 min(-1)), or a mixture of fast and slow [Ca(2+)](i) oscillations. In beta-cells, glucose transiently decreased and then increased [Ca(2+)](i), but no islet-like oscillations occurred. Simultaneous recordings of [Ca(2+)](i) and electrical activity suggested that differences in [Ca(2+)](i) signaling are due to differences in islet versus beta-cell electrical activity. Whereas islets exhibited bursts of spikes on medium/slow plateaus, isolated beta-cells were depolarized and exhibited spiking, fast-bursting, or spikeless plateaus. These electrical patterns in turn produced distinct [Ca(2+)](i) patterns. Thus, although isolated beta-cells display several key features of islets, their oscillations were faster and more irregular. beta-cells could display islet-like [Ca(2+)](i) oscillations if their electrical activity was converted to a slower islet-like pattern using dynamic clamp. Islet and beta-cell [Ca(2+)](i) changes followed membrane potential, suggesting that electrical activity is mainly responsible for the [Ca(2+)] dynamics of beta-cells and islets. A recent model consisting of two slow feedback processes and passive endoplasmic reticulum Ca(2+) release was able to account for islet [Ca(2+)](i) responses to glucose, islet oscillations, and conversion of single cell to islet-like [Ca(2+)](i) oscillations. With minimal parameter variation, the model could also account for the diverse behaviors of isolated beta-cells, suggesting that these behaviors reflect natural cell heterogeneity. These results support our recent model and point to the important role of beta-cell electrical events in controlling [Ca(2+)](i) over diverse time scales in islets.
Figures
Similar articles
-
Delayed-rectifier (KV2.1) regulation of pancreatic beta-cell calcium responses to glucose: inhibitor specificity and modeling.Am J Physiol Endocrinol Metab. 2005 Oct;289(4):E578-85. doi: 10.1152/ajpendo.00054.2005. Epub 2005 Jul 12. Am J Physiol Endocrinol Metab. 2005. PMID: 16014354
-
Long lasting synchronization of calcium oscillations by cholinergic stimulation in isolated pancreatic islets.Biophys J. 2008 Nov 15;95(10):4676-88. doi: 10.1529/biophysj.107.125088. Epub 2008 Aug 15. Biophys J. 2008. PMID: 18708464 Free PMC article.
-
Glucose modulates [Ca2+]i oscillations in pancreatic islets via ionic and glycolytic mechanisms.Biophys J. 2006 Sep 15;91(6):2082-96. doi: 10.1529/biophysj.106.087296. Epub 2006 Jun 30. Biophys J. 2006. PMID: 16815907 Free PMC article.
-
Electrical bursting, calcium oscillations, and synchronization of pancreatic islets.Adv Exp Med Biol. 2010;654:261-79. doi: 10.1007/978-90-481-3271-3_12. Adv Exp Med Biol. 2010. PMID: 20217502 Free PMC article. Review.
-
Metabolic and electrical oscillations: partners in controlling pulsatile insulin secretion.Am J Physiol Endocrinol Metab. 2007 Oct;293(4):E890-900. doi: 10.1152/ajpendo.00359.2007. Epub 2007 Jul 31. Am J Physiol Endocrinol Metab. 2007. PMID: 17666486 Review.
Cited by
-
Episodic hormone secretion: a comparison of the basis of pulsatile secretion of insulin and GnRH.Endocrine. 2014 Sep;47(1):49-63. doi: 10.1007/s12020-014-0212-3. Epub 2014 Mar 8. Endocrine. 2014. PMID: 24610206 Free PMC article. Review.
-
Ionic mechanisms and Ca2+ dynamics underlying the glucose response of pancreatic β cells: a simulation study.J Gen Physiol. 2011 Jul;138(1):21-37. doi: 10.1085/jgp.201110611. J Gen Physiol. 2011. PMID: 21708953 Free PMC article.
-
Patch-Seq Links Single-Cell Transcriptomes to Human Islet Dysfunction in Diabetes.Cell Metab. 2020 May 5;31(5):1017-1031.e4. doi: 10.1016/j.cmet.2020.04.005. Epub 2020 Apr 16. Cell Metab. 2020. PMID: 32302527 Free PMC article.
-
The dynamics underlying pseudo-plateau bursting in a pituitary cell model.J Math Neurosci. 2011 Nov 8;1(12):12. doi: 10.1186/2190-8567-1-12. J Math Neurosci. 2011. PMID: 22268000 Free PMC article.
-
New Understanding of β-Cell Heterogeneity and In Situ Islet Function.Diabetes. 2018 Apr;67(4):537-547. doi: 10.2337/dbi17-0040. Diabetes. 2018. PMID: 29559510 Free PMC article.
References
-
- Antunes, C. M., A. Salgado, L. Rosario, and R. Santos. 2000. Differential patterns of glucose-induced electrical activity and intracellular calcium responses in single mouse and rat pancreatic islets. Diabetes. 49:2028–2038. - PubMed
-
- Arredouani, A., J. Henquin, and P. Gilon. 2002. Contribution of the endoplasmic reticulum to the glucose-induced [Ca2+]i response in mouse pancreatic islets. Am. J. Physiol. Endocrinol. Metab. 282:E982–E991. - PubMed
-
- Ashcroft, F. M., and P. Rorsman. 1989. Electrophysiology of the pancreatic β-cell. Prog. Biophys. Mol. Biol. 54:87–143. - PubMed
Publication types
MeSH terms
Substances
Grants and funding
LinkOut - more resources
Full Text Sources
Miscellaneous
