. 2003 May;84(5):2969-80.
doi: 10.1016/S0006-3495(03)70023-X.

Stimulatory action of internal protons on Slo1 BK channels

Affiliations

Stimulatory action of internal protons on Slo1 BK channels

Vladimir Avdonin et al. Biophys J. 2003 May.

Abstract

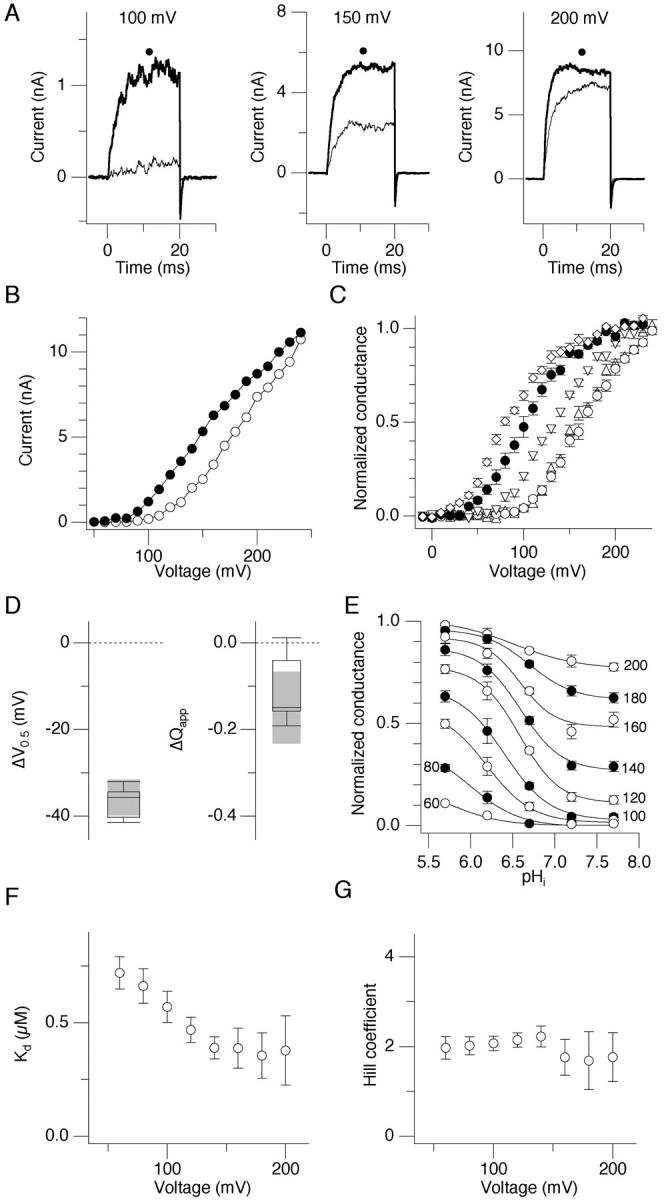
We investigated the internal pH-sensitivity of heterologously expressed hSlo1 BK channels. In the virtual absence of Ca(2+) and Mg(2+) to isolate the voltage-dependent gating transitions, low internal pH enhanced macroscopic hSlo1 currents by shifting the voltage-dependence of activation to more negative voltages. The activation time course was faster and the deactivation time course was slower with low pH. The estimated K(d) value of the stimulatory effect was approximately pH = 6.5 or 0.35 micro M. The stimulatory effect was maintained when the auxiliary subunit mouse beta1 was coexpressed. Treatment of the hSlo1 channel with the histidine modifying agent diethyl pyrocarbonate also enhanced the hSlo1 currents and greatly diminished the internal pH sensitivity, suggesting that diethyl pyrocarbonate and low pH may work on the same effector mechanism. High concentrations of Ca(2+) or Mg(2+) also masked the stimulatory effect of low internal pH. These results indicate that the acid-sensitivity of the Slo BK channel may involve the channel domain implicated in the divalent-dependent activation.


Figures

FIGURE 1
FIGURE 1
Low pHi enhances hSlo1 α channel currents in the virtual absence of Ca2+ and Mg2+. (A) Representative hSlo currents recorded at pHi = 7.2 and 6.2 at 100, 150, and 200 mV. The currents were elicited by pulses to 100 (left), 150 (center), and 200 (right) mV and then to −40 mV. In each panel, the currents recorded at pHi = 7.2 and 6.2 (denoted by a black dot) are shown. The internal solution contained 11 mM EDTA. (B) Peak I-V curves obtained from the representative patch shown in A at pHi = 7.2 and 6.2. The currents were elicited by pulses to the voltages indicated on the abscissa, and the peak outward currents were measured. (C) Mean G-V curves at different pHi from multiple patches. Triangles, pH 7.7; open circles, pH 7.2; inverse triangles, pH 6.7; filled circles, pH 6.2; squares, pH 5.7. The currents were elicited by pulses to the voltages indicated on the abscissa, and the tail currents were recorded at −40 mV to construct the G-V curves. (D) Box-plots summarizing the changes in V0.5 and Qapp caused by decreasing pHi from 7.2 to 6.2. The G-V curves were obtained as in C and summarized using box-plots (Tukey, 1977). In each experiment, the V0.5 and Qapp values at pHi = 7.2 were subtracted from those at pHi = 6.2. Negative ΔV0.5 values indicate shifts in G-V to the left along the voltage axis. Negative Qapp values indicate that G-V curves are less steep. (E) Normalized macroscopic conductance as a function of pHi. The macroscopic conductance values estimated from the tail currents were normalized to the maximal value obtained after a pulse to 230 mV at pHi = 5.7. The conductance values obtained at different voltages are shown using different symbols, and the voltages are indicated next to the curves. At a given voltage, the normalized conductance is greater at lower pHi. At a given pHi value, the conductance value is greater at more depolarized voltages. The smooth curves represent best fits of the data using the equation G0 + GpH/(1 + 10∧(pH × N − Kd)). G0 represents the pH-insensitive conductance fraction, GpH represents the pH-sensitive conductance fraction, N represents the Hill coefficient, and Kd represents the dissociation constant. n = 4–9. (F) Apparent Kd values at different test voltages for the effect of pHi on the hSlo macroscopic conductance. The Kd values were estimated for individual patches using the fitting procedures described for E. Each determination is based on 3–5 data sets depending on the voltage. (G) The values of the Hill coefficient estimated at different voltages for the effect of pHi on the hSlo macroscopic conductance. The values were estimated for individual patches using the fitting procedures described for E.
FIGURE 2
FIGURE 2
(A) Scaled representative tail currents recorded at −150 and −100 mV. In each panel, the current recorded at pHi = 7.2 and pHi = 6.2 (denoted by a black dot) are shown. The currents were elicited by 20-ms prepulses to 160 mV and scaled to facilitate comparison of the time course. (B) Representative currents recorded at 230 and 250 mV. In each panel, the currents recorded at pHi = 7.2 and pHi = 6.2 (denoted by a black dot) are shown. (C) Voltage dependence of the activation and deactivation time constant at different pHi values. The current activation time course and the deactivation time course were fitted with a single exponential, and the results are presented using the semilogarithmic scale. The deactivation time constants were measured from the tail currents elicited as in A. Triangles, pH 7.7; open circles, pH 7.2; inverse triangles, pH 6.7; filled circles, pH 6.2; squares, pH 5.7.
FIGURE 3
FIGURE 3
Lowering pHe does not alter hSlo1 currents. (A) Representative hSlo1 currents recorded in the outside-out configuration at pHe = 7.2 and 6.2. The currents were elicited by pulses from 0 to 100 (left) and 150 (right) mV and then to −40 mV. In each panel, the current recorded at pHe = 7.2 and 6.2 are shown. (B) G-V data from two representative experiments recorded at pHe = 7.2 and 6.2.
FIGURE 4
FIGURE 4
Enhancement of hSlo1 currents by DEPC. (A) Representative hSlo1 currents at 130 mV before and after DEPC treatment. Freshly prepared DEPC was applied to the intracellular side of the inside-out patch for 5 min and the chamber was subsequently washed free of DEPC. The control and the current recorded after the DEPC treatment and wash (denoted by a black dot) are shown. The currents were elicited by pulses from 0 to 130 mV and then to 40 mV. (B) The peak hSlo1 current amplitude as a function of time in a representative experiment. The currents were elicited by pulses from 0 mV to 130 mV every 20 s. The black bar indicates the DEPC treatment duration (10 mM). (C) “Aged” DEPC solution does not alter hSlo1 currents. Representative hSlo1 currents recorded at 130 mV before and after treatment with 10 mM DEPC that was prepared 4 h before the experiment. The DEPC solution was applied to the patch for 5 min and washed out. The tail currents were recorded at 40 mV. (D) Box-plots showing relative changes in the hSlo1 current amplitude at 130 mV caused by fresh (n = 11) and aged (n = 5) 10 mM DEPC solutions. DEPC was applied for 5 min and washed out. The currents were elicited by pulses from 0 to 130 mV.
FIGURE 5
FIGURE 5
DEPC treatment shifts the hSlo1 channel activation to more negative voltages. (A) Representative hSlo1 currents recorded in the inside-out configuration at 100 and 150 mV before and after DEPC treatment. The currents were elicited by pulses from −30 to 100 or 150 mV and then to −40 mV. DEPC (10 mM) was applied for 5 min and washed out (denoted by black dots). (B) Representative hSlo1 peak I-V curves before (open circles) and after (filled circles) DEPC treatment. The currents were elicited and DEPC treatment was performed as described in A. (C) Normalized macroscopic conductance before (open circles) and after (filled circles) DEPC modification. The tail hSlo1 currents were recorded at −40 mV after prepulses to different voltages and fitted with a single exponential. The extrapolated current values at time t = 0 were normalized to the maximal value recorded after a prepulse to 250 mV in each condition in each patch. n = 6. (D) Comparisons of the estimated V0.5 and Qapp values before and after DEPC treatment. In each patch, macroscopic G-V curves were estimated as in C and fitted with Boltzmann curves. The V0.5 (left) and Qapp values (right) before and after DEPC treatment are compared using boxplots. n = 6.
FIGURE 6
FIGURE 6
DEPC accelerates the hSlo1 activation time course and slows the deactivation time course. (A) Scaled representative hSlo1 tail currents before and after DEPC treatment at −50 and −20 mV. The currents were elicited by prepulses to 160 mV for 20 ms and scaled for comparison. In each panel, the control current and the current after DEPC treatment are shown (denoted by a black dot). DEPC (10 mM) was applied for 5 min and washed out. (B) Representative hSlo1 activation time courses at 230 and 250 mV. The currents were elicited by pulses to 230 and 250 mV. (C) Voltage dependence of the activation and deactivation time constant before (open circles) and after (filled circles) DEPC treatment. The currents elicited at the voltages indicated on the abscissa were fitted with a single exponential, and time constant values were plotted as a function of the test voltage. n = 4–8.
FIGURE 7
FIGURE 7
DEPC also alters hSlo1 channels when applied from the extracellular side. (A) Representative hSlo1 currents recorded in the outside-out configuration at 100 and 150 mV before and after DEPC treatment (denoted by a black dot). DEPC 10 mM was present in the chamber for 5 min and washed out. The currents were elicited by pulses from 0 mV to the voltages indicated and then to 40 mV. (B) Normalized macroscopic conductance before (open circles) and after (filled circles) DEPC treatment in the outside-out configuration. The currents were elicited as in A. n = 6. The V0.5 and Qapp values before DEPC were 159 mV and 0.99 e, and after DEPC treatment they were 114 mV and 0.68 e.
FIGURE 8
FIGURE 8
DEPC treatment diminishes the stimulatory effect of low pHi. (A) Representative currents at pHi = 7.2 and 6.2 recorded in the inside-out configuration at 90 and 130 mV before (left) and after (right) DEPC treatment. The tail currents were recorded at −40 mV. In each panel, the currents recorded at pHi = 7.2 and 6.2 (denoted by a black dot) are shown superimposed. The patch was treated with DEPC (10 mM) for 5 min and DEPC was washed out. (B) G-V curves at pHi = 6.2 and 7.2 before (left) and after (right) DEPC treatment. In each panel, the G-V curve at pHi = 7.2 (open circles) and 6.2 (filled circles) are shown superimposed. The currents were elicited as in A to generate the G-V curves. (C) Comparison of the G-V curve parameters V0.5 and Qapp at pHi = 7.2 and 6.2 before and after DEPC treatment. In each boxplot, the parameter values at pHi = 7.2 and 6.2 are compared. In each experiment, the G-V curves at pHi = 7.2 and 6.2 were first obtained. The patch was then treated with DEPC (10 mM) for 5 min and DEPC was washed out. G-V curves were then determined again at pHi = 7.2 and 6.2. n = 5. (D) Voltage dependence of the activation/deactivation time constant before (left) and after (right) DEPC treatment. In each panel, the time constant values at pHi = 7.2 (open circles) and 6.2 (filled circles) are shown superimposed. The currents were elicited as in A.
FIGURE 9
FIGURE 9
High Ca2+ and Mg2+ antagonize the stimulatory effect of low pHi. (A) Representative hSlo1 currents recorded in the inside-out configuration in the presence of 1 mM Mg2+ and 1 μM Ca2+ in the bath solution. The currents were elicited by pulses from −30 mV to the voltages indicated and then to −40 mV. The pHi = 7.2 internal solution contained (in mM): 140 KCl, 1 EDTA, 2 MgCl2, 0.1 CaCl2, 10 HEPES (NMDG). The pHi = 6.2 internal solution contained (in mM): 140 KCl, 1 EDTA, 2 MgCl2, 0.1 CaCl2, 10 MES (NMDG). In each panel, the currents recorded at pHi = 7.2 and pHi = 6.2 (denoted by black dots) are shown. (B) G-V curves at pHi = 7.2 (open circles) and 6.2 (filled circles) with 1 mM Mg2+ and 1 μM Ca2+. The estimated mean V0.5 and Qapp at pHi = 7.2 are 100 mV and 1.1 e, and 94 mV and 1.1 e at pHi = 6.2. n = 8. (C) Voltage dependence of the activation and deactivation time constants at pHi = 7.2 (open circles) and 6.2 (filled circles). (D) Representative hSlo1 currents recorded in the inside-out configuration in the presence of 10 mM Mg2+ and no added Ca2+. The currents were elicited by pulses from −40 mV to the voltages indicated and then −50 mV. The pHi = 7.2 internal solution contained (in mM): 140 KCl, 2 EDTA, 12 MgCl2, 10 HEPES (NMDG). The pHi = 6.2 internal solution contained MES in place of HEPES. Free [Mg2+] is calculated to be ∼10 mM. The data were filtered at 10 kHz and sampled at 100 kHz. (E) G-V curves at pHi = 7.2 (open circles) and 6.2 (filled circles) with 10 mM Mg2+. The estimated V0.5 and Qapp at pHi = 7.2 are 82 mV and 1.3 e, and 85 mV and 1.2 e at pHi = 6.2. The currents were elicited as in D. n = 7. (F) Representative hSlo1 currents recorded with 200 μM Ca2+. The currents were elicited by pulses from −100 to −20 or 20 mV and then to −110 mV. The pHi = 7.2 solution contained (in mM): 140 KCl, 0.2 CaCl2, 10 HEPES (NMDG). The pHi = 6.2 solution contained (in mM): 140 KCl, 0.2 CaCl2, 10 MES (NMDG). No divalent chelator was used. (G) G-V curves at pHi = 7.2 (open circles) and 6.2 (closed circles) with 200 μM Ca2+. The currents were elicited as in F. The V0.5 and Qapp values at pHi = 7.2 and 6.2 were 17 mV, 1.0 e and 15 mV, 0.98 e. n = 6.
FIGURE 10
FIGURE 10
Low pHi stimulates the Slo1 currents in the presence of the mouse β1 subunit. (A) Representative hSlo1 α/mouse β1 currents at 80 and 120 mV at pHi = 7.2 and pHi = 6.2 (denoted by black dots). The currents were elicited by pulses to the voltages indicated and then to −40 mV. (B) Mean G-V curves at pHi = 7.2 (open circles) and 6.2 (filled circles). The tail currents were recorded at −40 mV after prepulses to the voltages indicated on the abscissa to construct the G-V curves. (C) Changes in the estimated V0.5 value and Qapp value in response to lowering pHi from 7.2 to 6.2. In each experiment, the V0.5 and Qapp values were estimated at the two pHi values and the values at pHi = 7.2 were subtracted from those at pHi = 6.2.
FIGURE 11
FIGURE 11
DEPC alters hSlo1 currents in the presence of the mouse β1 subunit. (A) Representative hSlo1 α/mouse β1 currents before and after treatment with 10 mM DEPC (denoted by black dots). DEPC was applied to the patch in the inside-out configuration for 5 min and washed out. The currents were elicited by pulses to 80 mV (left) and 120 mV (right) and then to −40 mV. In each panel, the currents before and after DEPC treatment are shown. (B) G-V curves before (open circles) and after (filled circles) DEPC treatment. n = 7. (C) Comparison of the V0.5 and Qapp values before and after DEPC treatment using boxplots. n = 7.
FIGURE 12
FIGURE 12
Low pHi stimulates the activity of rat hippocampal neuron BK channels. (A) Representative rat hippocampal neuron BK channel openings elicited by pulses from 0 to 80 mV in the inside-out configuration at pHi = 7.2 (left) and 6.2 (right). In each panel, the ensemble average constructed from >100 sweeps is shown at the bottom. The openings were recorded using the standard low Ca2+/Mg2+ high K+ solutions in the pipette and in the recording chamber. This patch contained four channels as evidenced by four overlapping openings when the internal Ca2+ concentration was raised to 13 μM. The data were filtered at 10 kHz and sampled at 100 kHz. Similar results were obtained in four other patches.

References

    1. Adelman, J. P., K. Z. Shen, M. P. Kavanaugh, R. A. Warren, Y. N. Wu, A. Lagrutta, C. T. Bond, and R. A. North. 1992. Calcium-activated potassium channels expressed from cloned complementary DNAs. Neuron. 9:209–216. - PubMed
    1. Bao, L., A. M. Rapin, E. C. Holmstrand, and D. H. Cox. 2002. Elimination of the BKCa channel's high-affinity Ca2+ sensitivity. J. Gen. Physiol. 120:173–189. - PMC - PubMed
    1. Brenner, R., T. J. Jegla, A. Wickenden, Y. Liu, and R. W. Aldrich. 2000a. Cloning and functional characterization of novel large conductance calcium-activated potassium channel beta subunits, hKCNMB3 and hKCNMB4. J. Biol. Chem. 275:6453–6461. - PubMed
    1. Brenner, R., G. J. Perez, A. D. Bonev, D. M. Eckman, J. C. Kosek, S. W. Wiler, A. J. Patterson, M. T. Nelson, and R. W. Aldrich. 2000b. Vasoregulation by the beta1 subunit of the calcium-activated potassium channel. Nature. 407:870–876. - PubMed
    1. Butler, A., S. Tsunoda, D. P. McCobb, A. Wei, and L. Salkoff. 1993. mSlo, a complex mouse gene encoding “maxi” calcium-activated potassium channels. Science. 261:221–224. - PubMed

Publication types

MeSH terms

Substances

LinkOut - more resources