

Cooperative partition model of nystatin interaction with phospholipid vesicles
- PMID: 12719237
- PMCID: PMC1302868
- DOI: 10.1016/S0006-3495(03)70032-0
Cooperative partition model of nystatin interaction with phospholipid vesicles
Abstract
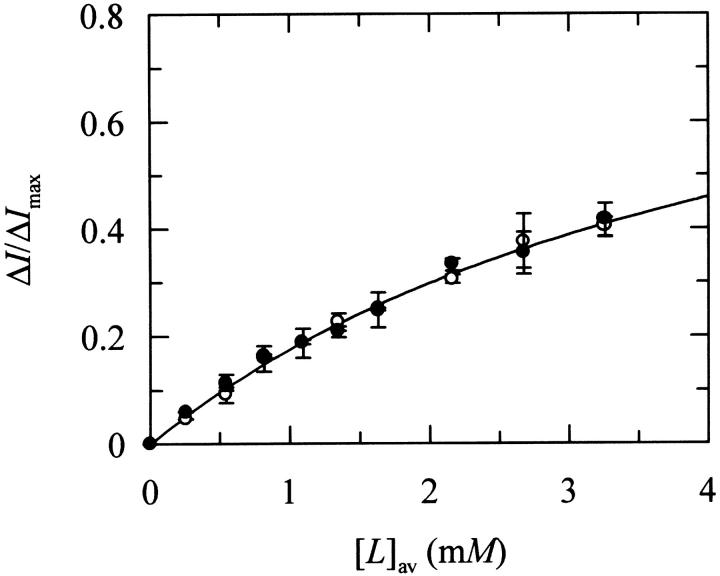
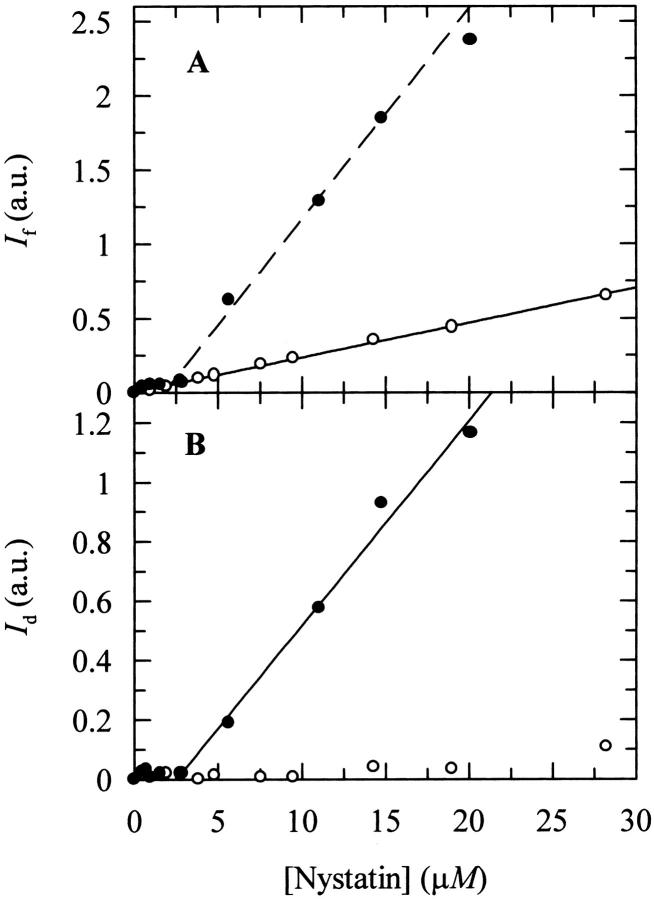
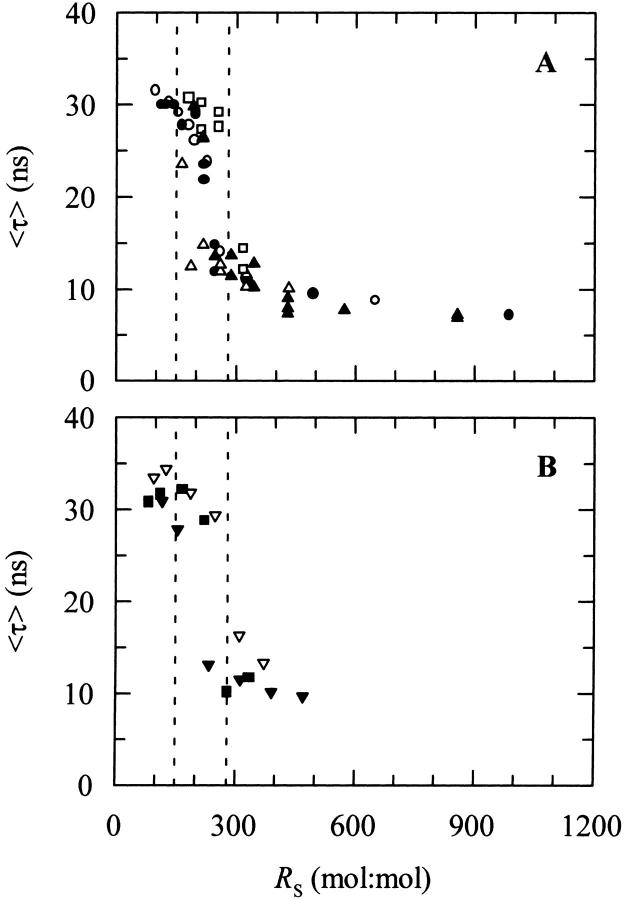
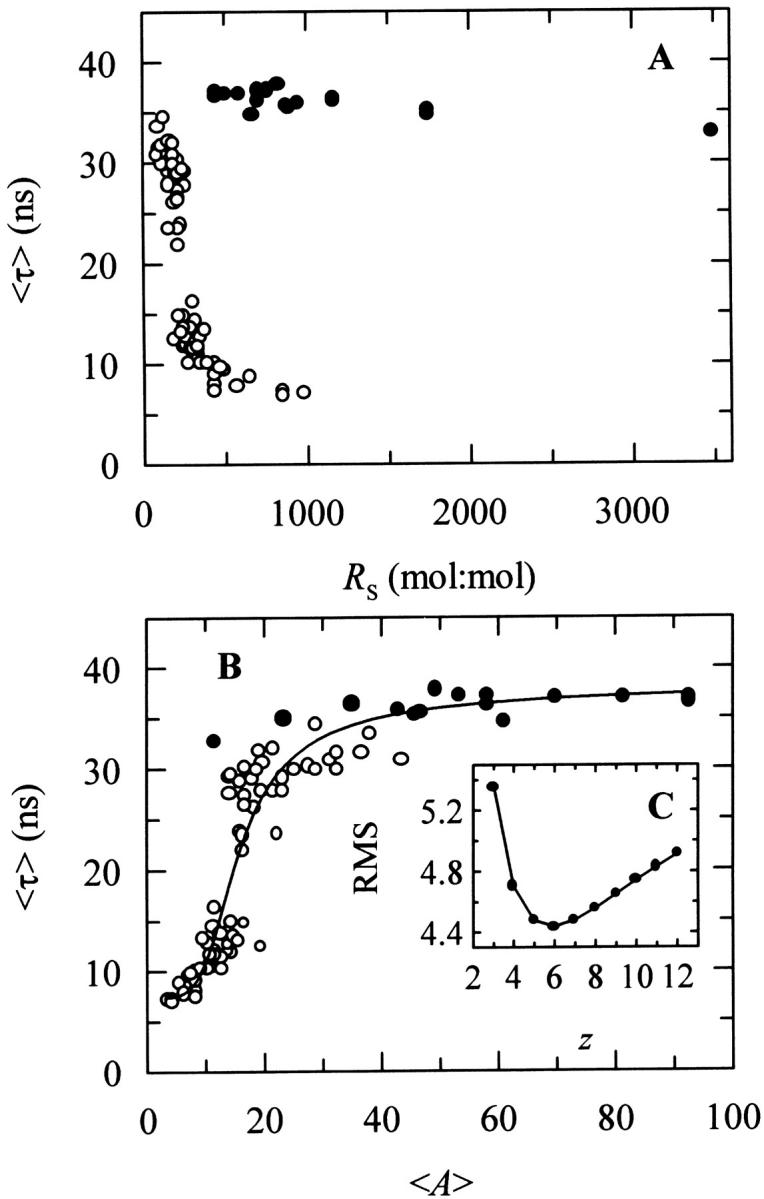
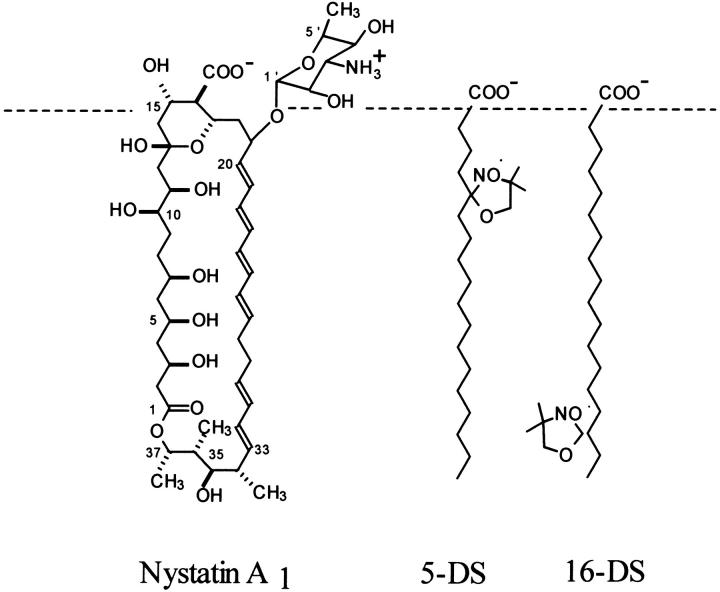
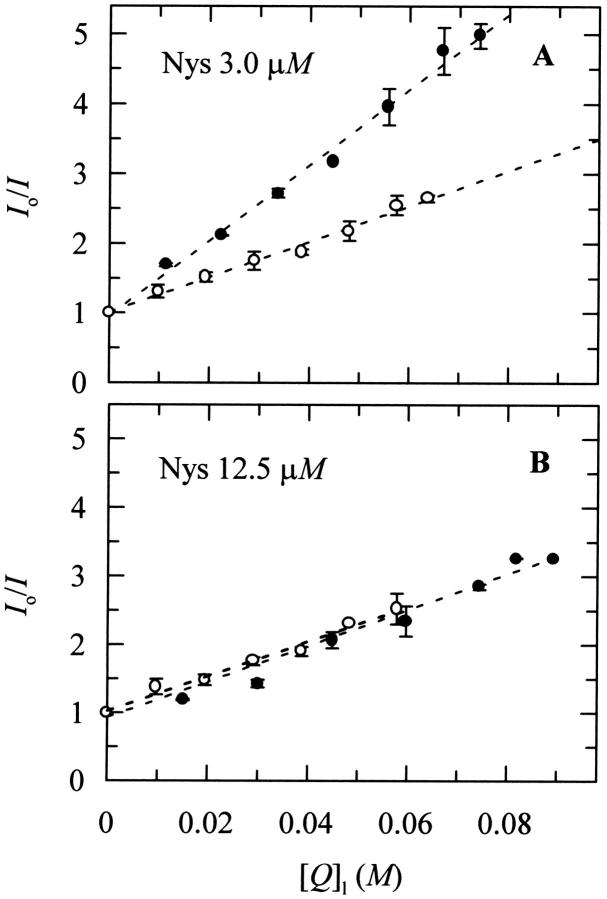
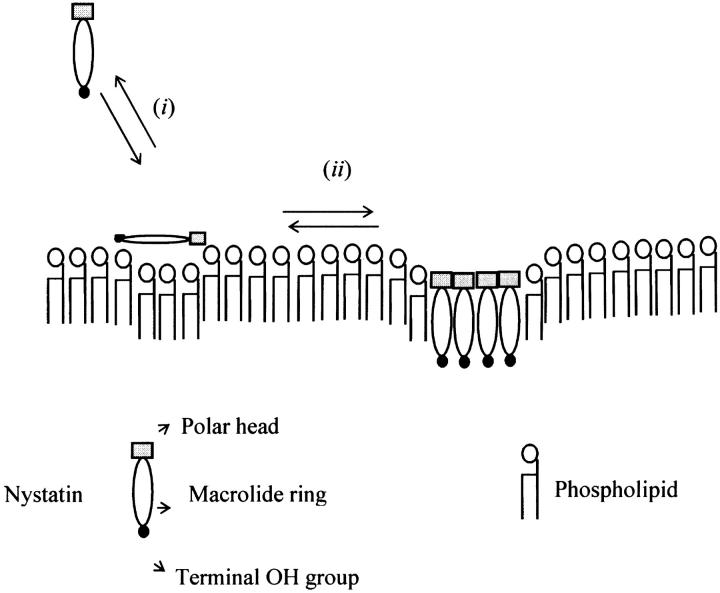
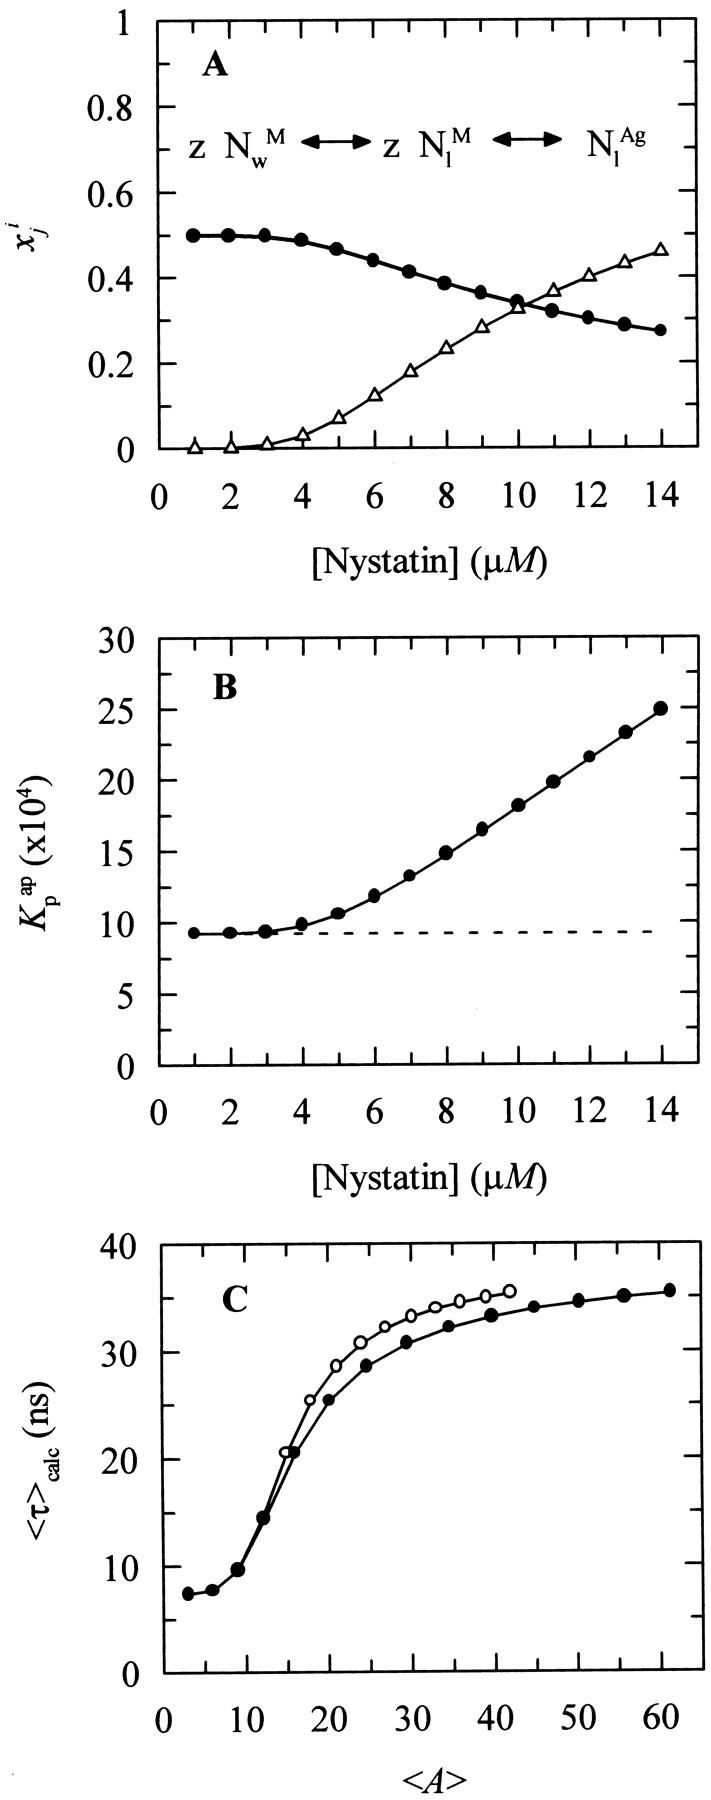
Nystatin is a membrane-active polyene antibiotic that is thought to kill fungal cells by forming ion-permeable channels. In this report we have investigated nystatin interaction with phosphatidylcholine liposomes of different sizes (large and small unilamellar vesicles) by time-resolved fluorescence measurements. Our data show that the fluorescence emission decay kinetics of the antibiotic interacting with gel-phase 1,2-dipalmitoyl-sn-glycero-3-phosphocholine vesicles is controlled by the mean number of membrane-bound antibiotic molecules per liposome, <A>. The transition from a monomeric to an oligomeric state of the antibiotic, which is associated with a sharp increase in nystatin mean fluorescence lifetime from approximately 7-10 to 35 ns, begins to occur at a critical concentration of 10 nystatin molecules per lipid vesicle. To gain further information about the transverse location (degree of penetration) of the membrane-bound antibiotic molecules, the spin-labeled fatty acids (5- and 16-doxyl stearic acids) were used in depth-dependent fluorescence quenching experiments. The results obtained show that monomeric nystatin is anchored at the phospholipid/water interface and suggest that nystatin oligomerization is accompanied by its insertion into the membrane. Globally, the experimental data was quantitatively described by a cooperative partition model which assumes that monomeric nystatin molecules partition into the lipid bilayer surface and reversibly assemble into aggregates of 6 +/- 2 antibiotic molecules.
Figures
Similar articles
-
Self-association of the polyene antibiotic nystatin in dipalmitoylphosphatidylcholine vesicles: a time-resolved fluorescence study.Biophys J. 1995 Dec;69(6):2541-57. doi: 10.1016/S0006-3495(95)80125-6. Biophys J. 1995. PMID: 8599661 Free PMC article.
-
Cholesterol and ergosterol influence nystatin surface aggregation: relation to pore formation.Biophys J. 2004 Nov;87(5):3264-76. doi: 10.1529/biophysj.104.044883. Epub 2004 Aug 17. Biophys J. 2004. PMID: 15315952 Free PMC article.
-
Conformation and self-assembly of a nystatin nitrobenzoxadiazole derivative in lipid membranes.Biochim Biophys Acta. 2003 Oct 31;1617(1-2):69-79. doi: 10.1016/j.bbamem.2003.09.004. Biochim Biophys Acta. 2003. PMID: 14637021
-
Mixing of oxidized and bilayer phospholipids.Biochim Biophys Acta. 2015 Jul;1848(7):1472-80. doi: 10.1016/j.bbamem.2015.03.027. Epub 2015 Apr 1. Biochim Biophys Acta. 2015. PMID: 25839354 Free PMC article.
-
Measuring membrane penetration with depth-dependent fluorescence quenching: distribution analysis is coming of age.Biochim Biophys Acta. 2014 Sep;1838(9):2289-95. doi: 10.1016/j.bbamem.2014.02.019. Epub 2014 Mar 1. Biochim Biophys Acta. 2014. PMID: 24593994 Free PMC article. Review.
Cited by
-
Mechanism of membrane activity of the antibiotic trichogin GA IV: a two-state transition controlled by peptide concentration.Biophys J. 2005 May;88(5):3411-21. doi: 10.1529/biophysj.104.056077. Epub 2005 Feb 18. Biophys J. 2005. PMID: 15722429 Free PMC article.
-
Evaluation of nystatin isolated from Streptomyces griseus SDX-4 against the ciliate, Ichthyophthirius multifiliis.Parasitol Res. 2015 Apr;114(4):1425-31. doi: 10.1007/s00436-015-4325-2. Epub 2015 Feb 3. Parasitol Res. 2015. PMID: 25645004
-
Effect of fengycin, a lipopeptide produced by Bacillus subtilis, on model biomembranes.Biophys J. 2008 Apr 1;94(7):2667-79. doi: 10.1529/biophysj.107.114090. Epub 2008 Jan 4. Biophys J. 2008. PMID: 18178659 Free PMC article.
-
Lateral distribution of NBD-PC fluorescent lipid analogs in membranes probed by molecular dynamics-assisted analysis of Förster Resonance Energy Transfer (FRET) and fluorescence quenching.Int J Mol Sci. 2012 Nov 8;13(11):14545-64. doi: 10.3390/ijms131114545. Int J Mol Sci. 2012. PMID: 23203080 Free PMC article.
-
Nystatin enhances the immune response against Candida albicans and protects the ultrastructure of the vaginal epithelium in a rat model of vulvovaginal candidiasis.BMC Microbiol. 2018 Oct 25;18(1):166. doi: 10.1186/s12866-018-1316-3. BMC Microbiol. 2018. PMID: 30359236 Free PMC article.
References
-
- Akaike, N., and N. Harata. 1994. Nystatin perforated patch recording and its applications to analyses of intracellular mechanisms. Jpn. J. Physiol. 44:433–473. - PubMed
-
- Andreoli, T. E. 1974. The structure and function of amphotericin B-cholesterol pores in lipid bilayer membranes. Ann. N.Y. Acad. Sci. 235:448–468. - PubMed
-
- Asuncion-Punzalan, E., K. Kachel, and E. London. 1998. Groups with polar characteristics can locate at both shallow and deep locations in membranes: the behavior of dansyl related probes. Biochemistry. 37:4603–4611. - PubMed
-
- Balakrishnan, A. R., and K. R. K. Easwaran. 1993. Lipid-amphotericin B complex structure in solution: a possible first step in the aggregation process in cell membranes. Biochemistry. 32:4139–4144. - PubMed
Publication types
MeSH terms
Substances
LinkOut - more resources
Full Text Sources
Miscellaneous
