

Interaction between artificial membranes and enflurane, a general volatile anesthetic: DPPC-enflurane interaction
- PMID: 12719242
- PMCID: PMC1302873
- DOI: 10.1016/S0006-3495(03)70037-X
Interaction between artificial membranes and enflurane, a general volatile anesthetic: DPPC-enflurane interaction
Abstract
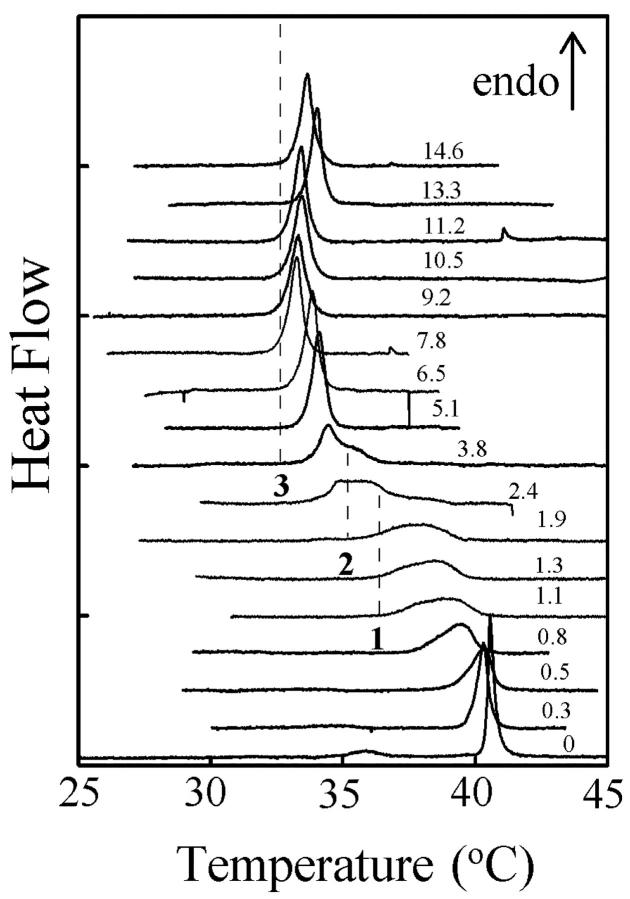
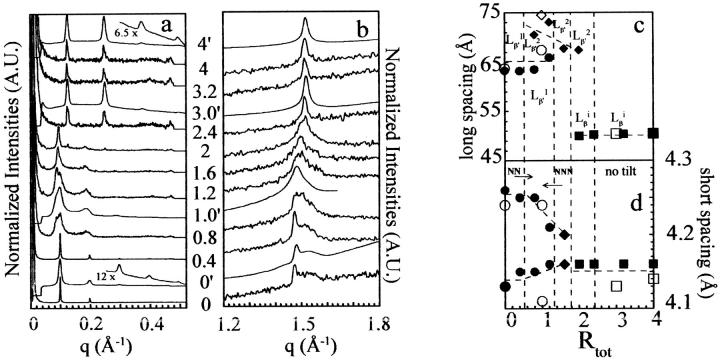
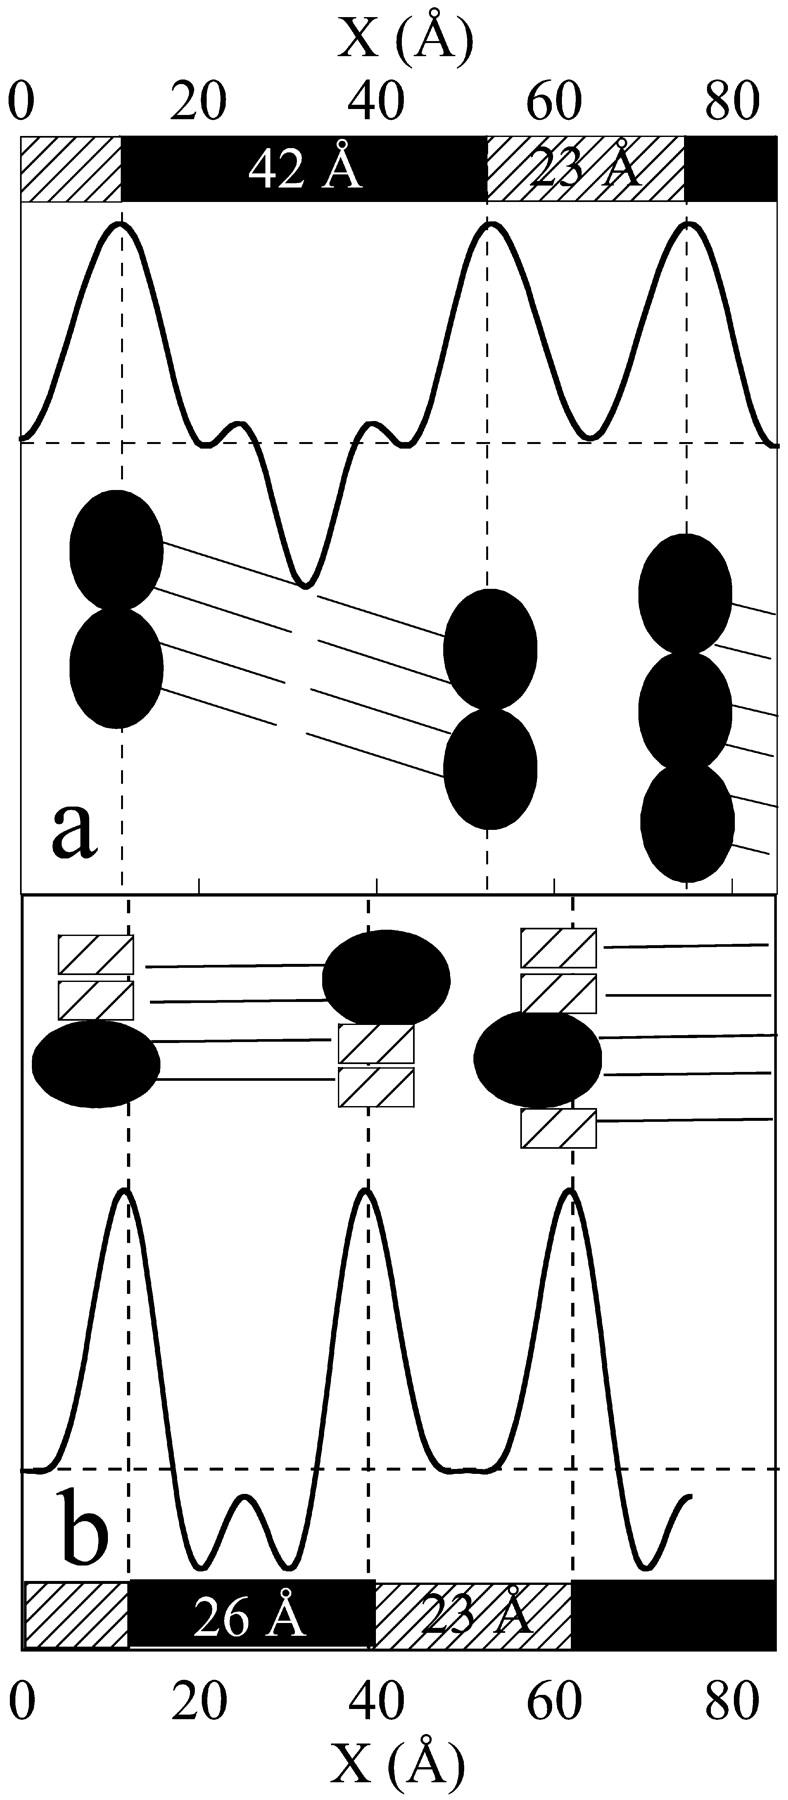
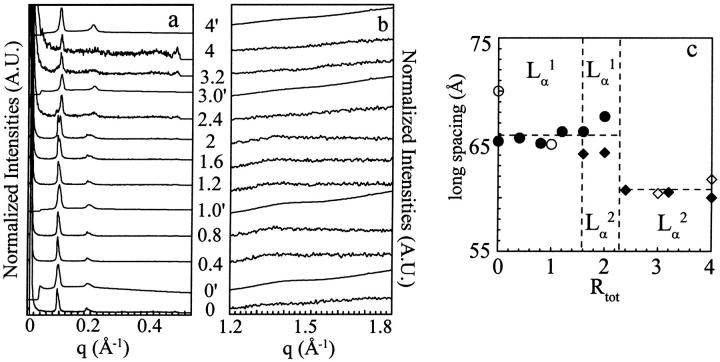
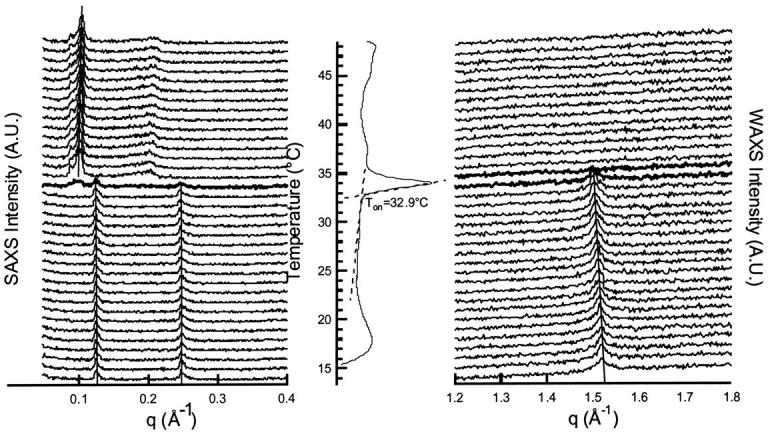
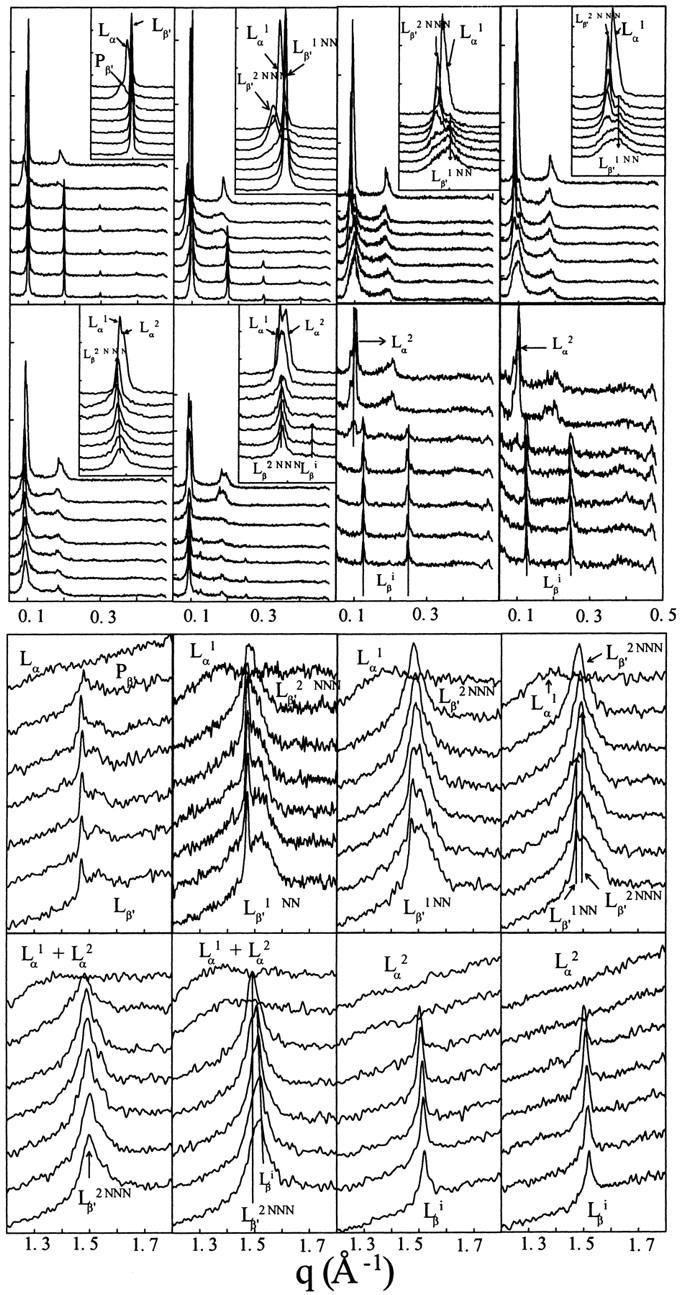
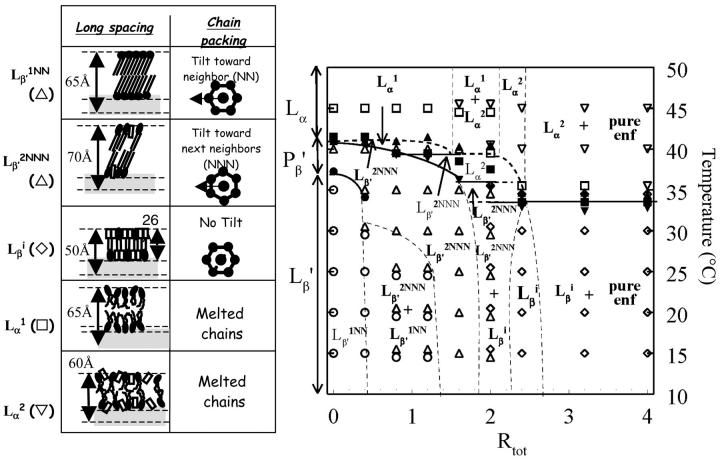
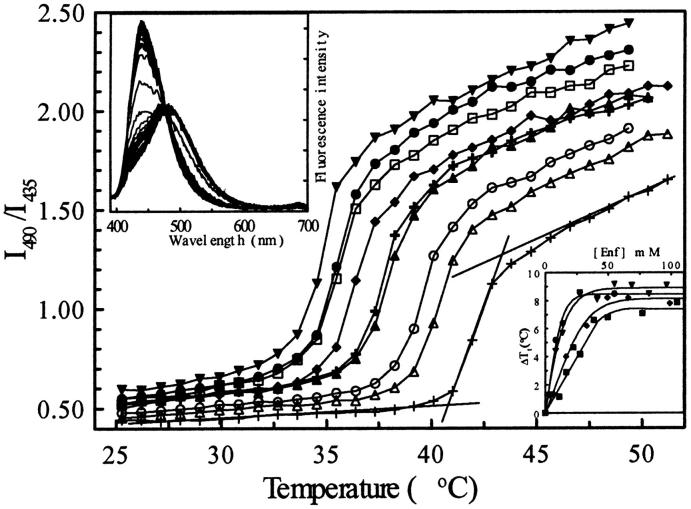
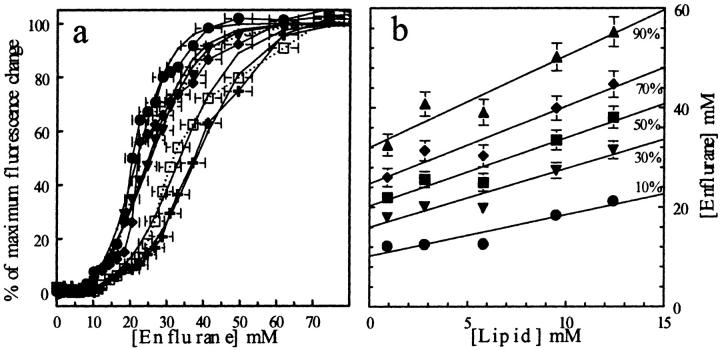
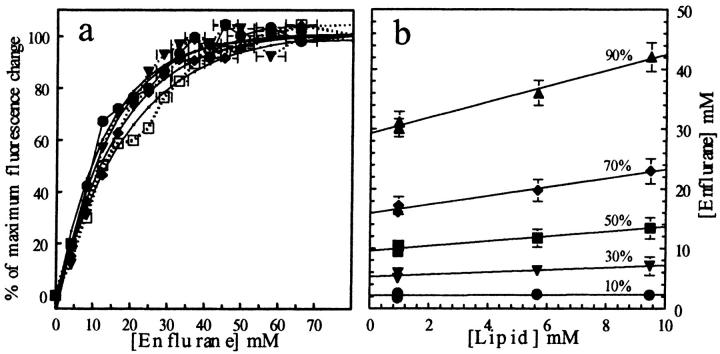
The structural modifications of the dipalmitoylphosphatidylcholine (DPPC) organization induced by increasing concentration of the volatile anesthetic enflurane have been studied by differential scanning calorimetry, small-angle, and wide-angle x-ray scattering. The interaction of enflurane with DPPC depends on at least two factors: the enflurane-to-lipid concentration ratio and the initial organization of the lipids. At 25 degrees C (gel state), the penetration of enflurane within the lipids induces the apparition of two different mixed lipid phases. At low anesthetic-to-lipid molar ratio, the smectic distance increases whereas the direction of the chain tilt changes from a tilt toward next-neighbors to a tilt between next-neighbors creating a new gel phase called L(beta')(2NNN). At high ratio, the smectic distance is much smaller than for the pure L(beta') DPPC phase, i.e., 50 A compared to 65 A, the aliphatic chains are perpendicular to the membrane and the fusion temperature of the phase is 33 degrees C. The electron profile of this phase that has been called L(beta)(i), indicates that the lipids are fully interdigitated. At 45 degrees C (fluid state), a new melted phase, called L(alpha)(2), was found, in which the smectic distance decreased compared to the initial pure L(alpha)(1) DPPC phase. The thermotropic behavior of the mixed phases has also been characterized by simultaneous x-ray scattering and differential scanning calorimetry measurements using the Microcalix calorimeter of our own. Finally, titration curves of enflurane effect in the mixed lipidic phase has been obtained by using the fluorescent lipid probe Laurdan. Measurements as a function of temperature or at constant temperature, i.e., 25 degrees C and 45 degrees C give, for the maximal effect, an enflurane-to-lipid ratio (M/M), within the membrane, of 1 and 2 for the L(alpha)(2) and the L(beta)(i) lamellar phase respectively. All the results taken together allowed to draw a pseudo-binary phase diagram of enflurane-dipalmitoylphosphatidylcholine in excess water.
Figures
Similar articles
-
A DSC and FTIR spectroscopic study of the effects of the epimeric 4-cholesten-3-ols and 4-cholesten-3-one on the thermotropic phase behaviour and organization of dipalmitoylphosphatidylcholine bilayer membranes: comparison with their 5-cholesten analogues.Chem Phys Lipids. 2014 Jan;177:71-90. doi: 10.1016/j.chemphyslip.2013.11.008. Epub 2013 Dec 1. Chem Phys Lipids. 2014. PMID: 24296232
-
Characterization of complexes formed in fully hydrated dispersions of dipalmitoyl derivatives of phosphatidylcholine and diacylglycerol.Biophys J. 1995 Apr;68(4):1374-82. doi: 10.1016/S0006-3495(95)80310-3. Biophys J. 1995. PMID: 7787023 Free PMC article.
-
A DSC and FTIR spectroscopic study of the effects of the epimeric cholestan-3-ols and cholestan-3-one on the thermotropic phase behavior and organization of dipalmitoylphosphatidylcholine bilayer membranes: Comparison with their 5-cholesten analogs.Chem Phys Lipids. 2015 Apr;187:34-49. doi: 10.1016/j.chemphyslip.2015.02.002. Epub 2015 Feb 27. Chem Phys Lipids. 2015. PMID: 25732198
-
Calorimetric, x-ray diffraction, and spectroscopic studies of the thermotropic phase behavior and organization of tetramyristoyl cardiolipin membranes.Biophys J. 2007 May 1;92(9):3166-77. doi: 10.1529/biophysj.106.094003. Epub 2007 Feb 9. Biophys J. 2007. PMID: 17293402 Free PMC article.
-
Dynamics of lipid domain formation: fluctuation analysis.Biochim Biophys Acta. 2010 Jul;1798(7):1368-76. doi: 10.1016/j.bbamem.2009.12.002. Epub 2009 Dec 16. Biochim Biophys Acta. 2010. PMID: 20025848 Free PMC article. Review.
Cited by
-
Understanding the Molecular Mechanism of Anesthesia: Effect of General Anesthetics and Structurally Similar Non-Anesthetics on the Properties of Lipid Membranes.J Phys Chem B. 2023 Jul 13;127(27):6078-6090. doi: 10.1021/acs.jpcb.3c02976. Epub 2023 Jun 27. J Phys Chem B. 2023. PMID: 37368412 Free PMC article.
-
Concentration effects of volatile anesthetics on the properties of model membranes: a coarse-grain approach.Biophys J. 2005 Mar;88(3):1524-34. doi: 10.1529/biophysj.104.044354. Epub 2004 Dec 21. Biophys J. 2005. PMID: 15613628 Free PMC article.
-
Rational Development of Liposomal Hydrogels: A Strategy for Topical Vaginal Antiretroviral Drug Delivery in the Context of HIV Prevention.Pharmaceutics. 2019 Sep 18;11(9):485. doi: 10.3390/pharmaceutics11090485. Pharmaceutics. 2019. PMID: 31540519 Free PMC article.
-
Interaction between a cationic surfactant-like peptide and lipid vesicles and its relationship to antimicrobial activity.Langmuir. 2013 Nov 19;29(46):14246-53. doi: 10.1021/la403447u. Epub 2013 Nov 8. Langmuir. 2013. PMID: 24156610 Free PMC article.
-
Under the influence of alcohol: the effect of ethanol and methanol on lipid bilayers.Biophys J. 2006 Feb 15;90(4):1121-35. doi: 10.1529/biophysj.105.062364. Epub 2005 Dec 2. Biophys J. 2006. PMID: 16326895 Free PMC article.
References
-
- Andrieux, K., L. Forte, G. Keller, C. Grabielle-Madelmont, S. Lesieur, M. Paternostre, M. Ollivon, C. Bourgaux, and P. Lesieur. 1998. Study of DPPC/TC/water phase diagram by coupling of synchrotron SAXS and DSC 1-equilibration kinetics. Progr. Colloid Polym. Sci. 110:280–284.
-
- Artzner, F., R. Zantl, and J. O. Rädler. 2000. Lipid-DNA and lipid-polyelectrolyte mesophases: structure and exchange kinetics. Cell. Mol. Biol. 46:967–978. - PubMed
-
- Auger, M., H. C. Jarrell, I. C. P. Smith, D. Siminovitch, H. H. Manscht, and P. T. T. Wong. 1988. Effects of the local anesthetic tetracaine on the structural and dynamic properties of lipids in model membranes. A high pressure Fourier transform infrared study. Biochemistry. 27:6086–6093. - PubMed
-
- Baber, J., J. F. Ellena, and D. S. Cafiso. 1995. Distribution of general anesthetics in phospholipid bilayers determined using 2H-NMR and 1H–1H NOE spectroscopy. Biochemistry. 34:6533–6539. - PubMed
MeSH terms
Substances
LinkOut - more resources
Full Text Sources
