. 2003 May;121(5):353-73.
doi: 10.1085/jgp.200208764.

The voltage-sensitive release mechanism of excitation contraction coupling in rabbit cardiac muscle is explained by calcium-induced calcium release

Affiliations

The voltage-sensitive release mechanism of excitation contraction coupling in rabbit cardiac muscle is explained by calcium-induced calcium release

H Griffiths et al. J Gen Physiol. 2003 May.

Abstract

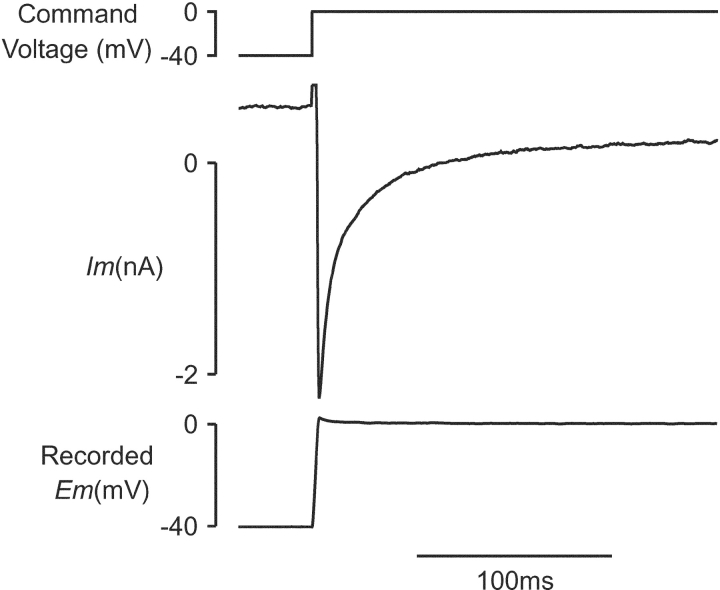
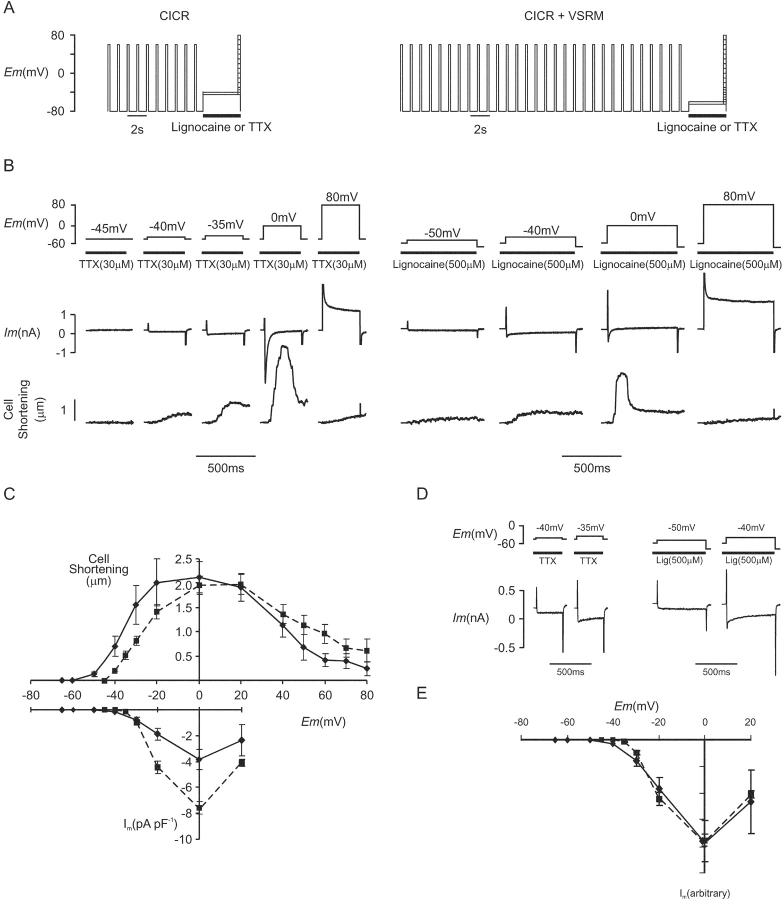
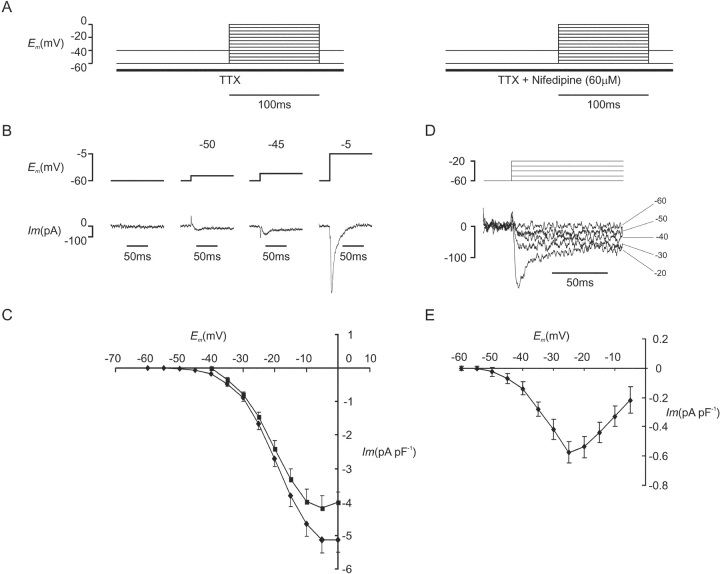
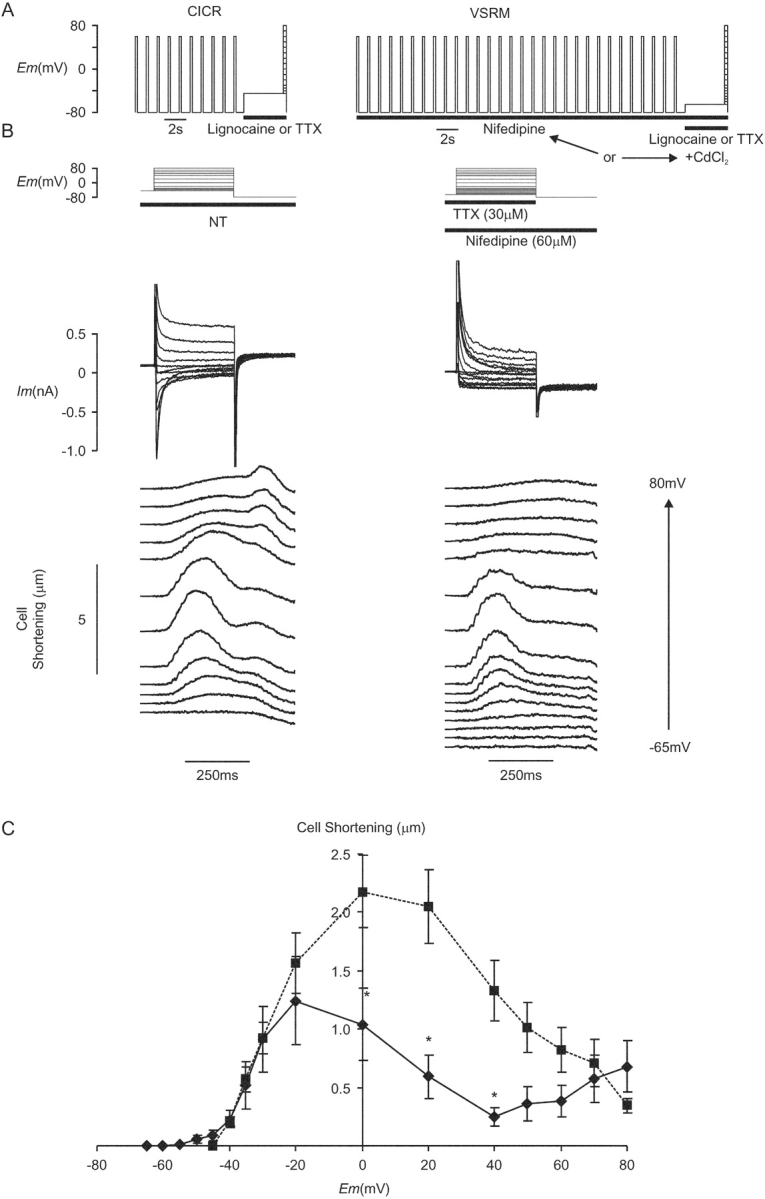
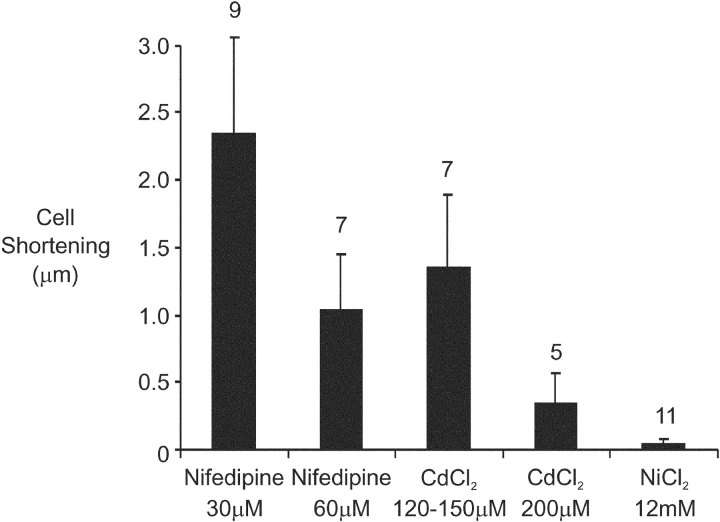
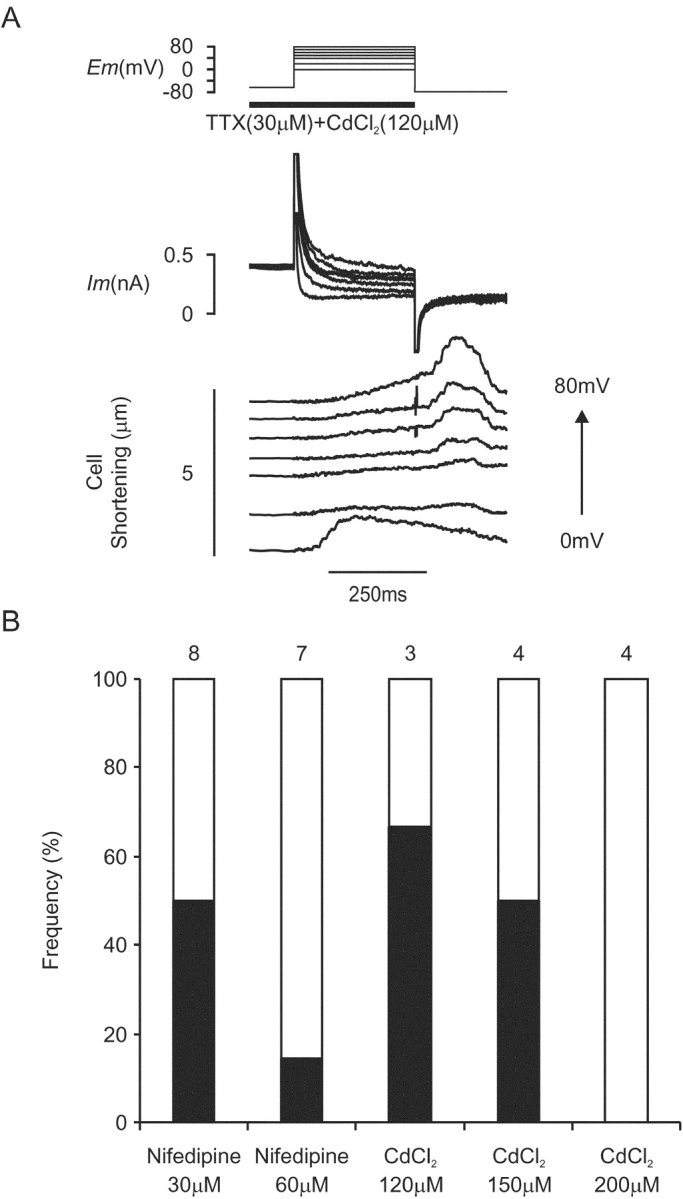
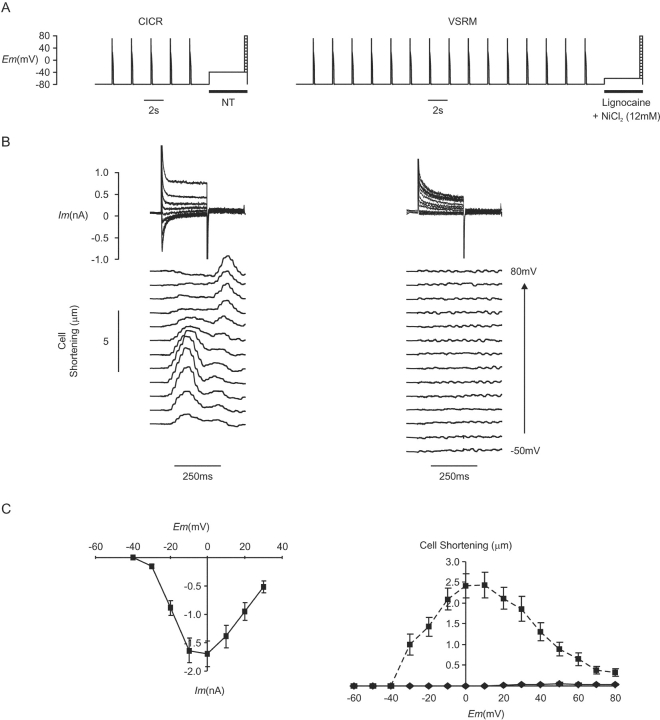
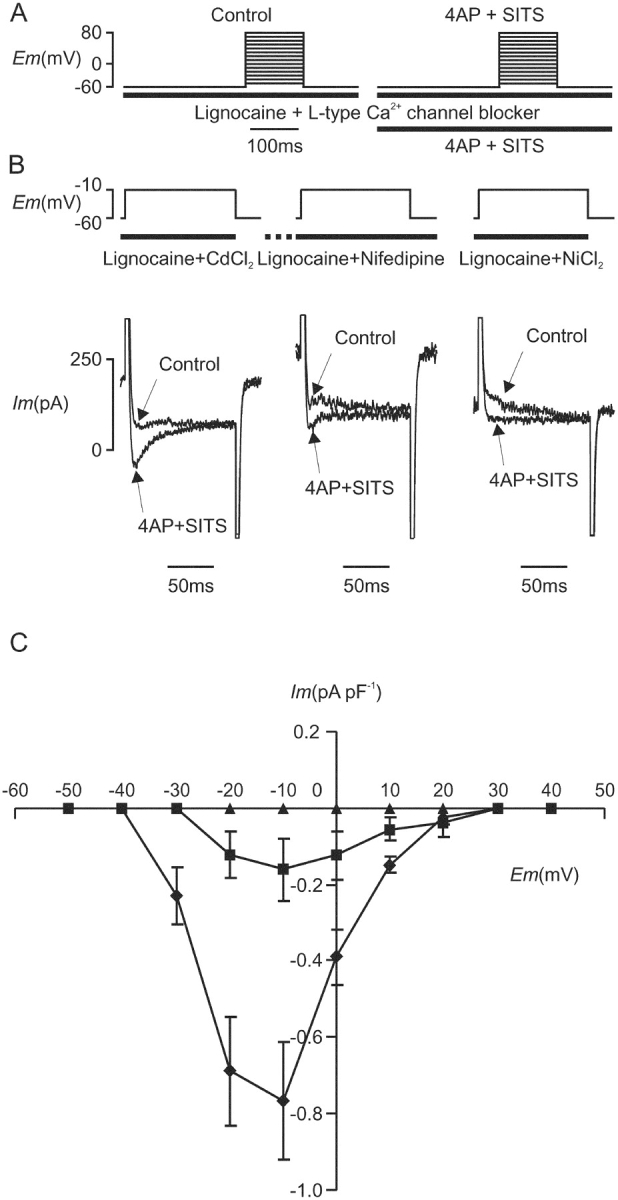
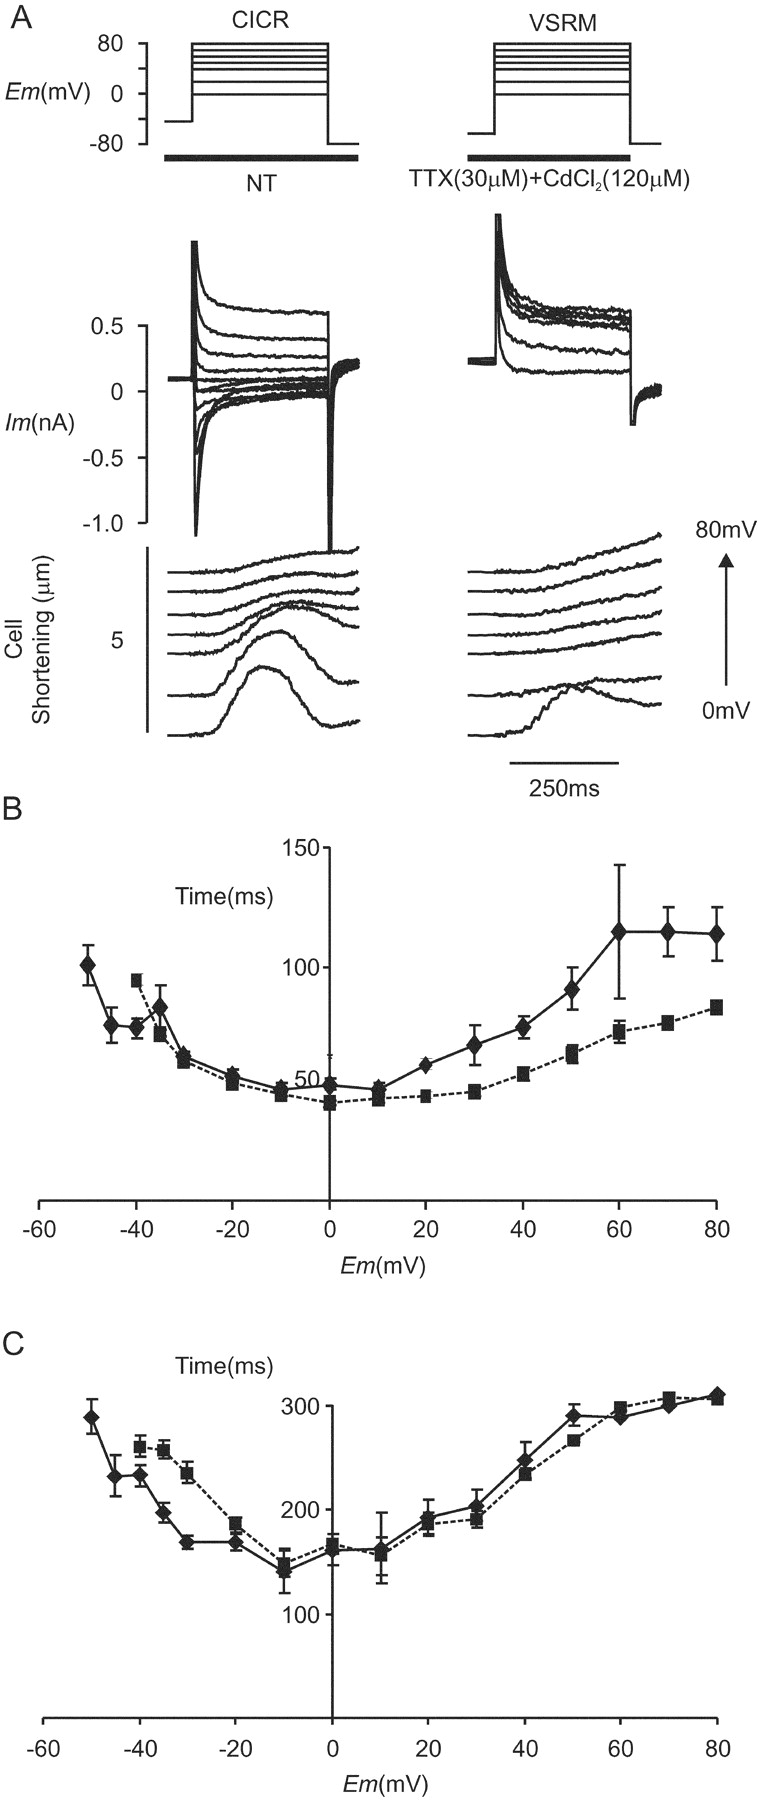
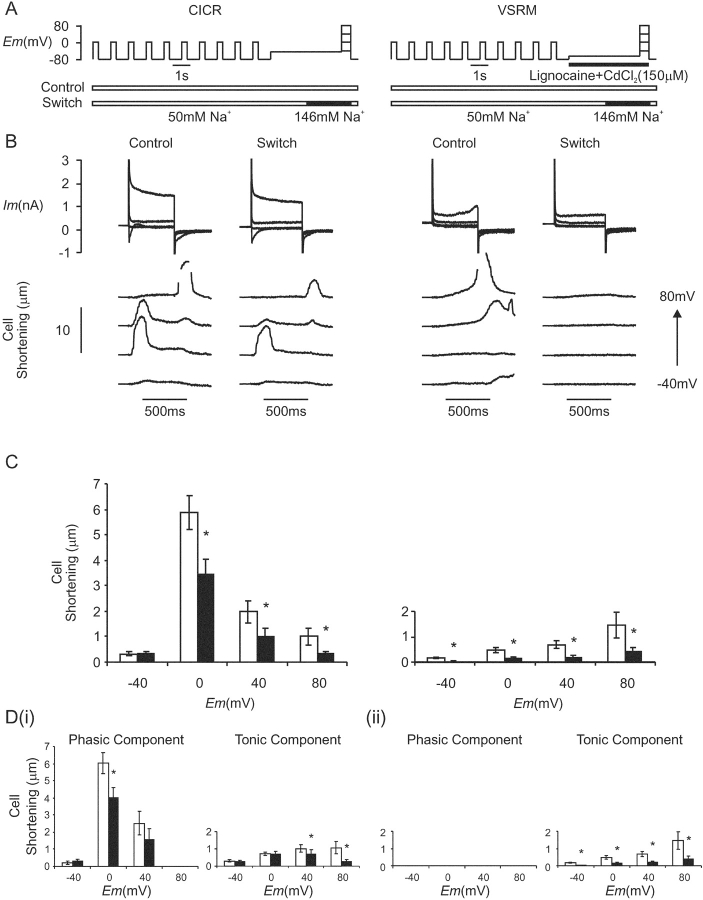
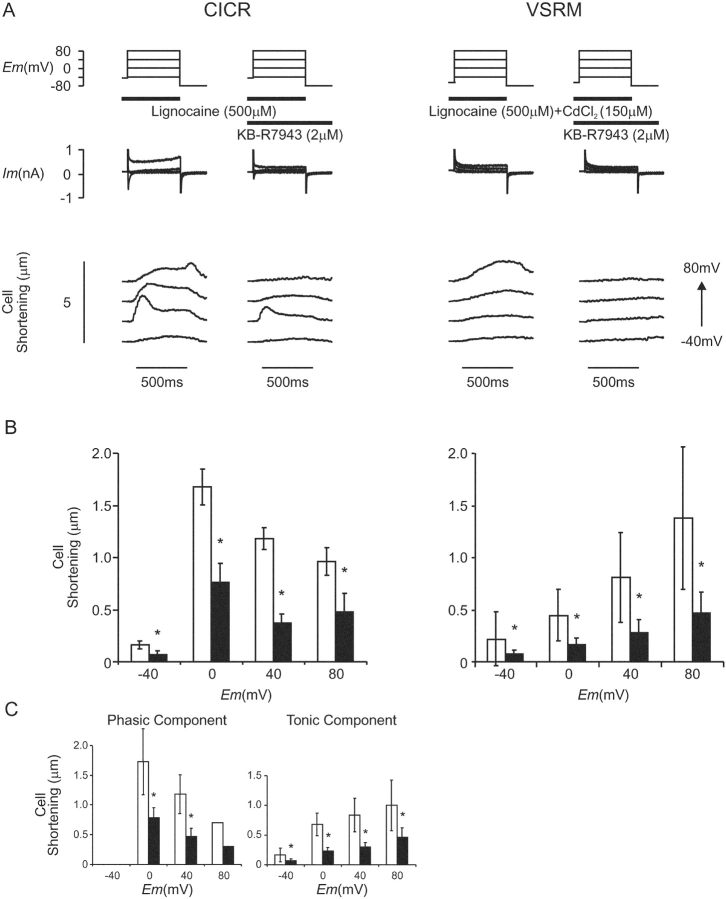
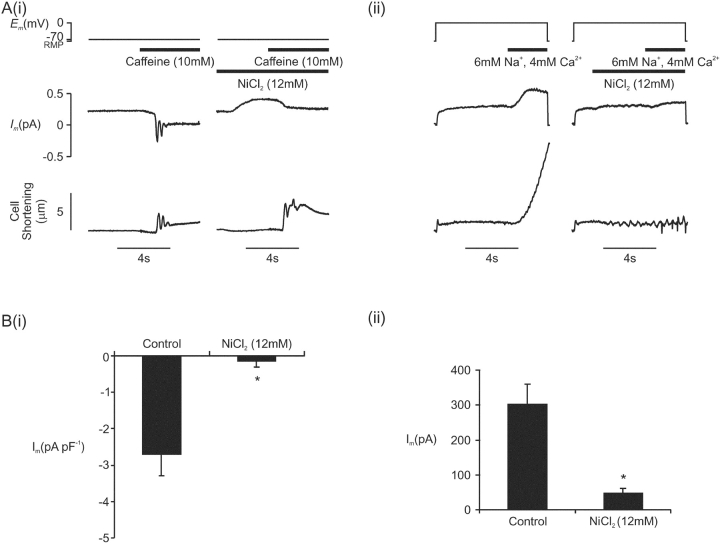
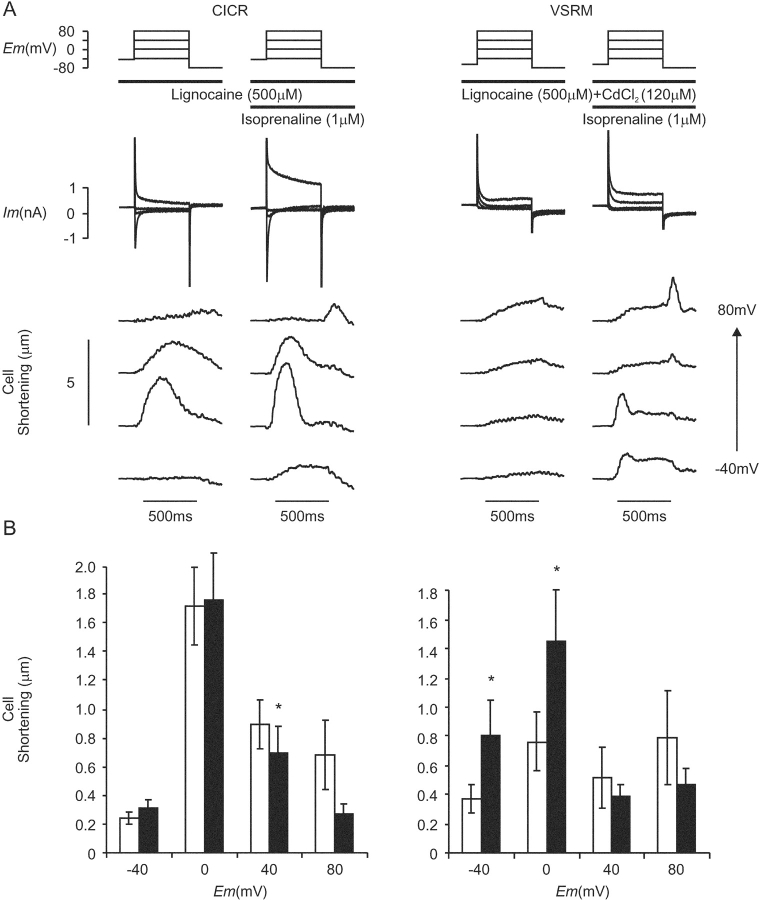
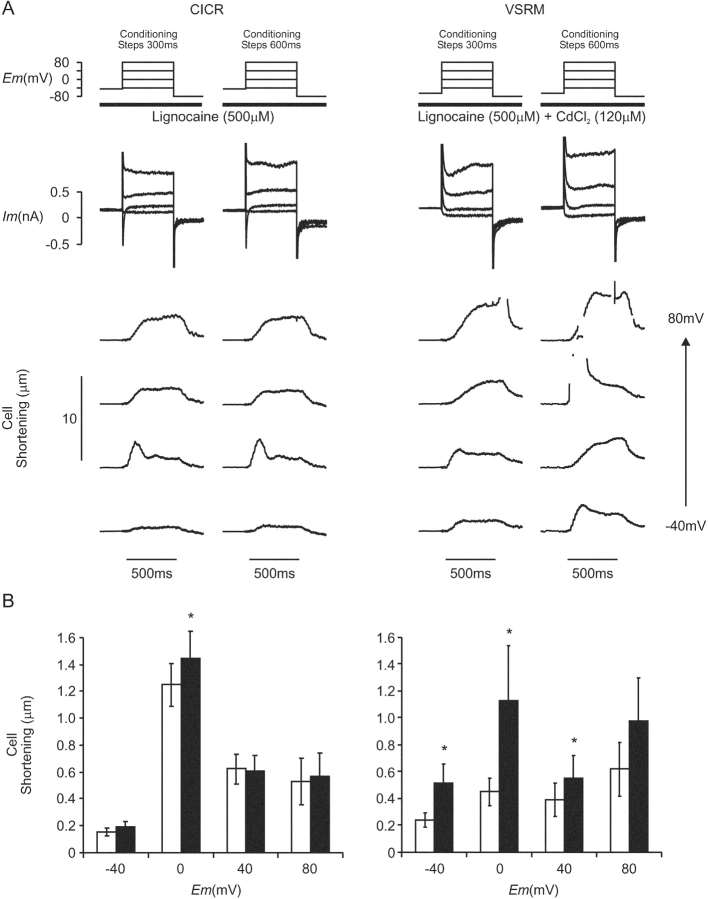
The putative voltage-sensitive release mechanism (VSRM) was investigated in rabbit cardiac myocytes at 37 degrees C with high resistance microelectrodes to minimize intracellular dialysis. When the holding potential was adjusted from -40 to -60 mV, the putative VSRM was expected to operate alongside CICR. Under these conditions however, we did not observe a plateau at positive potentials of the cell shortening versus voltage relationship. The threshold for cell shortening changed by -10 mV, but this resulted from a similar change of the threshold for activation of inward current. Cell shortening under conditions where the putative VSRM was expected to operate was blocked in a dose dependent way by nifedipine and CdCl2 and blocked completely by NiCl2. "Tail contractions" persisted in the presence of nifedipine and CdCl2 but were blocked completely by NiCl2. Block of early outward current by 4-aminopyridine and 4-acetoamido-4'-isothiocyanato-stilbene-2,2'-disulfonic acid (SITS) demonstrated persisting inward current during test depolarizations despite the presence of nifedipine and CdCl2. Inward current did not persist in the presence of NiCl2. A tonic component of cell shortening that was prominent during depolarizations to positive potentials under conditions selective for the putative VSRM was sensitive to rapidly applied changes in superfusate [Na+] and to the outward Na+/Ca2+ exchange current blocking drug KB-R7943. This component of cell shortening was thought to be the result of Na+/Ca2+ exchange-mediated excitation contraction coupling. Cell shortening recorded under conditions selective for the putative VSRM was increased by the enhanced state of phosphorylation induced by isoprenaline (1 microM) and by enhancing sarcoplasmic reticulum Ca2+ content by manipulation of the conditioning steps. Under these conditions, cell shortening at positive test depolarizations was converted from tonic to phasic. We conclude that the putative VSRM is explained by CICR with the Ca2+ "trigger" supplied by unblocked L-type Ca2+ channels and Na+/Ca2+ exchange.


Figures

F<sc>igure</sc> 1.
Figure 1.
Membrane current and recorded membrane potential during a command voltage step from −40 to 0 mV under dSEVC (Cm=165 pF). The capacitance transient in this and all subsequent current records is blanked.
F<sc>igure</sc> 2.
Figure 2.
(A) CICR protocol and protocol for CICR + VSRM combined. (B) Membrane current and cell shortening during depolarizations from a holding potential of −45 mV in the presence of TTX (30 μM) (Cm = 254 pF) and in a different cell from a holding potential of −60 mV in the presence of lignocaine (500 μM) (Cm = 180 pF). (C) I-V and cell shortening versus voltage curves for depolarizations from a holding potential of −65 or −60 mV (♦, solid line, n = 8) and a holding potential of −45 or −40 mV (▪, dashed line, n = 32). (D) Selected records from (B) redrawn to larger scale. (E) Peak inward current was scaled to show the more negative threshold for inward current with a holding potential of −65 or −60 mV.
F<sc>igure</sc> 3.
Figure 3.
(A) Voltage protocol for nifedipine-sensitive ICa(L). Inward current was elicited in the presence of TTX (30 μM) by depolarization from a holding potential of −40 mV or, in a separate population of cells, −60 mV. The protocol was repeated in the presence of nifedipine (60 μM) and L-type Ca2+ current records were obtained by subtraction. (B) Nifedipine-sensitive ICa(L), during depolarizations from a holding potential of −60 mV (Cm = 118 pF). (C) I-V curves for the phasic nifedipine sensitive current density obtained with a holding potential of −60 mV (♦, n = 19) and −40 mV (▪, n = 13). (D) Nifedipine-sensitive ICa(L), during depolarizations from a holding potential of −60 mV (Cm = 117 pF). (E) I-V curve for the steady-state nifedipine sensitive current density measured at the end of the 100-ms depolarizing step (n = 19).
F<sc>igure</sc> 4.
Figure 4.
(A) Voltage protocols for experiments under conditions selective for CICR and the putative VSRM. (B) Membrane current and cell shortening under CICR-selective conditions during superfusion with normal Tyrode solution (NT) and under conditions selective for the putative VSRM in the presence of TTX (30 μM) and nifedipine (60 μΜ) (Cm=134 pF). Each test depolarization was preceded by a conditioning protocol. For clarity, cell shortening records have been offset vertically in proportion to the test potential. (C) Maximum cell shortening versus voltage curves under paired conditions selective for CICR (▪, dashed line) and the putative VSRM (♦, solid line, n = 14, asterisk indicates significant difference at the 95% level by Student's paired t test).
F<sc>igure</sc> 5.
Figure 5.
Peak maximum cell shortening as a function of L-type Ca2+ channel blocker under conditions selective for the putative VSRM. Number of cells indicated above individual bars.
F<sc>igure</sc> 6.
Figure 6.
(A) Membrane current and cell shortening during depolarizations applied from a holding potential of −65 mV under conditions selective for the putative VSRM in the presence of TTX (30 μM) and CdCl2 (120 μM) (Cm=131 pF). Each test depolarization was preceded by a conditioning protocol. (B) Frequency histogram of repolarization induced tail contraction as a function of L-type Ca2+ channel blocker under conditions selective for the putative VSRM. Numbers above bars indicate numbers of cells exposed to each blocker.
F<sc>igure</sc> 7.
Figure 7.
(A) Voltage protocol for experiments under conditions selective for CICR and the putative VSRM in the presence of lignocaine (400 μM) and NiCl2 (12 mM). (B) Membrane current and cell shortening during paired depolarization under the selective conditions illustrated (Cm = 159 pF). (C) I-V curve under CICR-selective conditions (n = 11). Corresponding cell shortening versus voltage curves under conditions selective for CICR (▪, dashed line) and the putative VSRM (♦, solid line, n = 11).
F<sc>igure</sc> 8.
Figure 8.
(A) Voltage protocol for demonstration of unblocked inward current in the presence of L-type Ca2+ channel blockers under “Control” conditions and after treatment with “4AP + SITS” for 5 min. (B) Inward current during depolarization from −60 to −10 mV in the presence of lignocaine (500 μM) and either CdCl2 (120 μM), nifedipine (30 μM), or NiCl2 (12 mM). Records are shown before and after exposure to 4AP (5 mM) and SITS (2 mM) as indicated. (C) Corresponding I-V curves for the unblocked inward current during exposure to 4AP and SITS in the presence of CdCl2 (120 μM, ♦, n = 4), nifedipine (30 μM, ▪, n = 3), and NiCl2 (12 mM, ▴, n = 5).
F<sc>igure</sc> 9.
Figure 9.
(A) Membrane current and cell shortening during depolarization to positive potentials under conditions selective for CICR (Cm = 134 pF) and the putative VSRM (Cm = 105 pF). The record shown for CICR-selective conditions is shown for comparison and taken from Fig. 4 B. (B) Time from depolarization to onset of cell shortening for CICR (▪, dashed line, n = 31) and the putative VSRM (♦, solid line, n = 22). (C) Time from depolarization to peak cell shortening for CICR (▪, dashed line, n = 31) and the putative VSRM (♦, solid line, n = 22).
F<sc>igure</sc> 10.
Figure 10.
(A) Voltage protocol for the assessment of the effect of a rapid switch in superfusate [Na+] on cell shortening under conditions selective for CICR and the putative VSRM. Conditioning steps to 0 mV were applied before each test depolarization. The “Control” run was performed in a solution containing 50 mM Na+ before the run incorporating a rapid solution “Switch” to 146 mM Na+. This sequence was repeated under conditions selective for the putative VSRM with exposure to lignocaine (500 μM) and CdCl2 (150 μM). (B) Membrane current and cell shortening during depolarizations under the conditions described in A. Brief periods of loss of edge detection are blanked for clarity (Cm = 161 pF). (C) Paired cell shortening versus voltage relationships under conditions selective for CICR and the putative VSRM (n = 12). Open bars indicate control conditions and black bars indicate the switch to 146 mM Na+. (D, i) Phasic and tonic components of cell shortening under CICR selective conditions. Open bars indicate control conditions and black bars indicate the switch to 146 mM Na+ (asterisk indicates significant difference at the 95% level by Student's paired t test). (ii) Cell shortening under conditions selective for the VSRM consisted of a tonic component only.
F<sc>igure</sc> 11.
Figure 11.
(A) The effect of KB-R7943 (2 μM) on membrane current and cell shortening under paired conditions selective for CICR and the putative VSRM (Cm = 93 pF). Conditioning steps to 0 mV were applied before each test depolarization. Control runs under conditions selective for CICR and the putative VSRM were performed first and repeated after exposure to KB-R7943 for 3 min. (B) Paired cell shortening versus voltage relationships under conditions selective for CICR and the putative VSRM (n = 10). Open bars indicate control conditions and black bars indicate exposure to KB-R7943. (C) Phasic and tonic components of cell shortening under CICR-selective conditions. Open bars indicate control conditions and black bars indicate exposure to KB-R7943 (asterisk indicates significant difference at the 95% level by Student's paired t test). Cell shortening under conditions selective for the VSRM consisted of a tonic component only.
F<sc>igure</sc> 12.
Figure 12.
(A, i) The effect of NiCl2 (12 mM) on inward Na+/Ca2+ exchange current activated under voltage clamp at −70 mV by rapid application of caffeine (10 mM) (Cm = 164 pF). (ii) The effect of NiCl2 (12 mM) on outward Na+/Ca2+ exchange current activated under voltage clamp at 0 mV by a rapid switch to outward Na+/Ca2+ exchange activating solution (RMP = resting membrane potential). Cell shortening is shown in the bottom panel. (B, i). Peak inward Na+/Ca2+ exchange current density following application of 12 mM NiCl2 (n = 7). (ii) Peak outward Na+/Ca2+ exchange current after application of 12 mM NiCl2 (n = 7, asterisk indicates significant difference at the 95% level by Student's paired t test).
F<sc>igure</sc> 13.
Figure 13.
(A) The effect of isoprenaline (1 μM) on membrane current and cell shortening under conditions selective for CICR (Cm = 230 pF) and the putative VSRM (Cm = 158 pF). 20 conditioning steps were applied to 60 mV before the membrane was repolarized to the conditioning potential. (B) Cell shortening versus voltage relationships under conditions selective for CICR (n = 11) and the putative VSRM (n = 12). Open bars indicate control conditions and black bars indicate exposure to isoprenaline.
F<sc>igure</sc> 14.
Figure 14.
(A) The effect of prolonging conditioning steps from 300 to 600 ms on membrane current and cell shortening under conditions selective for CICR (Cm = 174 pF) and the putative VSRM (Cm=170 pF). 20 conditioning steps were applied to 60 mV before the membrane was repolarized to the conditioning potential. Brief periods of loss of edge detection are blanked for clarity. (B) Cell shortening versus voltage plots under conditions selective for CICR (n = 19) and the putative VSRM (n = 22). Open bars indicate conditioning steps of 300 ms duration and black bars indicate conditioning steps of 600 ms duration (asterisk indicates significant difference at the 95% level by Student's paired t test).

Comment in

Similar articles

Cited by

References

    1. Allen, T.J.A., and R.A. Chapman. 1992. Temperature dependence of L-type calcium currents in single isolated guinea-pig ventricular myocytes. J. Physiol. 446:554P.
    1. Barcenas Ruiz, L., D.J. Beuckelmann, and W.G. Wier. 1987. Sodium-calcium exchange in heart: membrane currents and changes in [Ca2+]i. Science. 238:1720–1722. - PubMed
    1. Barcenas Ruiz, L., and W.G. Wier. 1987. Voltage dependence of intracellular [Ca2+]i transients in guinea pig ventricular myocytes. Circ. Res. 61:148–154. - PubMed
    1. Bassani, J.W., W. Yuan, and D.M. Bers. 1995. Fractional SR Ca release is regulated by trigger Ca and SR Ca content in cardiac myocytes. Am. J. Physiol. 268:C1313–C1319. - PubMed
    1. Berlin, J.R., M.B. Cannell, and W.J. Lederer. 1987. Regulation of twitch tension in sheep cardiac Purkinje fibers during calcium overload. Am. J. Physiol. 253:H1540–H1547. - PubMed

Publication types

MeSH terms