. 2003 May;77(10):5948-63.
doi: 10.1128/jvi.77.10.5948-5963.2003.

Reovirus sigma NS and mu NS proteins form cytoplasmic inclusion structures in the absence of viral infection

Affiliations

Reovirus sigma NS and mu NS proteins form cytoplasmic inclusion structures in the absence of viral infection

Michelle M Becker et al. J Virol. 2003 May.

Abstract

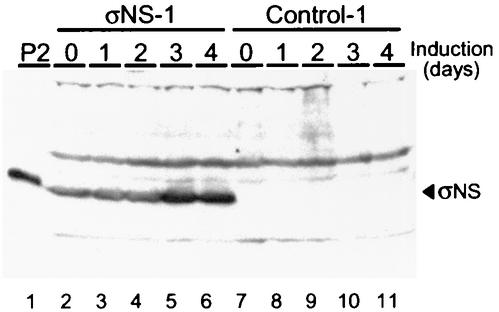
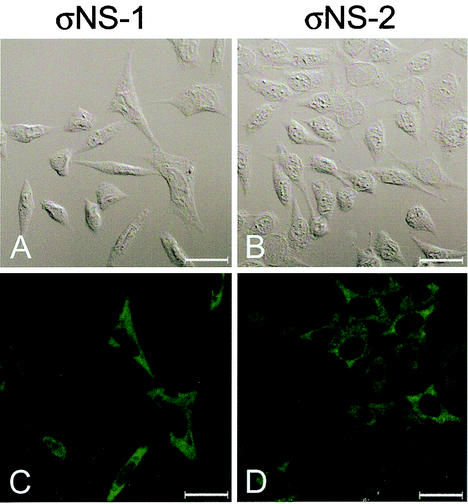
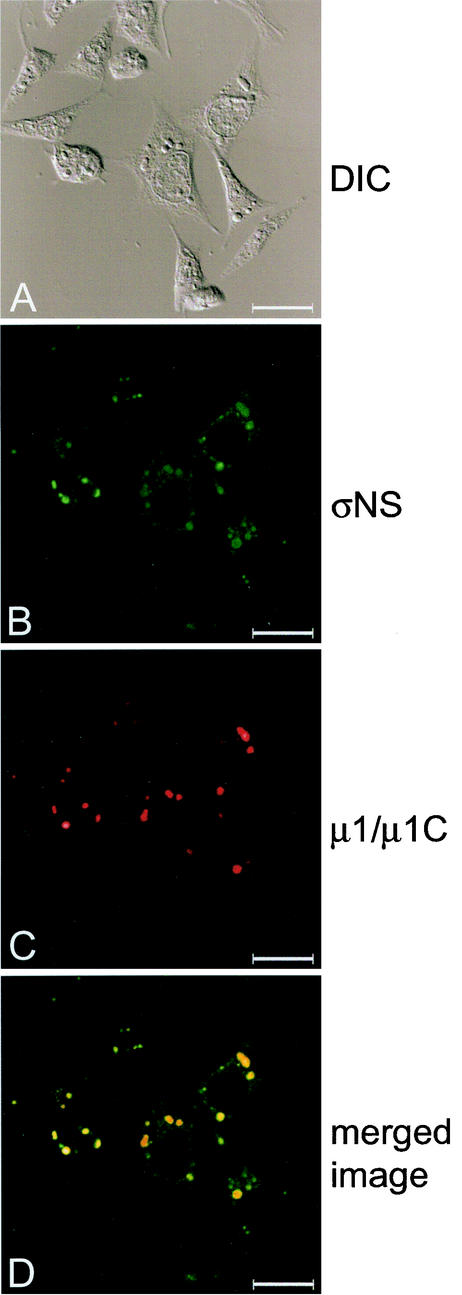
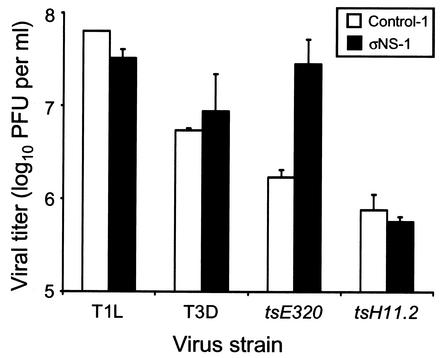
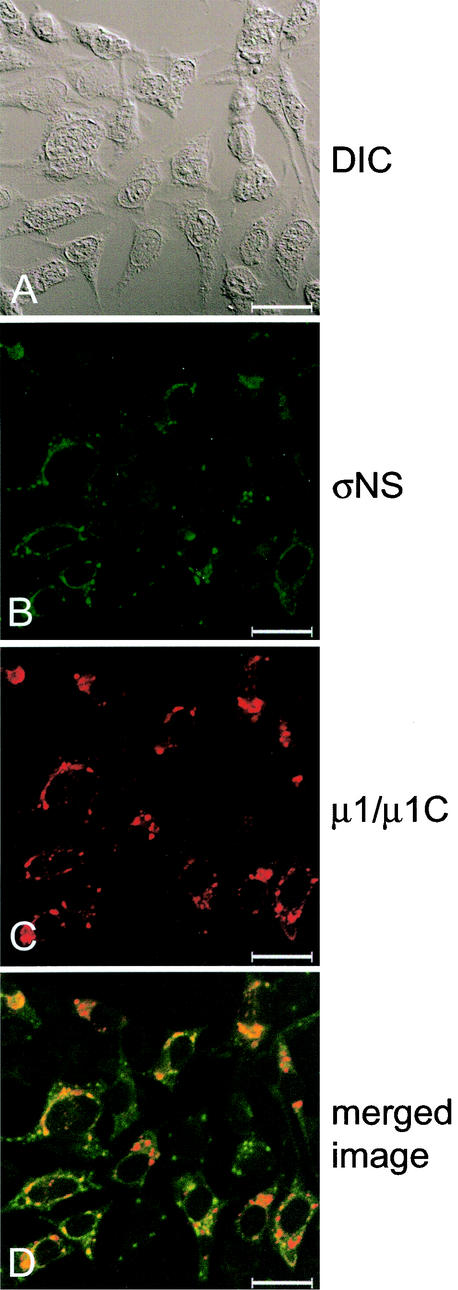
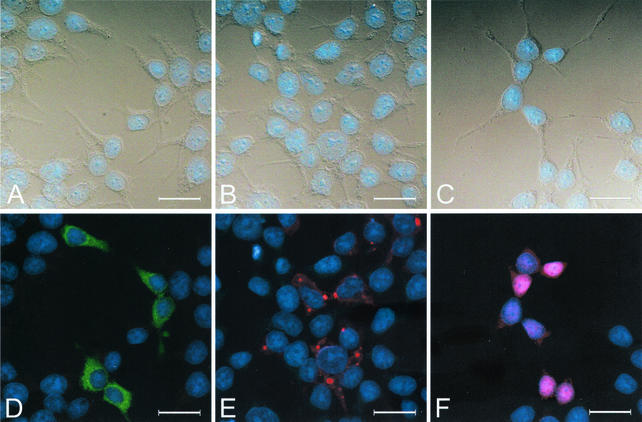
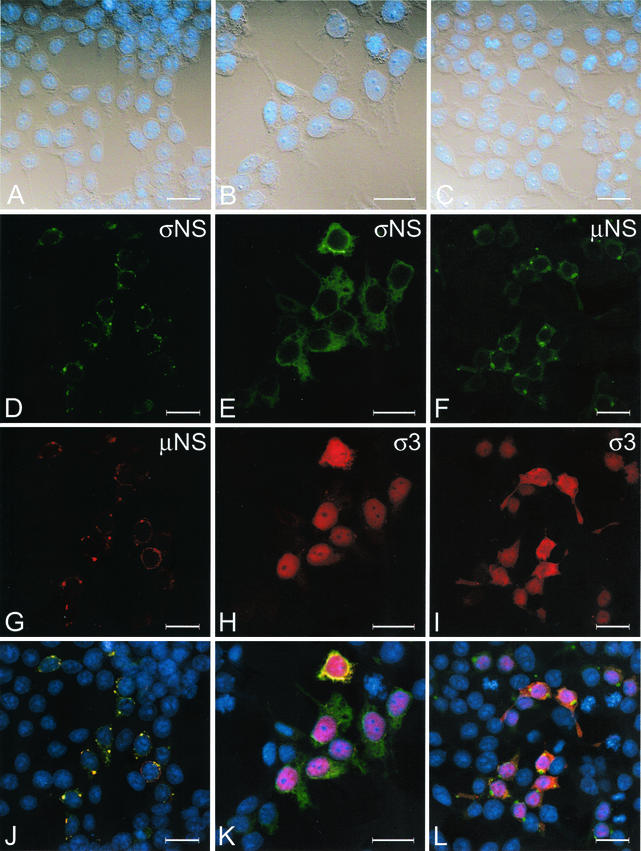
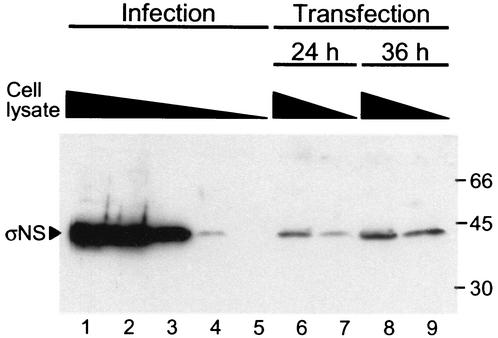
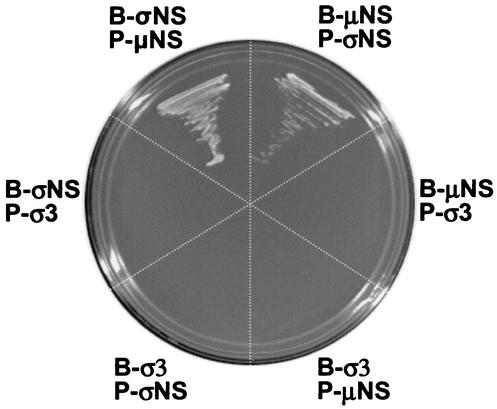
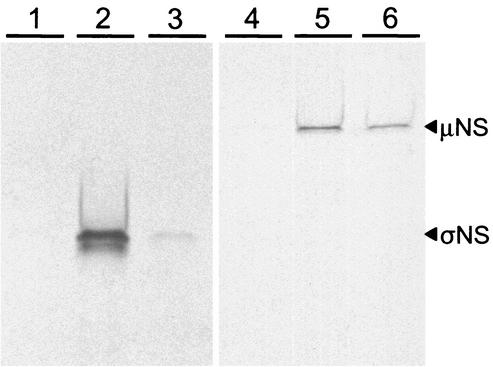
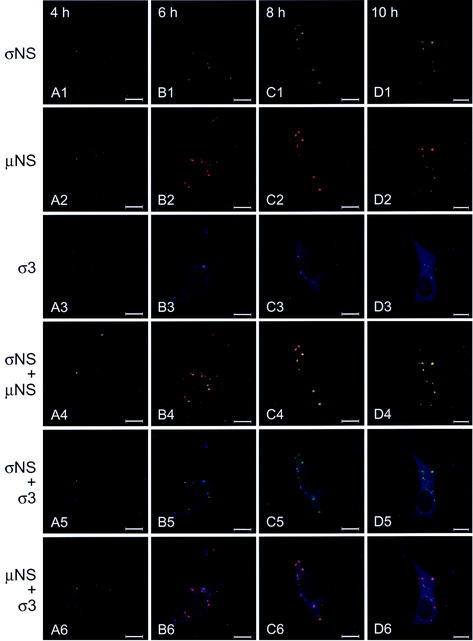
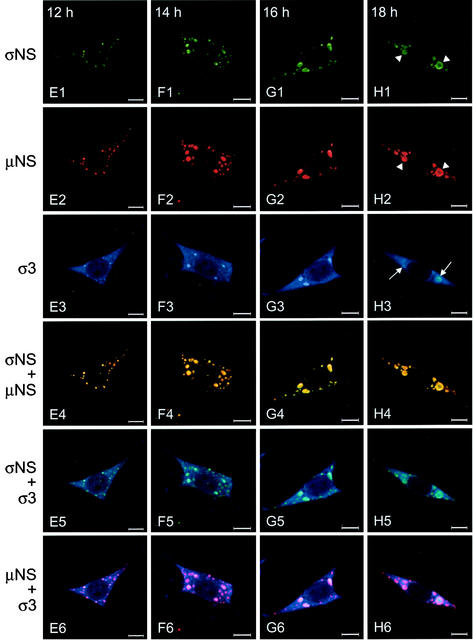
Reovirus replication occurs in the cytoplasm of infected cells and culminates in the formation of crystalline arrays of progeny virions within viral inclusions. Two viral nonstructural proteins, sigma NS and micro NS, and structural protein sigma 3 form protein-RNA complexes early in reovirus infection. To better understand the minimal requirements of viral inclusion formation, we expressed sigma NS, mu NS, and sigma 3 alone and in combination in the absence of viral infection. In contrast to its concentration in inclusion structures during reovirus replication, sigma NS expressed in cells in the absence of infection is distributed diffusely throughout the cytoplasm and does not form structures that resemble viral inclusions. Expressed sigma NS is functional as it complements the defect in temperature-sensitive, sigma NS-mutant virus tsE320. In both transfected and infected cells, mu NS is found in punctate cytoplasmic structures and sigma 3 is distributed diffusely in the cytoplasm and the nucleus. The subcellular localization of mu NS and sigma 3 is not altered when the proteins are expressed together or with sigma NS. However, when expressed with micro NS, sigma NS colocalizes with mu NS to punctate structures similar in morphology to inclusion structures observed early in viral replication. During reovirus infection, both sigma NS and mu NS are detectable 4 h after adsorption and colocalize to punctate structures throughout the viral life cycle. In concordance with these results, sigma NS interacts with mu NS in a yeast two-hybrid assay and by coimmunoprecipitation analysis. These data suggest that sigma NS and mu NS are the minimal viral components required to form inclusions, which then recruit other reovirus proteins and RNA to initiate viral genome replication.


Figures

FIG. 1.
FIG. 1.
Protein production in stably transfected control and σNS-expressing cell lines. Whole-cell lysates were obtained from the σNS-expressing cell line σNS-1 and the control cell line control-1 after induction of σNS expression by removal of doxycycline for the times shown. Total cellular protein in each lysate was normalized, resolved by SDS-PAGE, transferred to nitrocellulose, and examined for the presence of σNS by immunoblotting. In lane 1, a second-passage (P2) lysate stock of T3D was included as a source of σNS produced during viral infection. Lanes 2 through 6 contain lysates generated from σNS-1 cells uninduced and induced for 1, 2, 3, and 4 days. Lanes 7 through 11 contain lysates generated from control-1 cells uninduced and induced for 1, 2, 3, and 4 days.
FIG. 2.
FIG. 2.
Subcellular localization of σNS protein in L cells stably transfected with a T3D S3 cDNA. σNS-1 (A and C) and σNS-2 (B and D) cells were induced by the removal of doxycycline for 2 days and then fixed. Cells were stained for σNS with σNS-specific polyclonal rabbit antiserum as the primary antibody and goat anti-rabbit Alexa Fluor 488 as the secondary antibody. A DIC image of each field was obtained (A and B). Images were obtained with a confocal microscope. The σNS protein is colored green. Images were processed with Adobe Photoshop. Bars, 25 μm.
FIG.3.
FIG.3.
Subcellular localization of σNS and μ1/μ1C proteins in σNS-expressing cells infected with T3D. σNS-1 cells were induced by the removal of doxycycline for 2 days and infected with T3D at an MOI of 10 PFU/cell. Following incubation at 37°C for 18 h, cells were stained for σNS with σNS-specific polyclonal guinea pig antiserum and for μ1/μ1C with μ1/μ1C-specific MAb 8H6. The secondary antibodies used were goat anti-guinea pig Alexa Fluor 488 and goat anti-mouse Alexa Fluor 546. Images were obtained with a confocal microscope. The σNS protein is colored green (B), and the μ1/μ1C protein is colored red (C). In the merged image (D), colocalization of σNS and μ1/μ1C is indicated by the color yellow. A DIC image of each field was obtained (A). Images were processed with Adobe Photoshop. Bars, 25 μm.
FIG. 4.
FIG. 4.
Growth of wt and ts mutant viruses in control and stably transfected σNS-expressing cells. Monolayer cultures of control-1 and σNS-1 cells (5 × 10⁵) were infected with T1L, T3D, tsE320, or tsH11.2 at an MOI of 10 PFU/cell. Cultures infected with T1L and T3D were incubated at 37°C for 24 h, and cultures infected with tsE320 and tsH11.2 were incubated at 39.5°C for 24 h. Virus titer was determined by plaque assay with L cells incubated at 37°C for T1L and T3D and at 32°C for tsE320 and tsH11.2. The results presented are the mean viral titers of at least six independent wells. Error bars indicate standard deviations of the means.
FIG.5.
FIG.5.
Subcellular localization of σNS and μ1/μ1C proteins in σNS-expressing cells infected with tsE320. σNS-1 cells were induced by the removal of doxycycline for 2 days, infected with tsE320 at an MOI of 10 PFU/cell, and incubated at 39.5°C for 24 h. Cells were stained for σNS with σNS-specific polyclonal guinea pig antiserum and for μ1/μ1C with μ1/μ1C-specific MAb 8H6. The secondary antibodies used were goat anti-guinea pig Alexa Fluor 488 and goat anti-mouse Alexa Fluor 546. Images were obtained with a confocal microscope. The σNS protein is colored green (B), and the μ1/μ1C protein is colored red (C). In the merged image (D), colocalization of σNS and μ1/μ1C is indicated by the color yellow. A DIC image of each field was obtained (A). Images were processed with Adobe Photoshop. Bars, 25 μm.
FIG. 6.
FIG. 6.
Subcellular localization of σNS, μNS, and σ3 in 293T cells transfected with plasmids encoding each protein. 293T cells were transfected with a plasmid encoding σNS (A and D), μNS (B and E), or σ3 (C and F) and fixed 36 h after transfection. Cells were stained for σNS with σNS-specific polyclonal guinea pig antiserum, for μNS with μNS-specific polyclonal rabbit antiserum, and for σ3 with σ3-specific MAb 4F2. The secondary antibodies used were goat anti-guinea pig Alexa Fluor 488, goat anti-rabbit Alexa Fluor 488, goat anti-mouse Alexa Fluor 488, and dsDNA-specific dye TO-PRO3. Images were obtained with a confocal microscope. The σNS protein is colored green (D), the μNS protein is colored red (E), the σ3 protein is colored red (F), and nuclei are colored blue (A to F). A DIC image of each field was obtained (A, B, and C). Images were processed with Adobe Photoshop. Bars, 25 μm.
FIG.7.
FIG.7.
Subcellular localization of σNS, μNS, and σ3 in 293T cells transfected with plasmids encoding each protein in pairs. 293T cells were transfected with plasmids encoding σNS and μNS (A, D, G, and J), σNS and σ3 (B, E, H, and K), or μNS and σ3 (C, F, I, and L) and fixed 36 h after transfection. Cells were stained for σNS with σNS-specific polyclonal guinea pig antiserum, for μNS with μNS-specific polyclonal rabbit antiserum, and for σ3 with σ3-specific MAb 4F2. The secondary antibodies used were goat anti-guinea pig Alexa Fluor 488 and goat anti-rabbit Alexa Fluor 546, goat anti-guinea pig Alexa Fluor 546 and goat anti-mouse Alexa Fluor 488, goat anti-rabbit Alexa Fluor 488 and goat anti-mouse Alexa Fluor 546, and dsDNA-specific dye TO-PRO3. Images were obtained with a confocal microscope. The σNS protein is colored green (D, E), the μNS protein is colored green (F) or red (G), the σ3 protein is colored red (H and I), and nuclei are colored blue (A to C and J to L). In the merged images, colocalization of σNS and μNS (J), σNS and σ3 (K), or μNS and σ3 (L) is indicated by the color yellow. A DIC image of each field was obtained (A through C). Images were processed with Adobe Photoshop. Bars, 25 μm.
FIG. 8.
FIG. 8.
Comparison of σNS levels in infected and transfected cells. 293T cells were either infected with T3D at an MOI of 10 PFU/cell or transfected with a σNS-encoding plasmid and maintained at 37°C. Infected cells were harvested 18 h postadsorption, and transfected cells were harvested at 24 and 36 h posttransfection. Cells were lysed, sheared, diluted in 10-fold increments in lysis buffer, and resolved by SDS-PAGE. Undiluted samples were normalized for protein concentration prior to dilution. Proteins were transferred to nitrocellulose and probed with guinea pig σNS-specific antiserum. Protein molecular mass standards (in kilodaltons) are shown on the right. Lanes: 1, infected and undiluted; 2, infected and diluted 1:10; 3, infected and diluted 1:100; 4, infected and diluted 1:1,000; 5, infected and diluted 1:10,000; 6, transfected for 24 h and undiluted; 7, transfected for 24 h and diluted 1:10; 8, transfected for 36 h and undiluted; 9, transfected for 36 h and diluted 1:10.
FIG. 9.
FIG. 9.
Reovirus σNS and μNS proteins interact in direct yeast two-hybrid tests. Reovirus σNS-, μNS-, and σ3-encoding bait (B) and prey (P) plasmids were used to transform yeast strain AH109 in pairwise combinations. Transformants expressing both bait and prey plasmids were selected by growth on medium lacking tryptophan and leucine. Protein interactions were evaluated by growth on medium lacking tryptophan, leucine, adenine, and histidine. Rescue of growth on selective medium was achieved by coexpression of σNS and μNS.
FIG. 10.
FIG. 10.
Coimmunoprecipitation of reovirus σNS and μNS proteins. Radiolabeled HA-σNS or HA-μNS was incubated in pairwise combinations with unlabeled c-Myc-lamin C, c-Myc-σNS, or c-Myc-μNS. Anti-c-Myc antibody was used for immunoprecipitation, and binding was analyzed by SDS-PAGE and autoradiography. Lanes: 1, c-Myc-lamin C and HA-σNS; 2, c-Myc-σNS and HA-σNS; 3, c-Myc-μNS and HA-σNS; 4, c-Myc-lamin C and HA-μNS; 5, c-Myc-σNS and HA-μNS; 6, c-Myc-μNS and HA-μNS.
FIG.11.
FIG.11.
Subcellular localization of σNS, μNS, and σ3 proteins in L cells at different times postinfection with T3D. L cells were infected with T3D at an MOI of 10 PFU/cell and incubated at 37°C for the times shown. Cells were stained for σNS with σNS-specific polyclonal guinea pig antiserum, for μNS with μNS-specific polyclonal rabbit antiserum, and for σ3 with σ3-specific MAb 4F2. The secondary antibodies used were goat anti-guinea pig Alexa Fluor 546, goat anti-rabbit Alexa Fluor 488, and goat anti-mouse Alexa Fluor 647. Images were obtained with a confocal microscope. The σNS protein is colored green (A1 to H1), the μNS protein is colored red (A2 to H2), and the σ3 protein is colored blue (A3 to H3). In the merged images, colocalization of σNS and μNS is indicated by the color yellow (A4 to H4), colocalization of σNS and σ3 is indicated by the color blue-green (A5 to H5), and colocalization of μNS and σ3 is indicated by the color purple (A6 to H6). Arrowheads indicate the presence of σNS (H1) and μNS (H2) at the periphery of mature viral inclusions; arrows (H3) indicate the presence of σ3 in the interior of mature viral inclusions. Images were processed with Adobe Photoshop. Bars, 10 μm.
FIG.11.
FIG.11.
Subcellular localization of σNS, μNS, and σ3 proteins in L cells at different times postinfection with T3D. L cells were infected with T3D at an MOI of 10 PFU/cell and incubated at 37°C for the times shown. Cells were stained for σNS with σNS-specific polyclonal guinea pig antiserum, for μNS with μNS-specific polyclonal rabbit antiserum, and for σ3 with σ3-specific MAb 4F2. The secondary antibodies used were goat anti-guinea pig Alexa Fluor 546, goat anti-rabbit Alexa Fluor 488, and goat anti-mouse Alexa Fluor 647. Images were obtained with a confocal microscope. The σNS protein is colored green (A1 to H1), the μNS protein is colored red (A2 to H2), and the σ3 protein is colored blue (A3 to H3). In the merged images, colocalization of σNS and μNS is indicated by the color yellow (A4 to H4), colocalization of σNS and σ3 is indicated by the color blue-green (A5 to H5), and colocalization of μNS and σ3 is indicated by the color purple (A6 to H6). Arrowheads indicate the presence of σNS (H1) and μNS (H2) at the periphery of mature viral inclusions; arrows (H3) indicate the presence of σ3 in the interior of mature viral inclusions. Images were processed with Adobe Photoshop. Bars, 10 μm.

Similar articles

Cited by

References

    1. Antczak, J. B., and W. K. Joklik. 1992. Reovirus genome segment assortment into progeny genomes studied by the use of monoclonal antibodies directed against reovirus proteins. Virology 187:760-776. - PubMed
    1. Aponte, C., D. Poncet, and J. Cohen. 1996. Recovery and characterization of a replicase complex in rotavirus-infected cells by using a monoclonal antibody against NSP2. J. Virol. 70:985-991. - PMC - PubMed
    1. Astell, C., S. C. Silverstein, D. H. Levin, and G. Acs. 1972. Regulation of the reovirus RNA transcriptase by a viral capsomere protein. Virology 48:648-654. - PubMed
    1. Baer, G. S., and T. S. Dermody. 1997. Mutations in reovirus outer-capsid protein σ3 selected during persistent infections of L cells confer resistance to protease inhibitor E64. J. Virol. 71:4921-4928. - PMC - PubMed
    1. Baer, G. S., D. H. Ebert, C. J. Chung, A. H. Erickson, and T. S. Dermody. 1999. Mutant cells selected during persistent reovirus infection do not express mature cathepsin L and do not support reovirus disassembly. J. Virol. 73:9532-9543. - PMC - PubMed

Publication types

MeSH terms

Substances