

Discordant outcomes following failure of antiretroviral therapy are associated with substantial differences in human immunodeficiency virus-specific cellular immunity
- PMID: 12719595
- PMCID: PMC154002
- DOI: 10.1128/jvi.77.10.6041-6049.2003
Discordant outcomes following failure of antiretroviral therapy are associated with substantial differences in human immunodeficiency virus-specific cellular immunity
Abstract
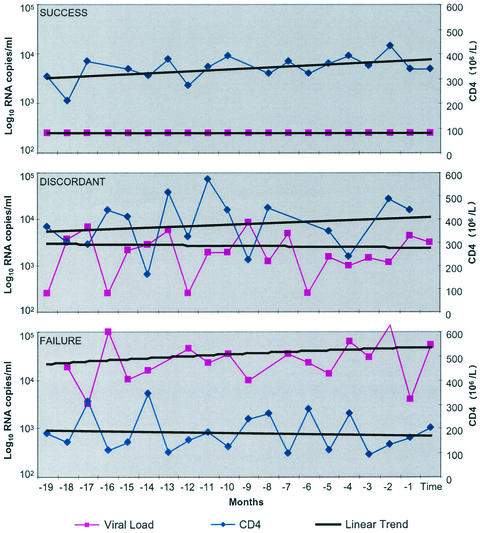
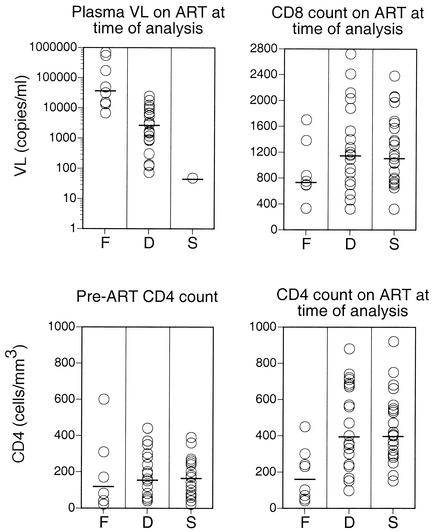
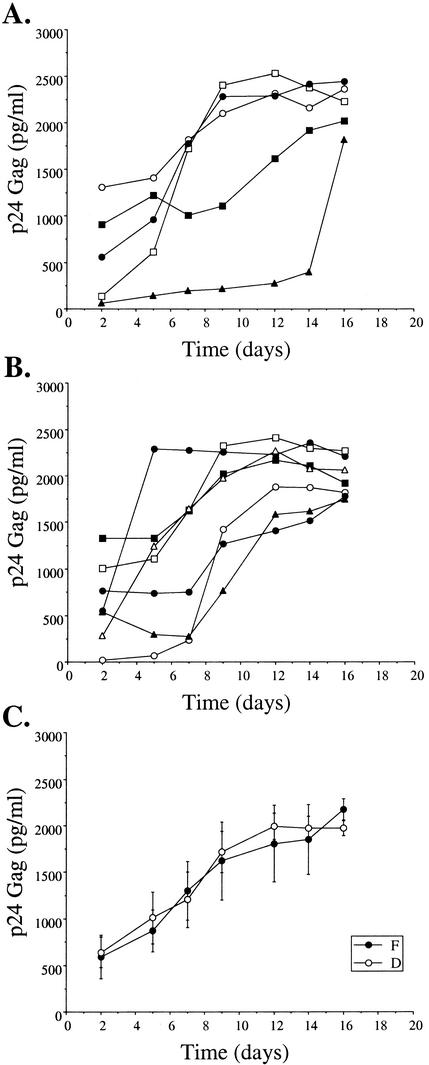
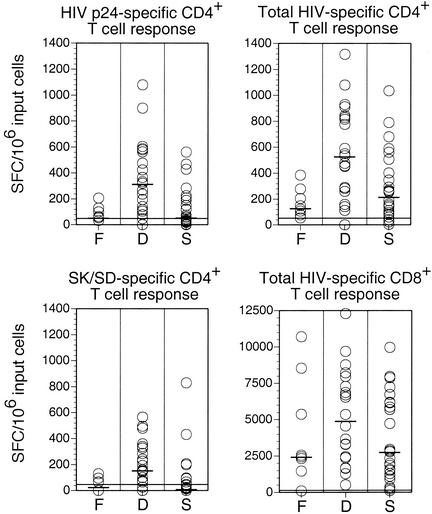
Many individuals chronically infected with human immunodeficiency virus type 1 (HIV-1) experience a recrudescence of plasma virus during continuous combination antiretroviral therapy (ART) due either to the emergence of drug-resistant viruses or to poor compliance. In most cases, virologic failure on ART is associated with a coincident decline in CD4(+) T lymphocyte levels. However, a proportion of discordant individuals retain a stable or even increasing CD4(+) T lymphocyte count despite virological failure. In order to address the nature of these different outcomes, we evaluated virologic and immunologic variables in a prospective, single-blinded, nonrandomized cohort of 53 subjects with chronic HIV-1 infection who had been treated with continuous ART and monitored intensively over a period of 19 months. In all individuals with detectable viremia on ART, multiple drug resistance mutations with similar impacts on viral growth kinetics were detected in the pol gene of circulating plasma virus. Further, C2V3 env gene analysis demonstrated sequences indicative of CCR5 coreceptor usage in the majority of those with detectable plasma viremia. In contrast to this homogeneous virologic pattern, comprehensive screening with a range of antigens derived from HIV-1 revealed substantial immunologic differences. Discordant subjects with stable CD4(+) T lymphocyte counts in the presence of recrudescent virus demonstrated potent virus-specific CD4(+) and CD8(+) T lymphocyte responses. In contrast, subjects with virologic failure associated with declining CD4(+) T lymphocyte counts had substantially weaker HIV-specific CD4(+) T lymphocyte responses and exhibited a trend towards weaker HIV-specific CD8(+) T lymphocyte responses. Importantly the CD4(+) response was sustained over periods as long as 11 months, confirming the stability of the phenomenon. These correlative data lead to the testable hypothesis that the consequences of viral recrudescence during continuous ART are modulated by the HIV-specific cellular immune response.
Figures
Similar articles
-
Immune reconstitution in HIV-1 infected children with discordant response to antiretroviral therapies: patterns of HIV-1 env gene evolution driven by restoration of thymic function.New Microbiol. 2004 Apr;27(2 Suppl 1):99-104. New Microbiol. 2004. PMID: 15646071
-
HIV-1 co-receptor usage based on V3 loop sequence analysis: preferential suppression of CXCR4 virus post HAART?Immunol Invest. 2011;40(6):597-613. doi: 10.3109/08820139.2011.569673. Epub 2011 Apr 25. Immunol Invest. 2011. PMID: 21513481 Clinical Trial.
-
Residual HIV-specific CD4 and CD8 T cell frequencies after prolonged antiretroviral therapy reflect pretreatment plasma virus load.AIDS. 2002 Nov 22;16(17):2317-22. doi: 10.1097/00002030-200211220-00012. AIDS. 2002. PMID: 12441804
-
Study of the impact of HIV genotypic drug resistance testing on therapy efficacy.Verh K Acad Geneeskd Belg. 2001;63(5):447-73. Verh K Acad Geneeskd Belg. 2001. PMID: 11813503 Review.
-
Harnessing CD8+ T Cells Under HIV Antiretroviral Therapy.Front Immunol. 2019 Feb 26;10:291. doi: 10.3389/fimmu.2019.00291. eCollection 2019. Front Immunol. 2019. PMID: 30863403 Free PMC article. Review.
Cited by
-
The influence of depressive symptoms and substance use on adherence to antiretroviral therapy. A cross-sectional prevalence study.Sao Paulo Med J. 2015 May-Jun;133(3):179-86. doi: 10.1590/1516-3180.2013.7450010. Epub 2014 Sep 19. Sao Paulo Med J. 2015. PMID: 25250800 Free PMC article.
-
Preferential infection shortens the life span of human immunodeficiency virus-specific CD4+ T cells in vivo.J Virol. 2006 Jul;80(14):6801-9. doi: 10.1128/JVI.00070-06. J Virol. 2006. PMID: 16809286 Free PMC article.
-
Sequential emergence and clinical implications of viral mutants with K70E and K65R mutation in reverse transcriptase during prolonged tenofovir monotherapy in rhesus macaques with chronic RT-SHIV infection.Retrovirology. 2007 Apr 6;4:25. doi: 10.1186/1742-4690-4-25. Retrovirology. 2007. PMID: 17417971 Free PMC article.
-
Antiretroviral drug therapy alters the profile of human immunodeficiency virus type 1-specific T-cell responses and shifts the immunodominant cytotoxic T-lymphocyte response from Gag to Pol.J Virol. 2007 Oct;81(20):11543-8. doi: 10.1128/JVI.00779-07. Epub 2007 Aug 1. J Virol. 2007. PMID: 17670829 Free PMC article.
-
Patients with discordant responses to antiretroviral therapy have impaired killing of HIV-infected T cells.PLoS Pathog. 2010 Nov 24;6(11):e1001213. doi: 10.1371/journal.ppat.1001213. PLoS Pathog. 2010. PMID: 21124822 Free PMC article.
References
-
- Autran, B., G. Carcelain, T. S. Li, C. Blanc, D. Mathez, R. Tubiana, C. Katlama, P. Debre, and J. Leibowitch. 1997. Positive effects of combined antiretroviral therapy on CD4+ T cell homeostasis and function in advanced HIV disease. Science 277:112-116. - PubMed
-
- Berkhout, B. 1999. HIV-1 evolution under pressure of protease inhibitors: climbing the stairs of viral fitness. J. Biomed. Sci. 6:298-305. - PubMed
-
- Boucher, C. A., W. Keulen, T. van Bommel, M. Nijhuis, D. de Jong, M. D. de Jong, P. Schipper, and N. K. Back. 1996. Human immunodeficiency virus type 1 drug susceptibility determination by using recombinant viruses generated from patient sera tested in a cell-killing assay. Antimicrob. Agents Chemother. 40:2404-2409. - PMC - PubMed
-
- Carpenter, C. C., M. A. Fischl, S. M. Hammer, M. S. Hirsch, D. M. Jacobsen, D. A. Katzenstein, J. S. Montaner, D. D. Richman, M. S. Saag, R. T. Schooley, M. A. Thompson, S. Vella, P. G. Yeni, and P. A. Volberding. 1997. Antiretroviral therapy for HIV infection in 1997. Updated recommendations of the International AIDS Society-USA panel. JAMA 277:1962-1969. - PubMed
Publication types
MeSH terms
Substances
LinkOut - more resources
Full Text Sources
Other Literature Sources
Medical
Research Materials
