

Optical-CT gel-dosimetry I: basic investigations
- PMID: 12722814
- PMCID: PMC1616153
- DOI: 10.1118/1.1559835
Optical-CT gel-dosimetry I: basic investigations
Abstract
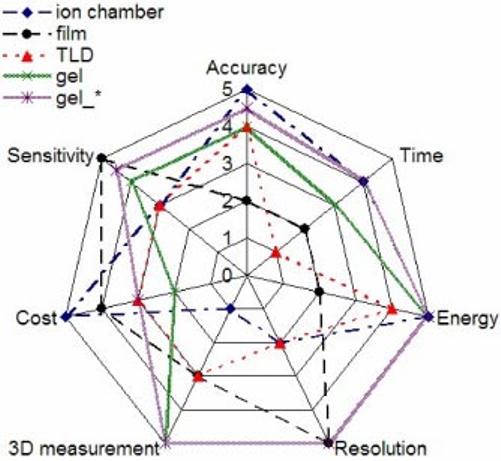
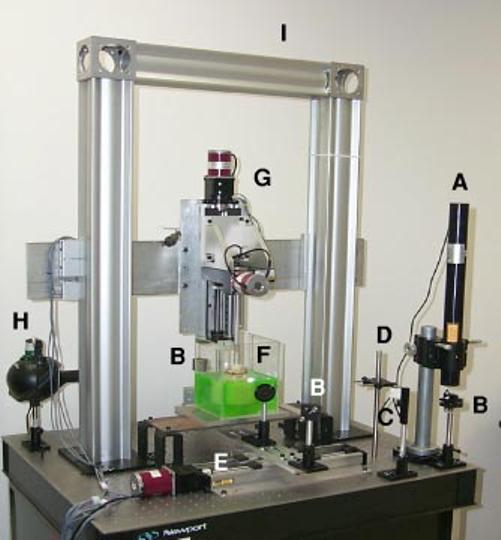
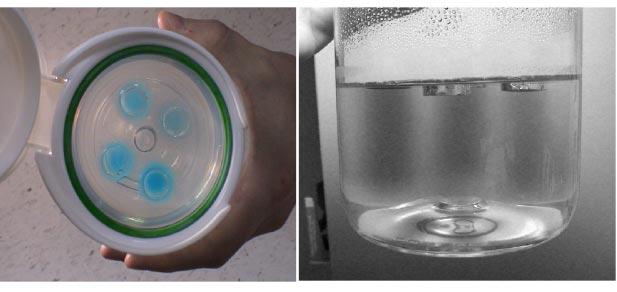
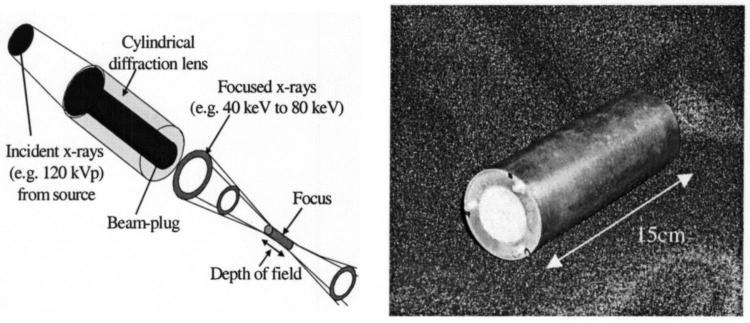
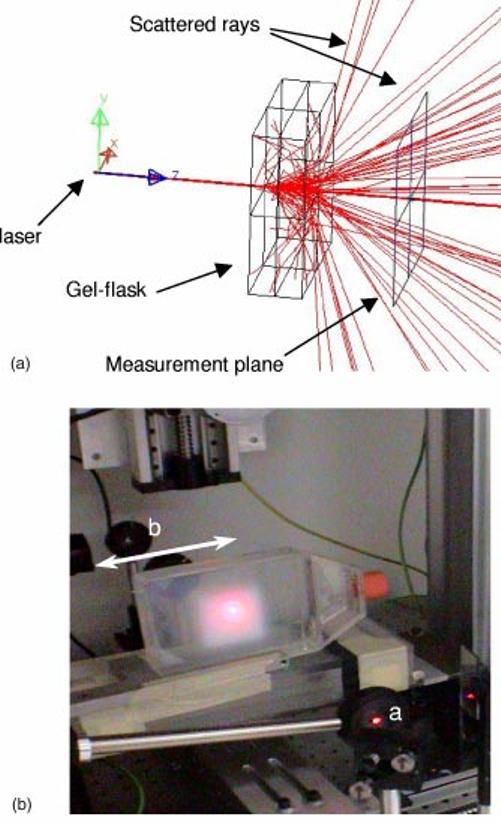
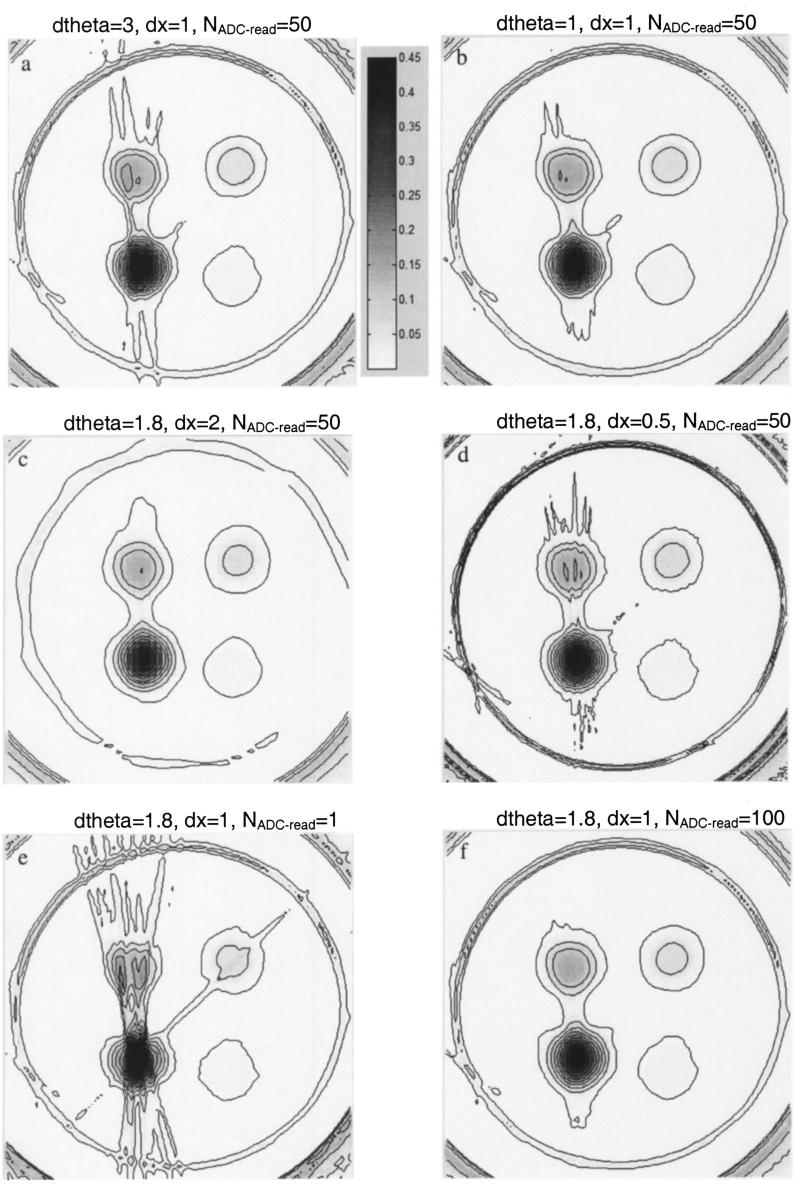
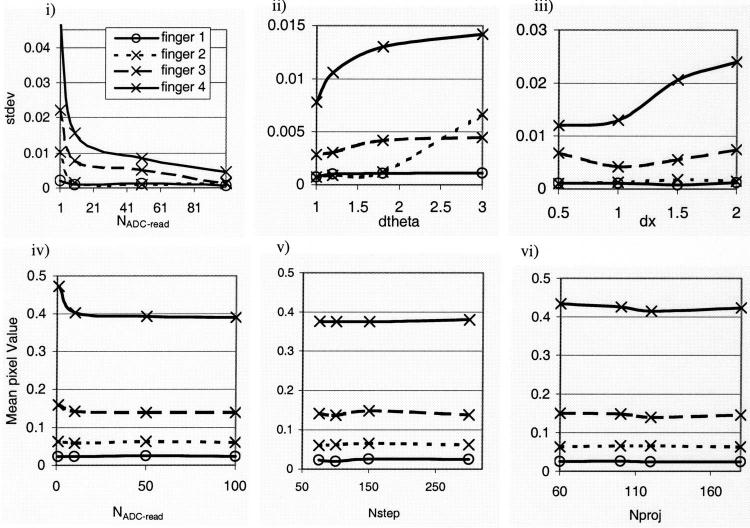
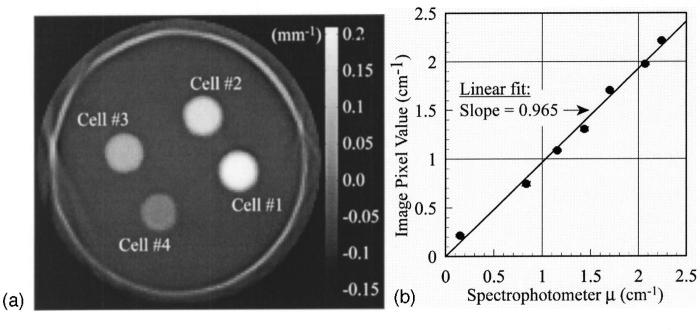
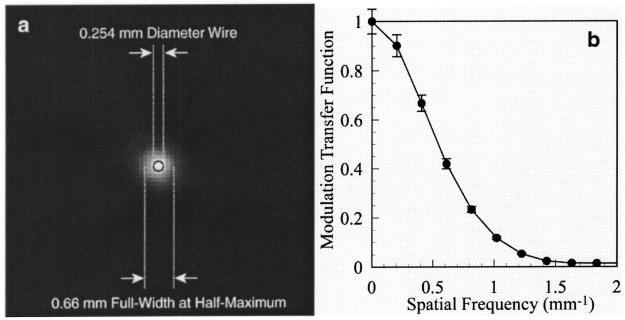
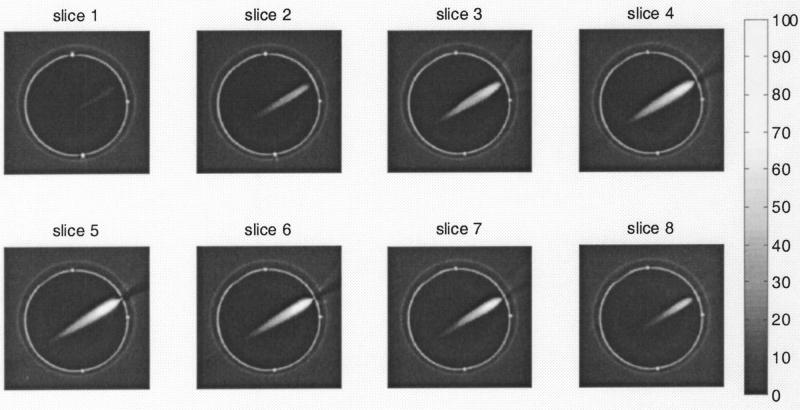
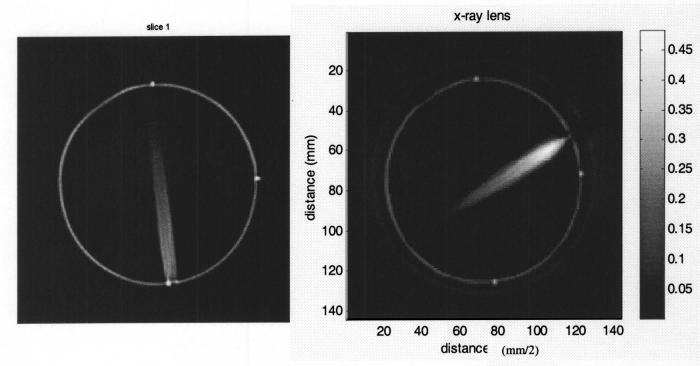
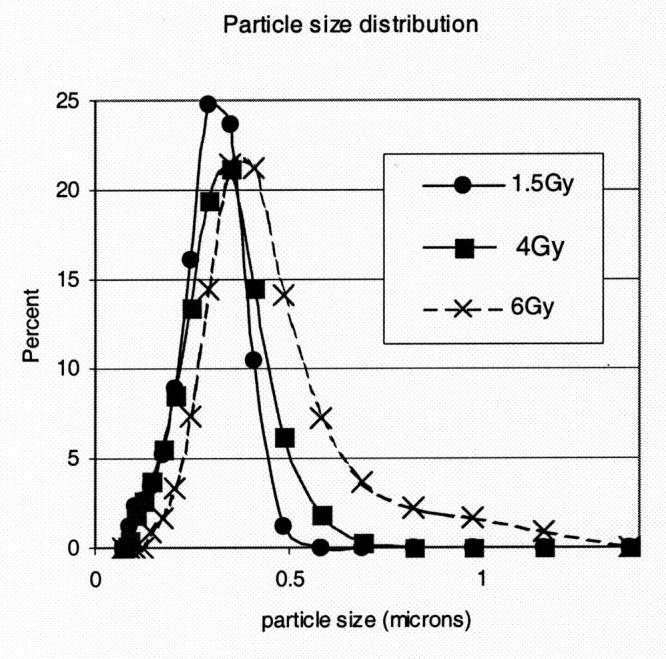
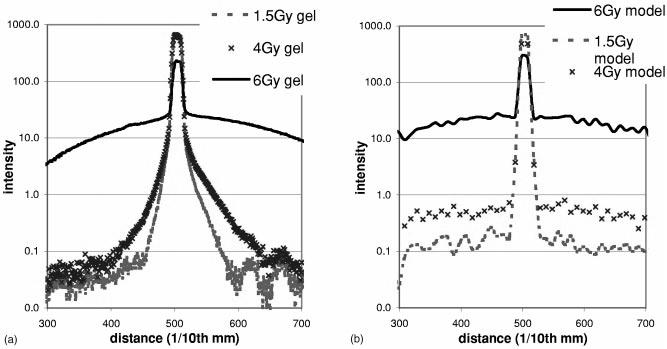
Comprehensive verification of the intricate dose distributions associated with advanced radiation treatments is now an immediate and substantial problem. The task is challenging using traditional dosimeters because of restrictions to point measurements (ion chambers, diodes, TLD, etc.) or planar measurements (film). In essence, rapid advances in the technology to deliver radiation treatments have not been paralleled by corresponding advances in the ability to verify these treatments. A potential solution has emerged in the form of water equivalent three dimensional (3D) gel-dosimetry. In this paper we present basic characterization and performance studies of a prototype optical-CT scanning system developed in our laboratory. An analysis of the potential role or scope of gel dosimetry, in relation to other dosimeters, and to verification across the spectrum of therapeutic techniques is also given. The characterization studies enabled the determination of nominal operating conditions for optical-CT scanning. "Finger" phantoms are introduced as a powerful and flexible tool for the investigation of optical-CT performance. The modulation-transfer function (MTF) of the system is determined to be better than 10% out to 1 mm(-1), confirming sub-mm imaging ability. System performance is demonstrated by the acquisition of a 1 x 1 x 1 mm3 dataset through the dose distribution delivered by an x-ray lens that focuses x rays in the energy range 40-80 KeV. This 3D measurement would be extremely difficult to achieve with other dosimetry techniques and highlights some of the strengths of gel dosimetry. Finally, an optical Monte Carlo model is introduced and shown to have potential to model light transport through gel-dosimetry systems, and to provide a tool for the study and optimization of optical-CT gel dosimetry. The model utilizes Mie scattering theory and requires knowledge of the variation of the particle size distribution with dose. The latter was determined here using the technique of dynamic-light-scattering.
Figures
Similar articles
-
Three-dimensional dose verification for intensity modulated radiation therapy using optical CT based polymer gel dosimetry.Med Phys. 2006 May;33(5):1412-9. doi: 10.1118/1.2188820. Med Phys. 2006. PMID: 16752577
-
Performance of a commercial optical CT scanner and polymer gel dosimeters for 3-D dose verification.Med Phys. 2004 Nov;31(11):3024-33. doi: 10.1118/1.1803674. Med Phys. 2004. PMID: 15587656
-
Characterization of a parallel-beam CCD optical-CT apparatus for 3D radiation dosimetry.Phys Med Biol. 2007 Jul 7;52(13):3693-713. doi: 10.1088/0031-9155/52/13/003. Epub 2007 May 25. Phys Med Biol. 2007. PMID: 17664571
-
A literature review of electronic portal imaging for radiotherapy dosimetry.Radiother Oncol. 2008 Sep;88(3):289-309. doi: 10.1016/j.radonc.2008.07.008. Epub 2008 Aug 14. Radiother Oncol. 2008. PMID: 18706727 Review.
-
Gel dosimetry for the dose verification of intensity modulated radiotherapy treatments.Z Med Phys. 2002;12(2):77-88. doi: 10.1016/s0939-3889(15)70450-2. Z Med Phys. 2002. PMID: 12145912 Review.
Cited by
-
A dual-purpose CCD based micro-optical-CT scanning system.J Phys Conf Ser. 2006 Dec 1;56(1):199-202. doi: 10.1088/1742-6596/56/1/027. J Phys Conf Ser. 2006. PMID: 17464370 Free PMC article. No abstract available.
-
Optical-CT scanning of polymer gels.J Phys Conf Ser. 2004;3:122-135. doi: 10.1088/1742-6596/3/1/011. J Phys Conf Ser. 2004. PMID: 17082823 Free PMC article.
-
Optical-CT imaging of complex 3D dose distributions.J Phys Conf Ser. 2005 Apr;5745:138-146. doi: 10.1117/12.595525. J Phys Conf Ser. 2005. PMID: 17235366 Free PMC article.
-
Dosimetry of gamma chamber blood irradiator using PAGAT gel dosimeter and Monte Carlo simulations.J Appl Clin Med Phys. 2014 Jan 4;15(1):3952. doi: 10.1120/jacmp.v15i1.3952. J Appl Clin Med Phys. 2014. PMID: 24423829 Free PMC article.
-
Radiation Dosimetry by Use of Radiosensitive Hydrogels and Polymers: Mechanisms, State-of-the-Art and Perspective from 3D to 4D.Gels. 2022 Sep 19;8(9):599. doi: 10.3390/gels8090599. Gels. 2022. PMID: 36135311 Free PMC article. Review.
References
-
- Webb S. Intensity-Modulated Radiation Therapy. (institute of Physics Publishing; Bristol, UK: 2001.
-
- Perez CA, Michalski JM, Purdy JA, Lockett MA. “New trends in prostatic cancer research. Three-dimensional conformal radiation therapy 3-D CRT, brachytherapy, and new therapeutic modalities,”. Rays. 2000;25:331–343. - PubMed
-
- Schell MC, Bova FJ, Larsson D, Leavitt DL. Stereotactic radiosurgery, Report of Task Group 42 Radiation Therapy Committee. American Association of Physicists in Medicine; New York: 1995. AAPM Report #54 (aIP.
-
- Leibel SA, et al. “Intensity-modulated radiotherapy,”. Cancer. 2002;8:164–176. - PubMed
-
- Oldham M. “Radiation sensitive film and gels,”. In: Mayles PM, Nahum AE, Rosenwald JC, editors. Handbook of Radiotherapy Physics: Theory and Practice. (institute of Physics; Bristol UK: 2002.
Publication types
MeSH terms
Substances
Grants and funding
LinkOut - more resources
Full Text Sources
Medical
Miscellaneous
