. 2003 May;23(10):3427-41.
doi: 10.1128/MCB.23.10.3427-3441.2003.

Protein-protein interaction between Fli-1 and GATA-1 mediates synergistic expression of megakaryocyte-specific genes through cooperative DNA binding

Affiliations

Protein-protein interaction between Fli-1 and GATA-1 mediates synergistic expression of megakaryocyte-specific genes through cooperative DNA binding

Michael Eisbacher et al. Mol Cell Biol. 2003 May.

Erratum in

  • Mol Cell Biol. 2004 Jun;24(11):5088

Abstract

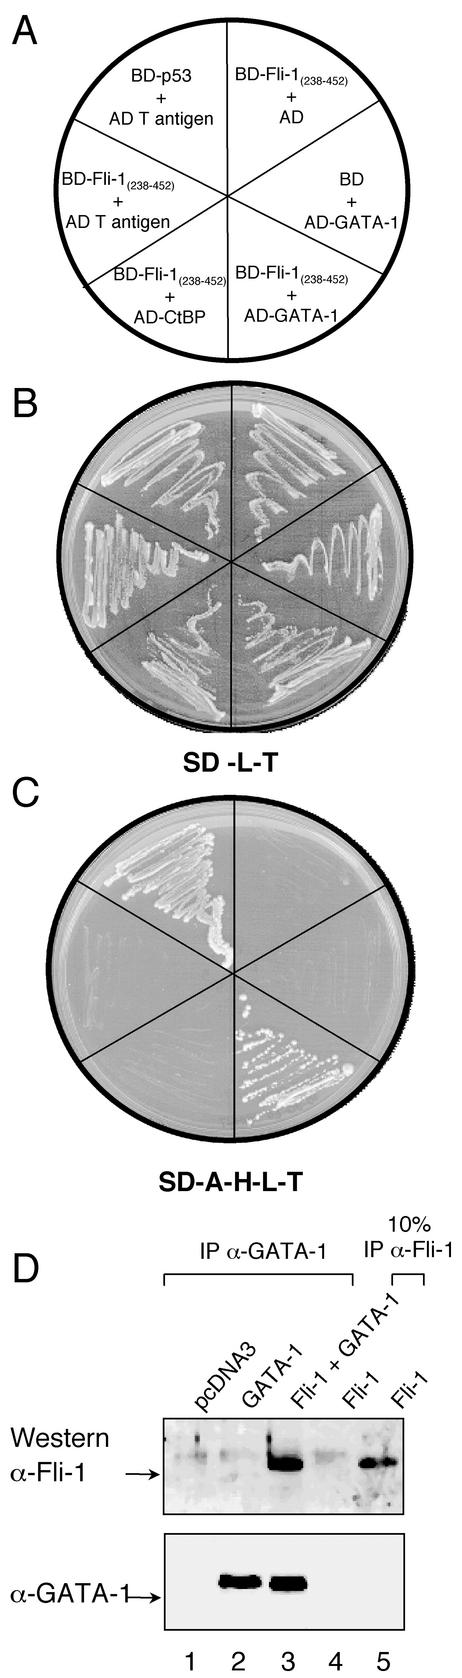
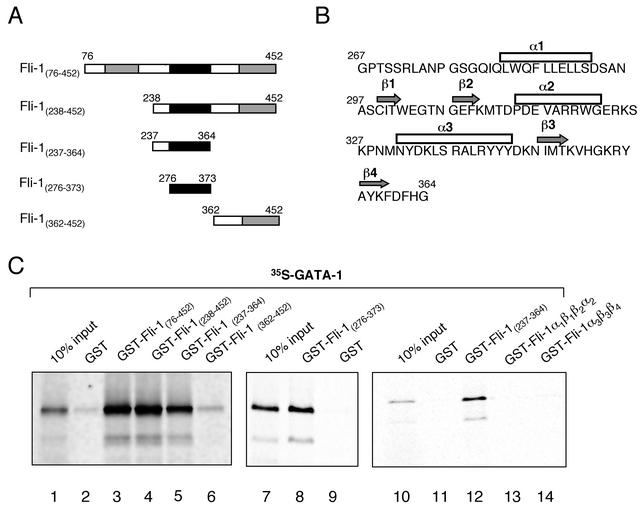
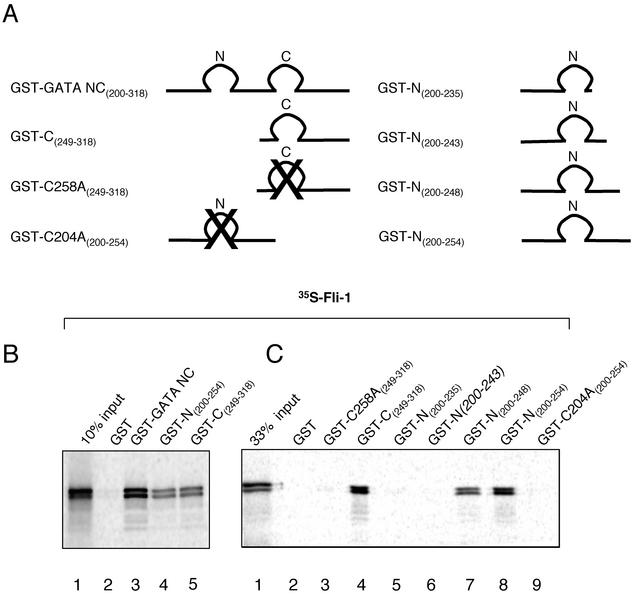
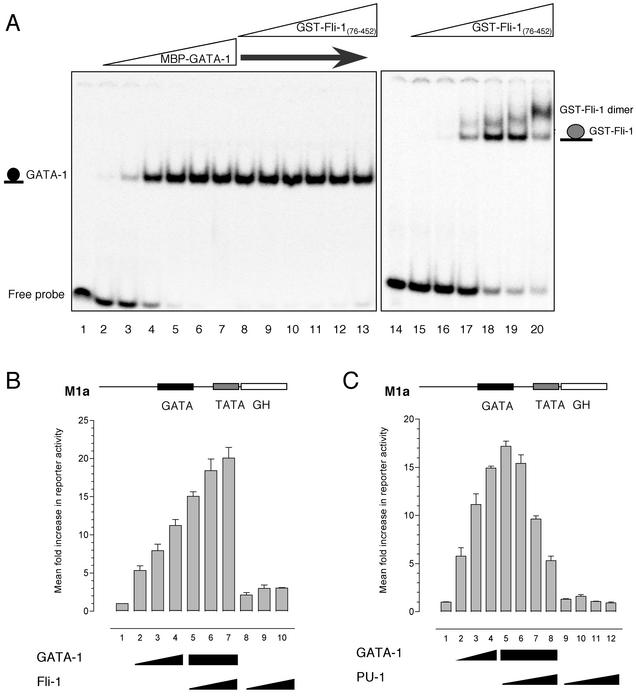
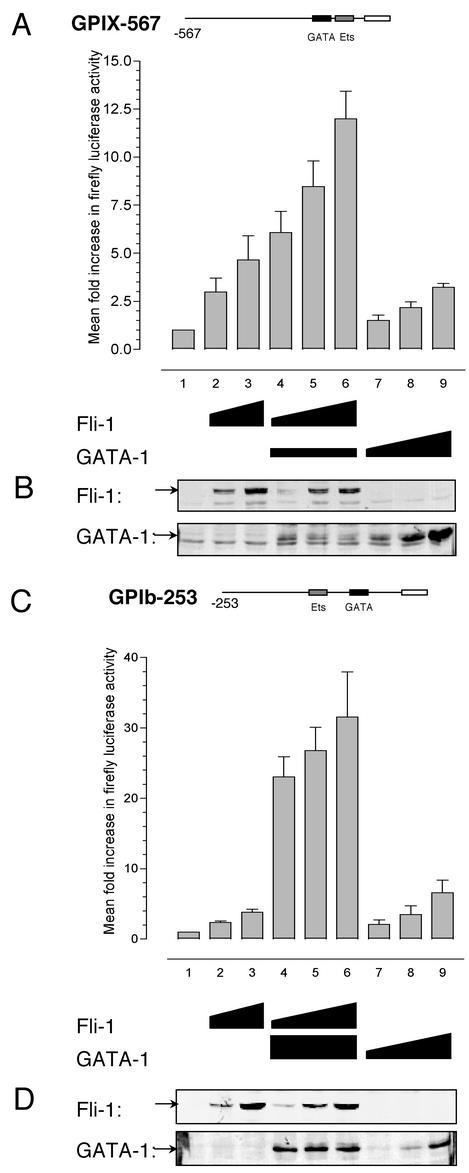
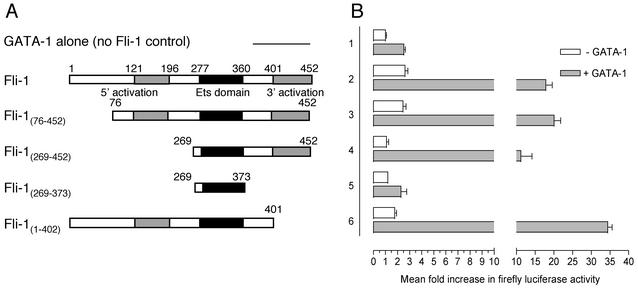
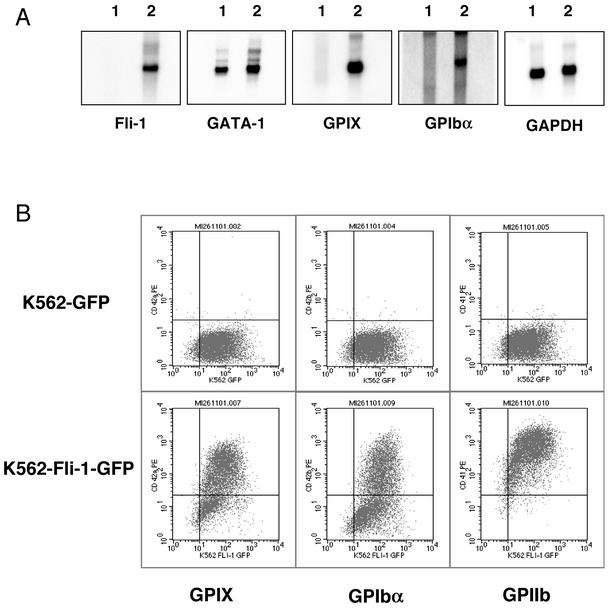
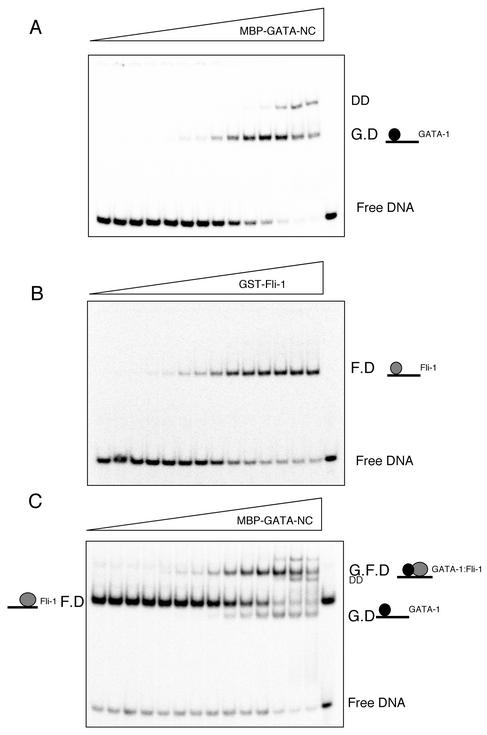
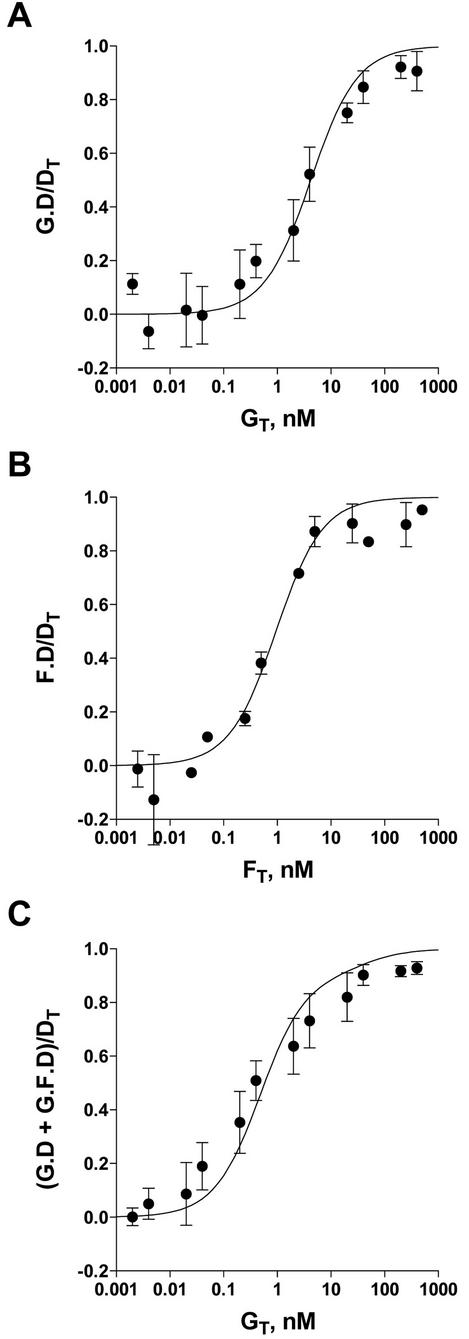
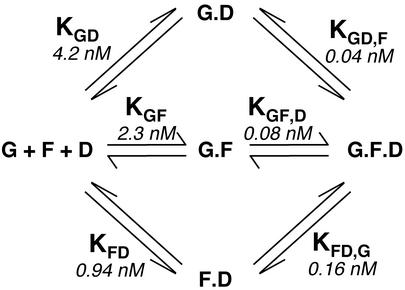
Friend leukemia integration 1 (Fli-1) is a member of the Ets family of transcriptional activators that has been shown to be an important regulator during megakaryocytic differentiation. We undertook a two-hybrid screen of a K562 cDNA library to identify transcription factors that interacted with Fli-1 and were potential regulators of megakaryocyte development. Here we report the physical interaction of Fli-1 with GATA-1, a well-characterized, zinc finger transcription factor critical for both erythroid and megakaryocytic differentiation. We map the minimal domains required for the interaction and show that the zinc fingers of GATA-1 interact with the Ets domain of Fli-1. GATA-1 has previously been shown to interact with the Ets domain of the Fli-1-related protein PU.1, and the two proteins appear to inhibit each other's activity. In contrast, we demonstrate that GATA-1 and Fli-1 synergistically activate the megakaryocyte-specific promoters GPIX and GPIbalpha in transient transfections. Quantitative electrophoretic mobility shift assays using oligonucleotides derived from the GPIX promoter containing Ets and GATA binding motifs reveal that Fli-1 and GATA-1 exhibit cooperative DNA binding in which the binding of GATA-1 to DNA is increased approximately 26-fold in the presence of Fli-1 (from 4.2 to 0.16 nM), providing a mechanism for the observed transcriptional synergy. To test the effect on endogenous genes, we stably overexpressed Fli-1 in K562 cells, a line rich in GATA-1. Overexpression of Fli-1 induced the expression of the endogenous GPIX and GPIbalpha genes as measured by Northern blot and fluorescence-activated cell sorter analysis. This work suggests that Fli-1 and GATA-1 work together to activate the expression of genes associated with the terminal differentiation of megakaryocytes.


Figures

FIG. 1.
FIG. 1.
Fli-1 interacts with GATA-1. (A) Yeast strain AH109 was transformed with the indicated plasmids as shown and plated onto the corresponding sectors shown in panels B and C. (B and C) Growth of AH109 yeast harboring the plasmids as shown in panel A after 5 days of incubation at 30°C on minimal medium lacking Leu and Trp (B) and minimal medium lacking Ade, His, Leu, and Trp (C). (D) Coimmunoprecipitation of Fli-1 with GATA-1. HeLa cells were transfected with cDNAs encoding for pcDNA3 backbone (lane 1), GATA-1 (lane 2), Fli-1 and GATA-1 (lane 3), or Fli-1 alone (lanes 4 and 5) and were immunoprecipitated with anti-GATA-1 monoclonal antibody (lanes 1 to 4) or anti-Fli-1 monoclonal antibody as control (lane 5). Immunoprecipitates were then subjected to immunoblotting with anti-GATA-1 or anti-Fli-1 monoclonal antibody, as outlined in Materials and Methods.
FIG. 2.
FIG. 2.
Fli-1 domains required for the Fli-1-GATA-1 interaction. (A) Schematic representations of the Fli-1 domains used in GST-pulldown assays. (B) Amino acid sequence of the Fli-1 Ets domain showing α-helical and β-sheet regions. (C) GST pulldowns demonstrating the Fli-1 domains required for the interaction with GATA-1. The indicated GST and GST-Fli-1 fusion constructs were expressed in E. coli strain BL-21, purified using GST-agarose beads, and incubated in the presence of 35S-labeled mGATA-1. After extensive washing, the GST- or GST-Fli-1-coated beads were boiled in loading buffer and subjected to electrophoresis, after which retained GATA-1 was visualized by phosphorimaging. Lane 1 contains 10% of the input in vitro-translated 35S-labeled GATA-1 protein. Other lanes contain the GST-Fli-1 deletions as shown.
FIG. 3.
FIG. 3.
GATA domains required for the Fli-1-GATA-1 interaction. (A) Schematic representations of the GST-GATA-1 constructs used in GST pulldown assays. (B) GST pulldown assays using the GST-GATA-1 deletions and mutations shown schematically above. Lane 1, 10% of the input in vitro-translated 35S-labeled Fli-1 protein; lane 2, GST-coated beads; lanes 3 to 5, GST-GATA constructs, as indicated. (C) Finer mapping of the domains of GATA-1 required for the interaction with Fli-1. Lane 1, 33% of the input in vitro-translated 35S-labeled Fli-1 protein; lane 2, GST; lane 3, GATA-C finger with a mutated cysteine C258A; lane 4, wild-type C finger; lanes 5 to 9, GATA-N finger constructs, as shown. Samples were incubated as described in the legend for Fig. 2.
FIG. 4.
FIG. 4.
Fli-1 does not antagonize GATA-1 DNA binding or transcriptional activity. (A) EMSA was performed by titrating increasing amounts of purified recombinant MBP-tagged GATA-NC with 0.2 fmol of the 32P-labeled GATA consensus oligonucleotide 5′-GATCTCCGGCAACTGATAAGGATTCCCTG-3′ (sense strand; Crossley et al. [8]) (the GATA site is shown in bold). The first lane contains probe alone. Lanes 2 to 17, increasing concentrations of GATA-1 protein (4 × 10⁻¹³ M to 4 × 10⁻⁸ M). Lanes 8 to 13, 4 × 10⁻⁹ M GATA-1 with increasing amounts of GST-Fli-1 protein (8 × 10⁻¹² M to 8 × 10⁻⁷ M). Lane 14, GPIX-Ets probe alone (5′-ATTTTCATCACTTCCTTCCGCCCGCTCCC-3′, sense strand; Eisbacher et al. [9]). Lanes 15 to 20, increasing amounts of GST-Fli-1 protein (8 × 10⁻¹² M to 8 × 10⁻⁷ M) in the presence of GPIX-Ets probe. (B) HeLa cells were transfected with 400 ng of M1α reporter alone (bar 1) or together with expression plasmids for GATA-1 alone (bars 2 to 4, respectively, 100, 200, and 400 ng); 400 ng of GATA-1 in combination with increasing amounts of Fli-1 expression plasmid (bars 5 to 7, respectively, 100, 200, and 400 ng); or increasing amounts of Fli-1 expression plasmid alone (bars 8 to 10, respectively, 100, 200, and 400 ng). Growth hormone levels were assayed after 48 h. Values are expressed as mean fold increase ± standard deviation relative to a value of 1 for each reporter. Results shown are means from three experiments performed in triplicate. (C) HeLa cells were transfected as described for panel B, except that Fli-1 was replaced with PU.1. Bars correspond to 400 ng of M1α reporter alone (bar 1); expression plasmids for GATA-1 alone (bars 2 to 4, respectively, 100, 200, and 400 ng); GATA-1 in combination with increasing amounts of PU.1 expression plasmid (bars 5 to 8, respectively, 100, 200, 400, and 800 ng); or increasing amounts of PU.1 expression plasmid alone (bars 9 to 12, respectively, 100, 200, 400, and 800 ng).
FIG. 5.
FIG. 5.
The Fli-1-GATA-1 combination results in synergistic activation of the megakaryocyte-specific promoters GPIX and GPIbα in HeLa cells. (A) HeLa cells were transfected with 200 ng of the GPIX-567 luciferase reporter plasmid alone (bar 1) or together with increasing amounts of expression plasmids for Fli-1 (bars 2 and 3, respectively, 200 and 400 ng) or were transfected with 200 ng of GATA-1 expression plasmid together with increasing amounts of Fli-1 (bars 4 to 6, respectively, 100, 200, and 400 ng) or increasing amounts of GATA-1 expression plasmid alone (bars 7 to 9, respectively, 200, 400, and 800 ng). Cells were harvested 48 h posttransfection in passive lysis buffer, and 10 μl was used in the luciferase assay. Values are expressed as mean increases ± standard deviations relative to a value of 1 for each reporter. Results shown are means from three experiments performed in triplicate. (B) Western blotting was performed on 30 μg of total cell extract from a single representative experiment described in panel A and probed for Fli-1 or GATA-1 expression to rule out possible effects of GATA-1 expression on Fli-1 levels and vice versa. Fli-1 and GATA-1 are indicated by the arrows. (C) HeLa cells were transfected with 800 ng of the GPIbα-253 luciferase reporter plasmid alone (bar 1) or together with increasing amounts of expression plasmids for Fli-1 (bars 2 and 3, respectively, 100 and 200 ng); 50 ng of GATA-1 expression plasmid together with increasing amounts of Fli-1 (bars 4 to 6, respectively, 50, 100, and 200 ng); or increasing amounts of GATA-1 expression plasmid alone (bars 7 to 9, respectively, 10, 20, and 50 ng). Cells were harvested and assayed as described for panel A. (D) Western blotting, as described for panel B, on 50-μg total cell extracts from a single representative experiment from panel C.
FIG. 6.
FIG. 6.
A Fli-1 activation domain in conjunction with the Fli-1 Ets domain is required to retain transcriptional synergy with GATA-1. (A) Schematic representations of Fli-1 constructs used alone or in combination with GATA-1 to activate the GPIbα-253 luciferase reporter. (B) HeLa cells were cotransfected with 800 ng of GPIbα-253 luciferase reporter and either 200 ng of pcDNA3 backbone (lane 1) or 200 ng of the indicated Fli-1 constructs (lanes 2 to 6), either without (open bars) or with (filled bars) 50 ng of GATA-1 expression plasmid. Total DNA was kept constant in each sample by addition of pcDNA3 backbone. Luciferase activity was measured as described for Fig. 5. Results represent mean increases of reporter activity ± standard deviations relative to a value of 1 for GPIbα-253 reporter activity alone (lane 1, open bar). Results shown are the means from three experiments performed in triplicate. Each experiment was performed at least three times with similar results.
FIG. 7.
FIG. 7.
Fli-1 overexpression in K562 cells in the maintained presence of endogenous GATA-1. (A) Northern blot analysis of K562 cell lines stably transfected with control plasmid pIRES2-EGFP (lane 1) or Fli-1 expression plasmid pIRES2-Fli-1-EGFP (lane 2). Each lane contains 3 μg of poly(A+) RNA. The membrane was hybridized with the indicated 32P-labeled cDNA probes in the order shown. Membranes were stripped prior to each hybridization in the presence of boiling 0.1% SDS. (B) Flow cytometric analysis of K562-GFP and K562-Fli-1-GFP cell lines for the surface expression of markers associated with terminal differentiation of megakaryocytes. The indicated cell lines were incubated in the presence of anti-GPIX, anti-GPIbα, or anti-GPIIb primary antibodies prior to being labeled with phycoerythrin-conjugated secondary antibody, as shown.
FIG. 8.
FIG. 8.
Fli-1 and GATA-1 exhibit cooperative DNA binding. (A) EMSA of equilibrium binding studies of increasing amounts of MBP-GATA-NC titrated onto the 32P-labeled GPIX-GATA-Ets oligonucleotide (0.2 fmol/20-μl reaction). The wedge indicates increasing concentrations of MBP-GATA-NC (2 × 10⁻¹³ M to 2 × 10⁻⁸ M). G.D corresponds to GATA-1-DNA binary complex. DD corresponds to GATA-1 dimer. (B) EMSA, as described for panel A, with increasing amounts of GST-Fli-1 Ets (5 × 10⁻¹³ M to 5 × 10⁻⁷ M). F.D corresponds to Fli-1-DNA binary complex. (C) EMSA, as described for panel A, with identical amounts of MBP-GATA-NC and probe in the presence of a saturating amount of GST-Fli-1. F.D corresponds to Fli-1-DNA complex, G.D corresponds to GATA-1-DNA complex, and G.F.D corresponds to GATA-1-Fli-1-DNA ternary complex.
FIG.9.
FIG.9.
Binding of GATA-1 (indicated as G) or Fli-1 (indicated as F) to DNA (indicated as D) and formation of the ternary GATA-1-Fli-1-DNA complex. Shown are the isotherms for binding of GATA-1 (A) or Fli-1 (B) to DNA and for binding of G to D in the presence of a fixed concentration of F (C). The solid lines in panels A and B represent the best fit of the data to a single rectangular hyperbola with dissociation constants of 4.2 (A) and 0.94 (B) nM. In panel C, the solid line represents the best fit of the data to the equilibrium binding model equation with dissociation constants of 2.3 and 0.16 nM for KGF and KFD,G, respectively. KGD and KFD were fixed at 4.2 and 0.94 nM, respectively.
FIG. 10.
FIG. 10.
Schematic representation of the possible pathways for GATA-1-Fli-1-DNA ternary complex formation. Ternary complex formation between GATA-1 (G), Fli-1 (F), and GPIX-GATA-Ets DNA oligonucleotide (D) can occur through three possible pathways via the intermediary binary complexes GATA-1-DNA, GATA-1-Fli-1, or Fli-1-DNA. The calculated dissociation constants are also shown.

References

    1. Athanasiou, M., P. A. Clausen, G. J. Mavrothalassitis, X. K. Zhang, D. K. Watson, and D. G. Blair. 1996. Increased expression of the ETS-related transcription factor FLI-1/ERGB correlates with and can induce the megakaryocytic phenotype. Cell Growth Differ. 7:1525-1534. - PubMed
    1. Athanasiou, M., G. Mavrothalassitis, L. Sun-Hoffman, and D. G. Blair. 2000. FLI-1 is a suppressor of erythroid differentiation in human hematopoietic cells. Leukemia 14:439-445. - PubMed
    1. Bastian, L. S., B. A. Kwiatkowski, J. Breininger, S. Danner, and G. Roth. 1999. Regulation of the megakaryocytic glycoprotein IX promoter by the oncogenic Ets transcription factor Fli-1. Blood 93:2637-2644. - PubMed
    1. Behre, G., L. T. Smith, and D. G. Tenen. 1999. Use of a promoterless Renilla luciferase vector as an internal control plasmid for transient co-transfection assays of Ras-mediated transcription activation. BioTechniques 26:24-26, 28. - PubMed
    1. Ben-David, Y., E. B. Giddens, and A. Bernstein. 1990. Identification and mapping of a common proviral integration site Fli-1 in erythroleukemia cells induced by Friend murine leukemia virus. Proc. Natl. Acad. Sci. USA 87:1332-1336. - PMC - PubMed

Publication types

MeSH terms

LinkOut - more resources