. 2003 May;23(10):3536-49.
doi: 10.1128/MCB.23.10.3536-3549.2003.

Replication of the chicken beta-globin locus: early-firing origins at the 5' HS4 insulator and the rho- and betaA-globin genes show opposite epigenetic modifications

Affiliations

Replication of the chicken beta-globin locus: early-firing origins at the 5' HS4 insulator and the rho- and betaA-globin genes show opposite epigenetic modifications

Marie-Noëlle Prioleau et al. Mol Cell Biol. 2003 May.

Abstract

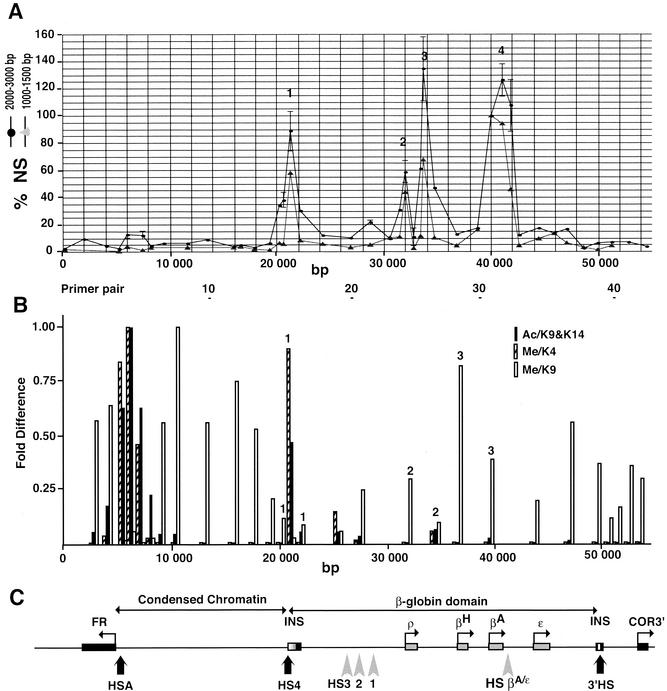
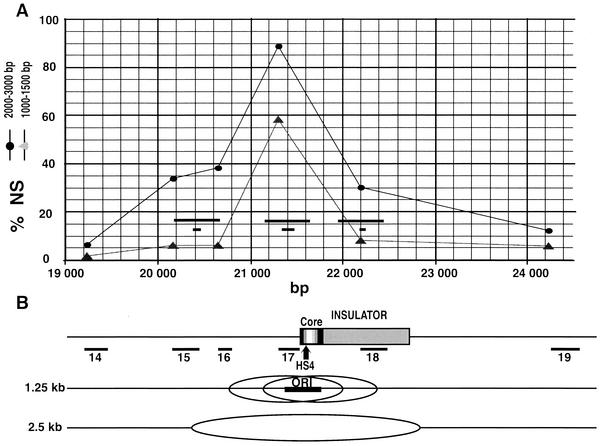
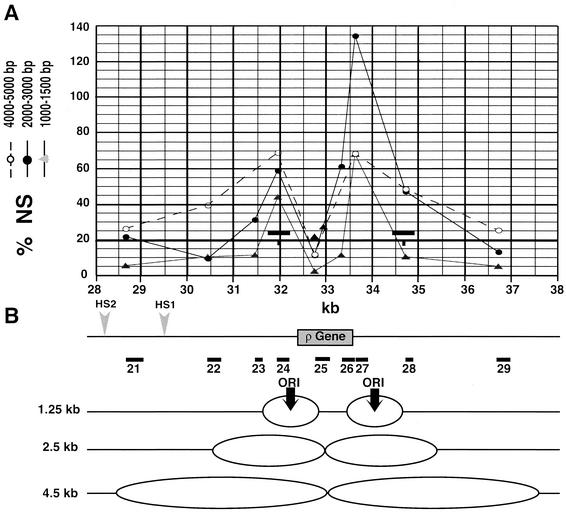
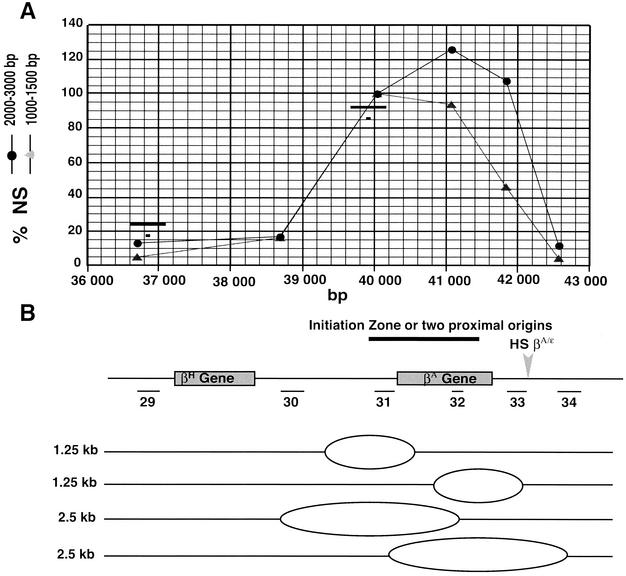
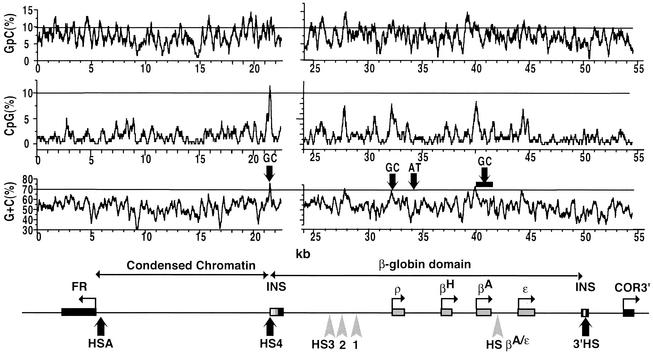
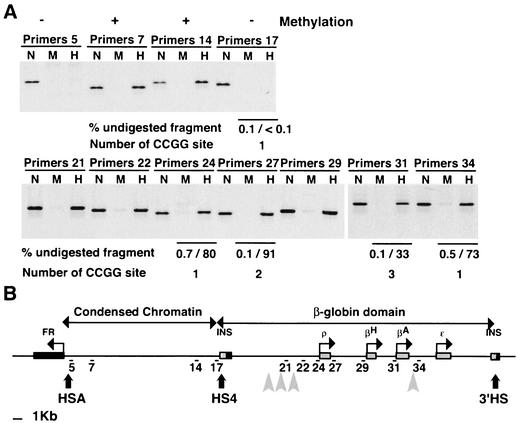
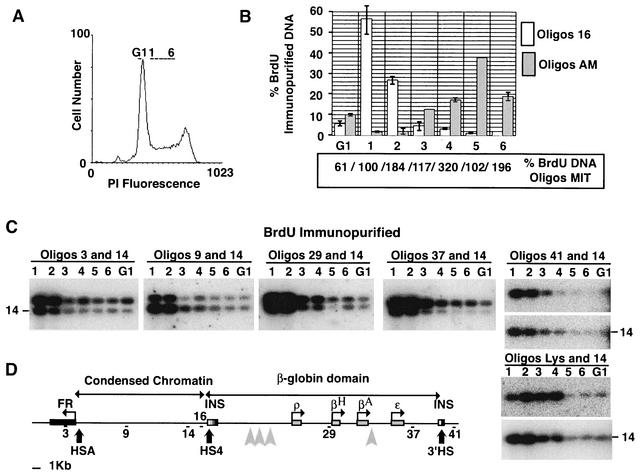
Chromatin structure is believed to exert a strong effect on replication origin function. We have studied the replication of the chicken beta-globin locus, whose chromatin structure has been extensively characterized. This locus is delimited by hypersensitive sites (HSs) that mark the position of insulator elements. A stretch of condensed chromatin and another HS separate the beta-globin domain from an adjacent folate receptor (FR) gene. We demonstrate here that in erythroid cells that express the FR but not the globin genes, replication initiates at four sites within the beta-globin domain, one at the 5' HS4 insulator and the other three near the rho- and beta(A)-globin genes. Three origins consist of G+C-rich sequences enriched in CpG dinucleotides. The fourth origin is A+T rich. Together with previous work, these data reveal that the insulator origin has unmethylated CpGs, hyperacetylated histones H3 and H4, and lysine 4-methylated histone H3. In contrast, opposite modifications are observed at the other G+C-rich origins. We also show that the whole region, including the stretch of condensed chromatin, replicates early in S phase in these cells. Therefore, different early-firing origins within the same locus may have opposite patterns of epigenetic modifications. The role of insulator elements in DNA replication is discussed.


Figures

FIG. 1.
FIG. 1.
Replication origin mapping of the chicken β-globin locus. (A) Relative enrichments of 1.0- to 1.5-kb and 2.0- to 3.0-kb nascent strands in the 52-kb FR/β-globin region reveal four sites of initiation of replication in the β-globin locus. Two different preparations of nascent strands (1.0 to 1.5 kb, gray triangles, and 2.0 to 3.0 kb, black circles) were used to determine the abundance of short RNA-primed DNA chains along the chromosome by real-time PCR with 36 and 42 different primer pairs, respectively. Each quantification was repeated twice except in the case of the 2.0- to 3.0-kb fraction (four times for primer pairs 5, 6, 16, 21, 24, 27, 32, and 33 and six times for primer pairs 17 and 25). The scale corresponds to a relative nascent-strand abundance (NS) normalized with respect to primer pair 31 (arbitrarily set as 100%). The abscissa scale is map position (nucleotide number). The positions of primer pairs 10, 20, 30, and 40 are shown below. (B) Map of histone H3 modifications at the chicken β-globin/FR locus in 6C2 cells (adapted from reference 41). Normalized data of H3 diacetylation at K9 and K14 (Ac/K9&K14), H3 methylation at K4 (Me/K4), and H3 methylation at K9 (Me/K9). Note the correlation between diacetylation at K9 and K14 and methylation at K4 and anticorrelation with methylation at K9. Numbers 1, 2, and 3 above vertical bars correspond to probes reported in Fig. 2, 3, and 4, respectively. (C) Map of the FR gene, condensed chromatin region, and β-globin domain. DNase I HSs are indicated (HSA, HS1 to -4, HS βA/ɛ, 3′ HS). HSA is located 1 kb upstream of the FR transcription start site. HS4 maps within the upstream insulator element (INS) of the β-globin locus. The 16-kb region between HSA and HS4 consists of micrococcal nuclease-resistant chromatin. The embryonic (ρ- and ɛ-), hatching (βH-), and adult (βA-) globin genes are indicated. The β-globin locus is controlled by an LCR consisting of HS1, HS2, HS3, and the strong enhancer HS βA/ɛ. The HS1 and HS2 sites are not detectable in 6C2 cells. The 3′ end of the locus is marked by the 3′ HS insulator. Beyond the 3′ HS insulator (INS) a gene coding for an olfactory receptor (COR3′) is indicated.
FIG. 2.
FIG. 2.
The leftmost initiation site colocalizes with the 5′ boundary of the β-globin locus. (A) A blow-up of the graph shown in Fig. 1A around the 5′ boundary of the chicken β-globin locus. The short and long horizontal black bars indicate the amplified PCR products used previously (41) to characterize histone tail modifications and the corresponding detection zones (3 nucleosomes), respectively. (B) The map shows the 1.2-kb insulator, the 250-bp core insulator region, the position of HS4, and PCR fragments used to quantify nascent strands shown in panel A. An interpretation of the profiles obtained with the two nascent-strand sizes is drawn below. The leftmost and rightmost possible positions of 1.25-kb bubbles that do not span probes 16 and 18 are indicated. The centers of these two bubbles define the ends of a 400-bp segment (black horizontal bar) where the origin has to be located. The predicted extent of bidirectional progression of the replication forks from the center of this segment up to a bubble size of 2.5 kb is indicated on the bottom line.
FIG. 3.
FIG. 3.
Two sites of initiation surround the ρ-globin gene. (A) A blow-up of the graph shown in Fig. 1A around the ρ-globin gene. In addition to the 1.0- to 1.5-kb (gray triangles) and 2.0- to 3.0-kb (black circles) nascent strands (NS), quantitations of a 4.0- to 5.0-kb nascent-strand preparation are shown (white circles, dotted line). The two black triangles show quantitations of the same 4.0- to 5.0-kb nascent-strand preparation with two PCR primer pairs that amplify the 5′ and 3′ halves of fragment 25. The short and long horizontal black bars indicate the amplified PCR products used previously (41) to characterize histone tail modifications and the corresponding detection zones (3 nucleosomes). (B) Map of the ρ-globin gene, upstream HS1, HS2, and the PCR fragments used in panel A. An interpretation of the profiles obtained is drawn at the bottom. Two small bubbles are initiated at position 32.2 and 34.2 kb either on the same molecule of DNA or on different molecules. The progression of replication forks inside the ρ-globin gene is slowed or blocked so that the region amplified by primer pair 25 is underrepresented in short (<5 kb) nascent strands.
FIG. 4.
FIG. 4.
Dispersive initiation within the βA-globin gene. (A) A blow-up of the graph shown in Fig. 1A around the βA-globin gene. The short and long horizontal black bars indicate the amplified PCR products used previously (41) to characterize histone tail modifications and the corresponding detection zones (3 nucleosomes), respectively. (B) Map of the position of the βH- and βA-globin genes, HS βA/ɛ, and PCR fragments used for quantitations of nascent strands (NS) shown in panel A. Below the map an interpretation of the graph is drawn. Small bubbles initiate at multiple sites inside a region located between 40.0 and 41.5 kb and progress bidirectionally. The strong abundance of 2.0- to 3.0-kb nascent strands observed with primer pair 32 result from the simultaneous detection of the 5′-most and 3′-most bubbles with this probe.
FIG. 5.
FIG. 5.
Three out of the four replication origins are located at CpG-enriched sequences. The DNA sequence of the entire FR/β-globin region (with the exception of 1 kb of unsequenced DNA upstream of the β-globin locus) was analyzed by using a Genetics Computer Group program with a window of 200 nucleotides and a shift of 1 nucleotide. Shown are the percentages of G+C (bottom graph), CpG dinucleotides (middle), and GpC dinucleotides (top). The horizontal lines mark a G+C content of 70% and a CpG or GpC content of 10%. Black arrows on the top of the lowest graph indicate the position of either G+C- or A+T-rich replication origins. The βA-globin gene initiation zone is delimited by a horizontal black bar. The map of the region is shown at the bottom.
FIG. 6.
FIG. 6.
The G+C-rich, CpG-enriched replication origins contain either methylated or unmethylated CpGs. (A) Genomic DNA extracted from 6C2 cells was digested either with MspI or HpaII. Undigested (N), MspI-digested (M), or HpaII-digested DNA (H) was amplified by PCR with the indicated primer pairs. The upper gels are controls analyzing genomic fragments whose methylation status of CCGG sites is already known (pairs 5, 7, 14, and 17). Quantitation by real-time PCR of MspI- or HpaII-digested DNA was also made with primer pairs 17, 24, 27, 31, and 34. Primer pair 25 amplifies a PCR fragment lacking a CCGG site and was used as a control for input DNA. The real-time PCR results and the number of CCGG sites in the amplified fragment are indicated below the corresponding lanes. Each experiment was repeated at least twice with similar results. (B) The map shows the positions of fragments amplified by primer pairs used for panel A. INS, insulator.
FIG. 7.
FIG. 7.
The entire FR/β-globin region is replicated early in S phase. (A) Histogram of propidium iodide (PI) staining intensity of a population of asynchronous cells pulse labeled with BrdU and sorted for timing analysis. The gates used to sort cells into a G1 compartment and six different compartments of S phase are labeled G1 and 1 to 6, respectively. (B) Quantitative real-time PCR of DNA extracted from different compartments of the cell cycle and immunoprecipitated with anti-BrdU antibodies. Numerical values at the bottom of the graph indicate the relative amounts of immunoprecipitated DNA detected with a primer pair specific for the D-loop region of the chicken mitochondrion (Oligos MIT). One hundred was arbitrarily set for fraction 1. Since mitochondrial genomes are replicated throughout the cell cycle, we used these data to control for variations in DNA recovery and PCR amplification efficiency. The graph shows data (normalized with respect to mitochondrial DNA abundance) obtained with the same fractions with either a chicken β-globin locus (Oligos 16) or a chicken α-amylase (Oligos AM)-specific primer pair. Each quantification was repeated twice. Error bars indicate the range of variation between the two values. The absence of an error bar indicates that these values are equal. (C) Multiplex PCRs made with different primer pairs on DNA extracted from different compartments of the cell cycle and immunoprecipitated with anti-BrdU antibodies. The PCR products were analyzed by Southern blotting and hybridization with the two cognate probes simultaneously (leftmost four gels) or consecutively (rightmost two gels). The experiment was performed twice with identical results. (D) The map shows the positions of fragments amplified by primer pairs used in the experiments depicted in panels B and C. INS, insulator.

Similar articles

Cited by

References

    1. Abdurashidova, G., M. Deganuto, R. Klima, S. Riva, G. Biamonti, M. Giacca, and A. Falaschi. 2000. Start sites of bidirectional DNA synthesis at the human lamin B2 origin. Science 287:2023-2026. - PubMed
    1. Aladjem, M. I., M. Groudine, L. L. Brody, E. S. Dieken, R. E. Fournier, G. M. Wahl, and E. M. Epner. 1995. Participation of the human beta-globin locus control region in initiation of DNA replication. Science 270:815-819. - PubMed
    1. Aladjem, M. I., L. W. Rodewald, J. L. Kolman, and G. M. Wahl. 1998. Genetic dissection of a mammalian replicator in the human beta-globin locus. Science 281:1005-1009. - PubMed
    1. Aladjem, M. I., L. W. Rodewald, C. M. Lin, S. Bowman, D. M. Cimbora, L. L. Brody, E. M. Epner, M. Groudine, and G. M. Wahl. 2002. Replication initiation patterns in the beta-globin loci of totipotent and differentiated murine cells: evidence for multiple initiation regions. Mol. Cell. Biol. 22:442-452. - PMC - PubMed
    1. Antequera, F., and A. Bird. 1999. CpG islands as genomic footprints of promoters that are associated with replication origins. Curr. Biol. 9:R661-R667. - PubMed

Publication types

MeSH terms

LinkOut - more resources