. 2003 May 1;22(9):1990-2003.
doi: 10.1093/emboj/cdg197.

An H-bond between two residues from different loops of the acetylcholine binding site contributes to the activation mechanism of nicotinic receptors

Affiliations

An H-bond between two residues from different loops of the acetylcholine binding site contributes to the activation mechanism of nicotinic receptors

Thomas Grutter et al. EMBO J. .

Abstract

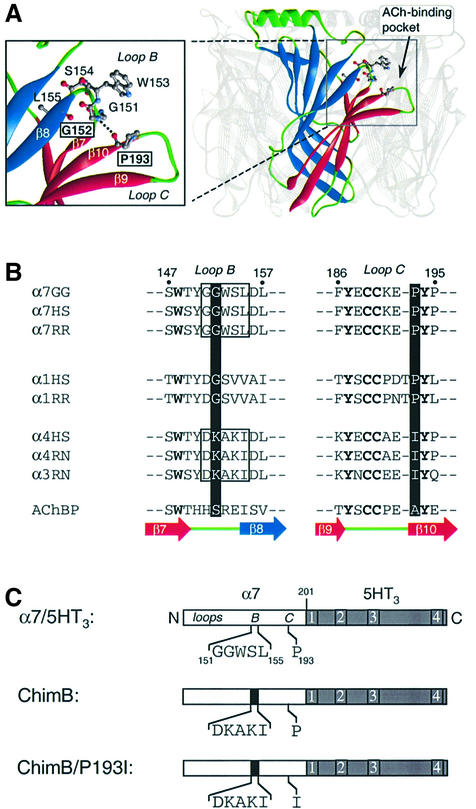
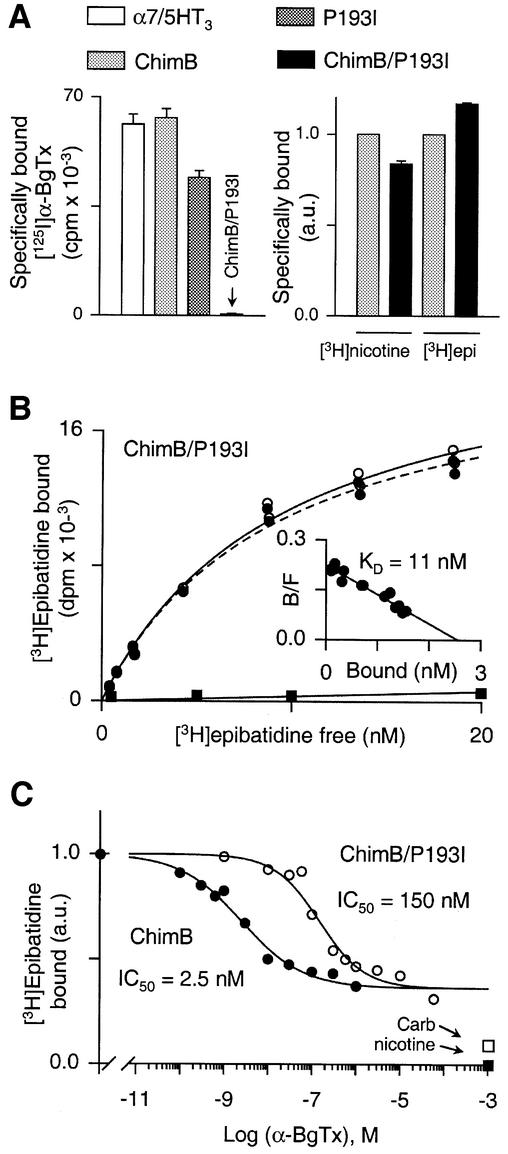
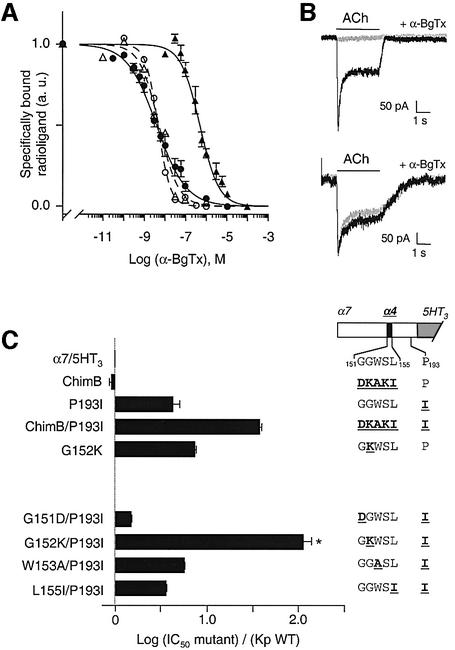
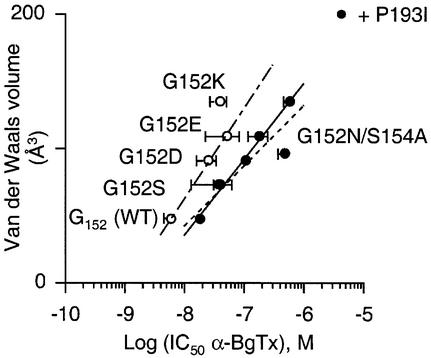
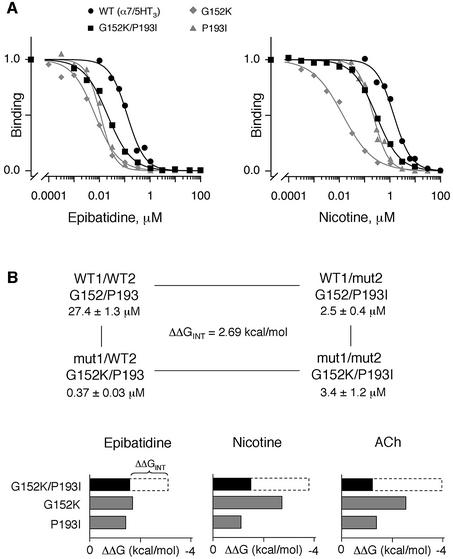
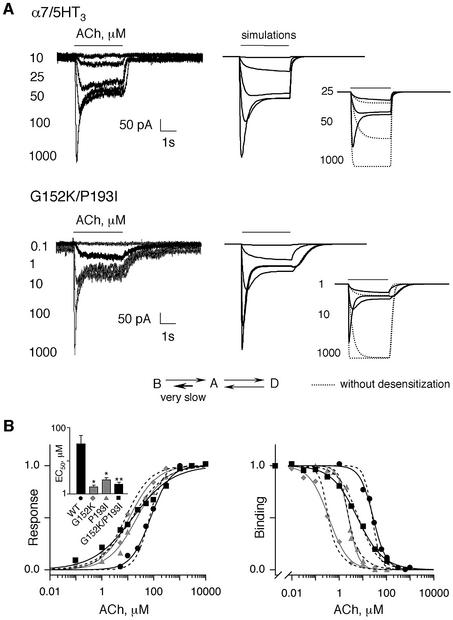
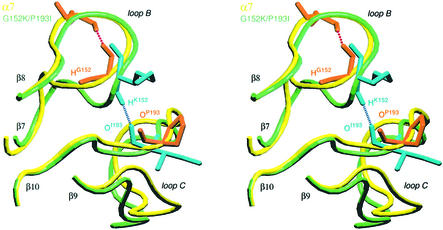
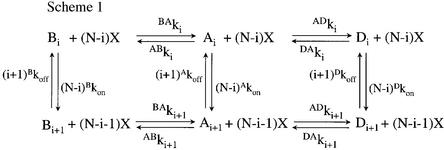
The molecular mechanisms of nicotinic receptor activation are still largely unknown. The crystallographic structure of the acetylcholine binding protein (AChBP) reveals a single H-bond between two different acetylcholine binding loops. Within these homologous loops we systematically introduced alpha4 residues into the alpha7/5HT(3) chimeric receptor and found that the single point mutations G152K (loop B) and P193I (loop C) displayed a non-additive increase of equilibrium binding affinity for several agonists compared with the double mutant G152K/P193I. In whole-cell patch-clamp recordings, G152K, P193I and G152K/P193I mutants displayed an increase up to 5-fold in acetylcholine potency with a large decrease of the apparent Hill coefficients (significantly smaller than one). Concomitantly, the G152K/P193I mutant showed a dramatic loss of high-affinity alpha-bungarotoxin binding (100-fold decrease), thus pinpointing a new contact area for the toxin. Fitting the data with an allosteric-kinetic model, together with molecular dynamic simulations, suggests that the presence of the inter-backbone H-bond between positions 152 and 193, revealed in alpha4 and in alpha7 double mutant but not in alpha7, coincides with a large stabilization of both open and desensitized states of nicotinic receptors.


Figures

None
Fig. 1. (A) Three-dimensional model of the extracellular domain of α7 receptor based on the crystal structure of AChBP (Brejc et al., 2001) by comparative modeling (Le Novère et al., 2002). For clarity, one subunit of the pentamer is highlighted. Each subunit is folded in a twisted β-sandwich motif composed of the inner (blue) and outer (red) β-sheets. Nomenclature as described (Unwin et al., 2002). In the enlarged view, a plausible H-bond between G152 and P193 (dotted line) links loop B (fragment 151–155) and the β-hairpin of loop C (fragment 186–195), thus connecting the inner and outer β-sheets at the level of the ACh binding site. (B) Aligned sequences of loops B and C of neuronal (α7, α4 and α3) and muscle (α1) nAChRs: GG, Gallus gallus; HS, Homo sapiens; RR, Rattus norvegicus; AChBP, acetylcholine binding protein. The corresponding strands from the AChBP structure are also indicated under the sequence alignment (Brejc et al., 2001). (C) Schematic representation of the chick α7 ECD (white box) of the chimera α7/5HT3. In this chimera, amino acids beyond residue 201 (gray box) correspond to those of the 5HT3 receptor sequence (Eiselé et al., 1993). The five amino acids of loop B (segment 151–155) and P193 of the wild-type α7/5HT3 are indicated. The microchimera ChimB corresponds to the homologous substitution of rat α4 sequence (black box) loop B, whereas ChimB/P193I corresponds to the same microchimera plus the single mutant P193I in loop C.
None
Fig. 2. (A) Left panel: representative experiment of [125I]α-BgTx binding to α7/5HT3 receptor (white bar), ChimB (light gray bar), P193I (dark gray bar) and ChimB/P193I (black bar). Membrane fragments of each construction were incubated with 5 nM [125I]α-BgTx for 2 h and samples were filtered and counted. Values indicated represent specific [125I]α-BgTx binding (non-specific binding was determined in the presence of 1 mM nicotine). Data are means ± SE of triplicates. Right panel: representative experiment of specific (non-specific binding was determined in the presence of 1 mM nicotine) [3H]nicotine and [3H]epibatidine binding on ChimB (light gray bar) and ChimB/P193I (black bar). Membrane fragments were incubated with 100 nM [3H]nicotine or 10 nM [3H]epibatidine until equilibrium. Samples were filtered and counted. Data were normalized (a.u., arbitrary units) to ChimB values and are means ± SE of triplicates. (B) Representative experiment of [3H]epibatidine binding to the double mutant ChimB/P193I. Membrane fragments were incubated with various concentrations of [3H]epibatidine (0.5–20 nM) in the presence (filled squares) or absence (open circles) of 1 mM nicotine until equilibrium and samples were filtered and counted. Specific [3H]epibatidine is also indicated (filled circles). The inset shows a Scatchard plot of specific binding of [3H]epibatidine. Data were fitted to non-linear and linear least-squares analysis for the saturation and Scatchard plots, respectively, according to a single-site model. In this experiment, KD = 11 ± 1 nM and Bmax = 2.56 ± 0.07 nM. (C) Representative competition for [3H]epibatidine binding sites by α-BgTx for ChimB (filled circles) or ChimB/P193I (open circles) microchimeras. Membrane fragments were first incubated with various concentrations of α-BgTx (as indicated) until equilibrium, 10 nM [3H]epibatidine was then added for 1 h and samples were filtered and counted. Data were normalized to values determined in the absence of α-BgTx. Data points are means of duplicates of a representative experiment. Specific [3H]epibatidine binding was determined in the presence of 1 mM nicotine (filled square). Also indicated is [3H]epibatidine binding in the presence of 1 mM carbamylcholine (open square) for both mutants. Data were fitted to non-linear least-squares analysis according to a single-site inhibition model. Note that in this representative experiment, α-BgTx displaced at most 60% of bound [3H]epibatidine, whereas nicotine or carbamycholine displayed almost 100 and 91% of bound [3H]epibatidine, respectively.
None
Fig. 3. (A) Competition binding curves for either [125I]α-BgTx (broken curves; open symbols) or [3H]epibatidine (solid curves; filled symbols) binding sites by α-BgTx to α7/5HT3 (open triangles), ChimB (filled and open circles) and G152K/P193I (filled triangles). For [125I]α-BgTx binding, membrane fragments of α7/5HT3 or ChimB were incubated with various concentrations of α-BgTx for 2 h, 2.5 nM [125I]α-BgTx was added for 5 min (initial velocity conditions) and samples were filtered and counted. For [3H]epibatidine binding, the protocol given in the caption to Figure 2C was used. Data were normalized to values determined in the absence of α-BgTx. Non-specific binding was determined in the presence of 100 µM α-BgTx. Data are means ± SE of at least three independent experiments performed in duplicate. For clarity, standard errors were omitted for [125I]α-BgTx binding for ChimB and α7/5HT3 data. (B) Representative whole-cell patch–clamp traces of inhibition of ACh-induced currents by α-BgTx. Upper panel: application of 1 mM ACh for 3 s to a cell expressing α7/5HT3 receptors induced an inward current (dark trace). Preincubation of the same cell with 20 nM α-BgTx for 10 min inhibited 1 mM ACh-induced current strongly (light trace). Lower panel: same protocol as in the upper panel but with the G152K/P193I double mutant. In this representative experiment, preincubation with 100 nM α-BgTx for 10 min did not inhibit 1 mM ACh-induced current. (C) Mutational scanning of α-BgTx affinity binding for the loop B region. The drawing on the right is a schematic representation of the double mutant series (see caption to Figure 1 for explanation). The α4 sequence (black box in the schematic representation) is shown in bold underlined type, while α7 is represented in light-face type. Data are means ± SE of at least two experiments (see Table I). The asterisk represents values that are statistically different from α7/5HT3 using an unpaired Student’s t-test (p < 0.025).
None
Fig. 4. van der Waals volume contribution to α-BgTx binding explored by mutation at position 152 with (filled circles) or without (open circles) mutant P193I. Each point is the mean ± SE from receptors containing the indicated mutation at position 152. Note that suppression of the putative N-gycosylation signal NWS by mutating S154A in G152N/P193I mutant (sequence NWA) increased apparent affinity binding for α-BgTx (see Table I for values). Data were fitted to the linear regression y = a log[x] + b. Filled circles, R = 0.996 for solid line (a = 56 ± 3 Å3 l/mol) and R = 0.902 for broken line (a = 45 ± 11 Å3 l/mol); open circles, R = 0.758 for chain line (a = 67 ± 33 Å3 l/mol). For the solid line, G152N/S154A/P193I mutant data (sequence NWA) were not included in the linear regression fit.
None
Fig. 5. (A) Competition binding curves by epibatidine (left panel) or nicotine (right panel) to [125I]α-BgTx binding sites for α7/5HT3 wild-type receptor (filled circles), G152K mutant (diamonds) and P193I mutant (triangles) or to [3H]epibatidine binding sites for G152K/P193I mutant (squares). For [125I]α-BgTx binding, membrane fragments of mutant and wild-type receptors were incubated with various concentrations of the indicated ligands until equilibrium, 2.5 nM [125I]α-BgTx was added for 5 min (initial velocity conditions) and samples were filtered and counted. For [3H]epibatidine binding, membrane fragments of G152K/P193I mutant were incubated with various concentrations of the indicated ligands, 10 nM [3H]epibatidine was added until equilibrium and samples were filtered and counted. Data normalized to values determined in the absence of ligand are the means of at least two independent experiments performed in duplicate. For clarity, standard errors are omitted. Data were fitted by the empirical Hill equation. (B) Interaction energies of G152K and P193I mutations. Upper panel: mutant cycle analysis for ACh binding between G152K and P193I. Lower panel: histograms indicating changes in the binding free energy ΔΔG upon mutations of G152K, P193I (gray boxes) and G152K/P193I (black boxes) for epibatidine, nicotine and ACh. The white dashed segments of the bars represent interaction free energies ΔΔGINT between mutants (see Table II for values).
None
Fig. 6. (A) Typical whole-cell patch–clamp traces evoked by the indicated concentration (µM) of ACh for 3 s in cells transfected with wild-type α7/5HT3 (upper panel) or the double mutant G152K/P193I (lower panel). To the right of the recordings, the solid lines correspond to the model-generated currents evoked by the indicated concentrations of ACh (same concentrations as experimental recordings) using the minimal three-state allosteric– kinetic model. The inset shows model-generated currents evoked by the indicated concentrations (µM) of ACh using the three-state (solid lines) or two-state (without desensitization, dotted lines) model. The kinetic pathways between the basal (B), open (A) and desensitized (D) states are also indicated. The short bold arrow indicates the affected kinetic pathway in the G152K/P193I mutant. (B) Left panel: ACh dose–response relationship of α7/5HT3 wild-type receptor (filled circles) and G152K (diamonds), P193I (triangles) and G152K/P193I (squares) mutant receptors. Peak responses were normalized to maximum currents of each cell. For clarity, standard errors are omitted. Data were fitted by the empirical Hill equation (solid curves). The inset shows mean EC50 ± SE from curves obtained from different cells. Statistical differences from from wild type are indicated as follows (for values see Table III): *p < 0.005); **p < 0.001. Right panel: competition binding curves by ACh either to [125I]α-BgTx binding sites for α7/5HT3 wild-type receptor (filled circles), G152K mutant (diamonds), P193I mutant (triangles) or to [3H]epibatidine binding sites for G152K/P193I mutant (squares). The protocol is the same as described in the legend to Figure 5. Data are normalized to binding determined in the absence of ACh and are the means of at least two independent experiments performed in duplicate. For clarity, standard errors are omitted. Data were fitted by the empirical Hill equation (solid curves), while dashed curves are the best fit using the three-state allosteric model. Note that model-generated dose–response curves are identical for P193I and G152K/P193I mutants. For G152K/P193I mutant, binding data were fitted using equation (3) (see Materials and methods) with the parameters indicated in Table IV and with XEpi = 10 nM, BKEpi = 4 nM, DKEpi = 1 µM and BDL0 = 42.9. For G152K mutant data, the best fit was obtained with BKD = 33.2 µM, AKD = 1.2 µM and DKD = 0.2 µM, keeping all other parameters in Table IV unchanged.
None
Fig. 7. Stereo view of loops B and C of α7 ECD model (yellow) and G152K/P193I mutant (green) after equilibration and dynamic simulation for 10 ps. The side chains of residues 152 and 193 are orange for α7 and cyan for G152K/P193I mutant. The figure was constructed using VMD (Humphrey et al., 1996) and generated with RASTER3D (Merritt and Bacon, 1997).
None
Fig. 8. Stereo view of the interaction of α-BgTx (blue) and the principal (orange) and complementary (green) α7 subunits. The arrow pinpoints the close contact between the toxin and G152 and P193 nAChR. The figure was constructed using VMD (Humphrey et al., 1996) and generated with RASTER3D (Merritt and Bacon, 1997).
None
Scheme 1.

References

    1. Brejc K., van Dijk,W.J., Klaassen,R., Schuurmans,M., van der Oost,J., Smit,A.B. and Sixma,T.K. (2001) Crystal structure of AChBP reveals the ligand-binding domain of nicotinic receptors. Nature, 411, 269–276. - PubMed
    1. Carter P.J., Winter,G., Wilkinson,A.J. and Fersht,A.R. (1984) The use of double mutants to detect structural changes in the active site of the tyrosyl-tRNA synthetase (Bacillus stearothermophilus). Cell, 38, 835–840. - PubMed
    1. Case D.A. et al. (2002) AMBER 7. University of California, San Francisco, CA.
    1. Cheng Y.C. and Prusoff,W.H. (1973) Relationship between the inhibition constant (Ki) and the concentration of inhibitor which causes 50% inhibition (I50) of an enzymatic reaction. Biochem. Pharmacol., 22, 3099–3108. - PubMed
    1. Corringer P.J., Galzi,J.-L., Eisele,J.-L., Bertrand,S., Changeux,J.-P. and Bertrand,D. (1995) Identification of a new component of the agonist binding site of the nicotinic α7 homooligomeric receptor. J. Biol. Chem., 270, 11749–11752. - PubMed

Publication types

Associated data