

Structural basis for the recognition of ldb1 by the N-terminal LIM domains of LMO2 and LMO4
- PMID: 12727888
- PMCID: PMC156068
- DOI: 10.1093/emboj/cdg196
Structural basis for the recognition of ldb1 by the N-terminal LIM domains of LMO2 and LMO4
Abstract
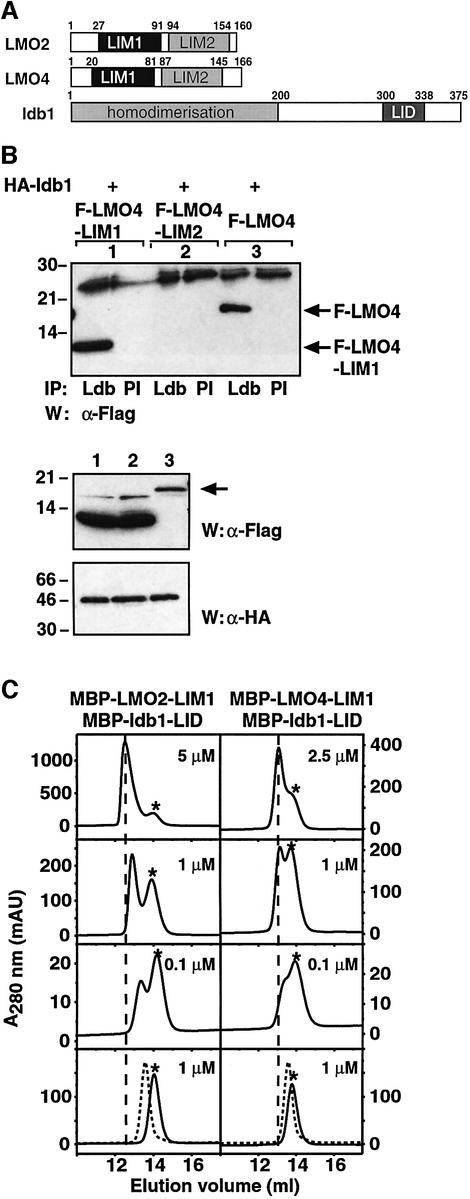
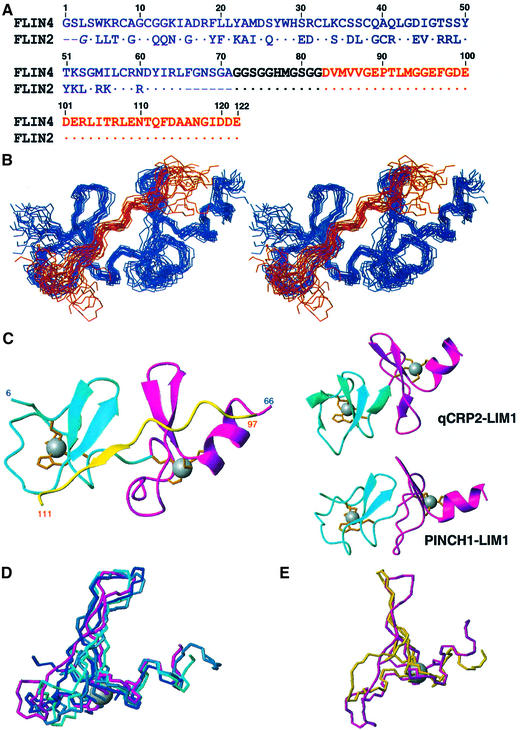
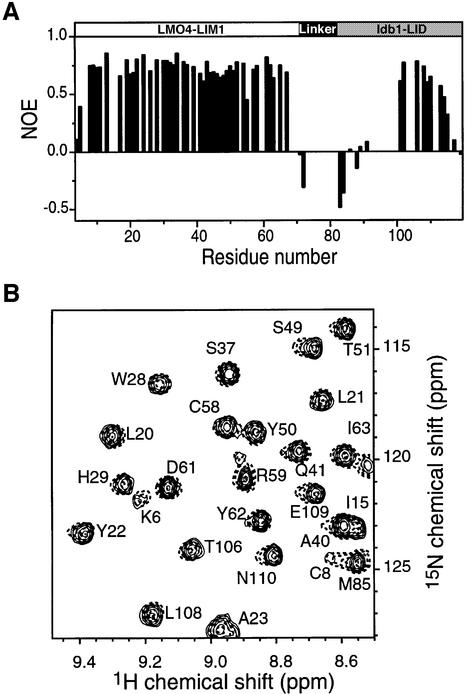
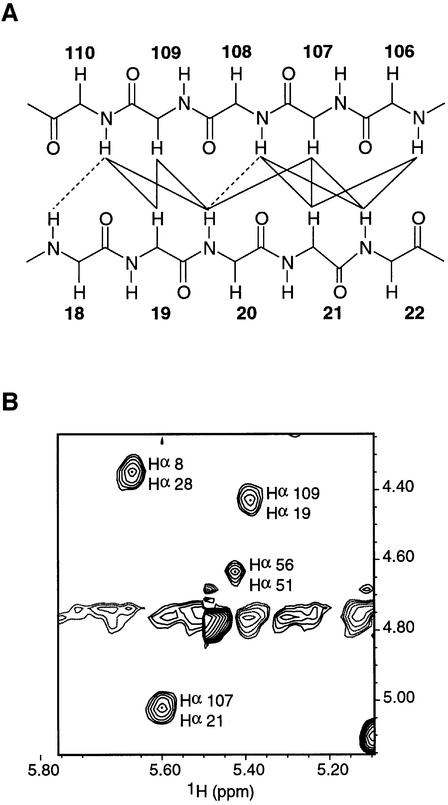
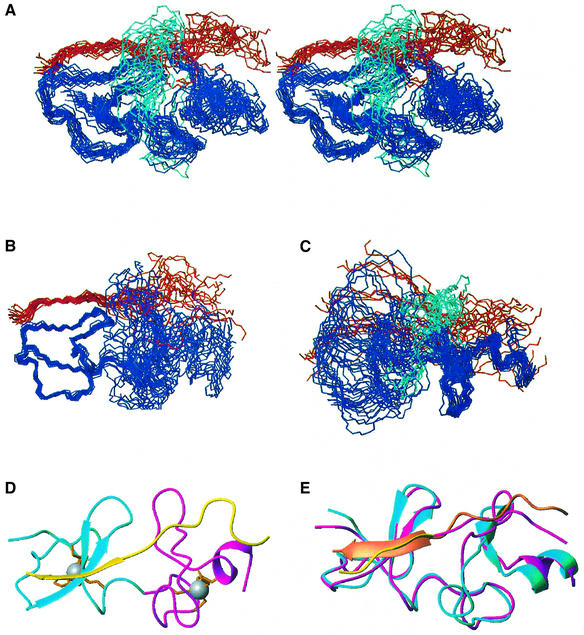
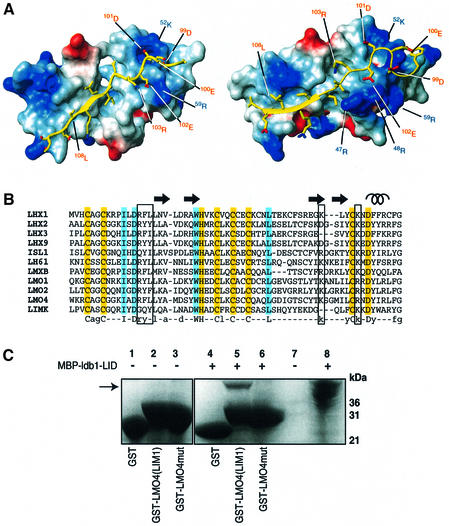
LMO2 and LMO4 are members of a small family of nuclear transcriptional regulators that are important for both normal development and disease processes. LMO2 is essential for hemopoiesis and angiogenesis, and inappropriate overexpression of this protein leads to T-cell leukemias. LMO4 is developmentally regulated in the mammary gland and has been implicated in breast oncogenesis. Both proteins comprise two tandemly repeated LIM domains. LMO2 and LMO4 interact with the ubiquitous nuclear adaptor protein ldb1/NLI/CLIM2, which associates with the LIM domains of LMO and LIM homeodomain proteins via its LIM interaction domain (ldb1-LID). We report the solution structures of two LMO:ldb1 complexes (PDB: 1M3V and 1J2O) and show that ldb1-LID binds to the N-terminal LIM domain (LIM1) of LMO2 and LMO4 in an extended conformation, contributing a third strand to a beta-hairpin in LIM1 domains. These findings constitute the first molecular definition of LIM-mediated protein-protein interactions and suggest a mechanism by which ldb1 can bind a variety of LIM domains that share low sequence homology.
Figures
Similar articles
-
Design, production and characterization of FLIN2 and FLIN4: the engineering of intramolecular ldb1:LMO complexes.Protein Eng. 2001 Jul;14(7):493-9. doi: 10.1093/protein/14.7.493. Protein Eng. 2001. PMID: 11522923
-
Identification of the key LMO2-binding determinants on Ldb1.J Mol Biol. 2006 May 26;359(1):66-75. doi: 10.1016/j.jmb.2006.02.074. Epub 2006 Mar 20. J Mol Biol. 2006. PMID: 16616188
-
Tandem LIM domains provide synergistic binding in the LMO4:Ldb1 complex.EMBO J. 2004 Sep 15;23(18):3589-98. doi: 10.1038/sj.emboj.7600376. Epub 2004 Sep 2. EMBO J. 2004. PMID: 15343268 Free PMC article.
-
LIM-domain-binding protein 1: a multifunctional cofactor that interacts with diverse proteins.EMBO Rep. 2003 Dec;4(12):1132-7. doi: 10.1038/sj.embor.7400030. EMBO Rep. 2003. PMID: 14647207 Free PMC article. Review.
-
Competition between LIM-binding domains.Biochem Soc Trans. 2008 Dec;36(Pt 6):1393-7. doi: 10.1042/BST0361393. Biochem Soc Trans. 2008. PMID: 19021562 Review.
Cited by
-
Structural basis for partial redundancy in a class of transcription factors, the LIM homeodomain proteins, in neural cell type specification.J Biol Chem. 2011 Dec 16;286(50):42971-80. doi: 10.1074/jbc.M111.248559. Epub 2011 Oct 24. J Biol Chem. 2011. PMID: 22025611 Free PMC article.
-
Interactions between LHX3- and ISL1-family LIM-homeodomain transcription factors are conserved in Caenorhabditis elegans.Sci Rep. 2017 Jul 4;7(1):4579. doi: 10.1038/s41598-017-04587-8. Sci Rep. 2017. PMID: 28676648 Free PMC article.
-
Functional diversification of the RING finger and other binuclear treble clef domains in prokaryotes and the early evolution of the ubiquitin system.Mol Biosyst. 2011 Jul;7(7):2261-77. doi: 10.1039/c1mb05061c. Epub 2011 May 6. Mol Biosyst. 2011. PMID: 21547297 Free PMC article.
-
LDB1 establishes multi-enhancer networks to regulate gene expression.bioRxiv [Preprint]. 2024 Aug 24:2024.08.23.609430. doi: 10.1101/2024.08.23.609430. bioRxiv. 2024. Update in: Mol Cell. 2025 Jan 16;85(2):376-393.e9. doi: 10.1016/j.molcel.2024.11.037. PMID: 39229045 Free PMC article. Updated. Preprint.
-
Implementing the LIM code: the structural basis for cell type-specific assembly of LIM-homeodomain complexes.EMBO J. 2008 Jul 23;27(14):2018-29. doi: 10.1038/emboj.2008.123. Epub 2008 Jun 26. EMBO J. 2008. PMID: 18583962 Free PMC article.
References
-
- Agulnick A.D., Taira,M., Breen,J.J., Tanaka,T., Dawid,I.B. and Westphal,H. (1996) Interactions of the LIM-domain-binding factor ldb1 with LIM homeodomain proteins. Nature, 384, 270–272. - PubMed
-
- Bach I. (2000) The LIM domain: regulation by association. Mech. Dev., 91, 5–17. - PubMed
-
- Bach I., Carriere,C., Ostendorff,H.P. Andersen,B. and Rosenfeld,M.G. (1997) A family of LIM domain-associated cofactors confer transcriptional synergism between LIM and Otx homeodomain proteins. Genes Dev., 11, 1370–1380. - PubMed
-
- Bax A., Vuister,G.W., Grzesiek,S., Delaglio,F., Wang,A.C., Tschudin,R. and Zhu,G. (1994) Measurement of homo- and heteronuclear J couplings from quantitative J correlation. Methods Enzymol., 239, 79–105. - PubMed
-
- Breen J.J., Agulnick,A.D., Westphal,H. and Dawid,I.B. (1998) Interactions between LIM domains and the LIM domain-binding protein Ldb1. J. Biol. Chem., 273, 4712–4717. - PubMed
Publication types
MeSH terms
Substances
LinkOut - more resources
Full Text Sources
Other Literature Sources
Molecular Biology Databases
