DNA analysis by fluorescence quenching detection
- PMID: 12727909
- PMCID: PMC430929
- DOI: 10.1101/gr.987803
DNA analysis by fluorescence quenching detection
Abstract
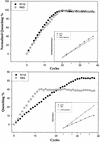
The analysis of human genetic variations such as single nucleotide polymorphisms (SNPs) has great applications in genome-wide association studies of complex genetic traits. We have developed an SNP genotyping method based on the primer extension assay with fluorescence quenching as the detection. The template-directed dye-terminator incorporation with fluorescence quenching detection (FQ-TDI) assay is based on the observation that the intensity of fluorescent dye R110- and R6G-labeled acycloterminators is universally quenched once they are incorporated onto a DNA oligonucleotide primer. By comparing the rate of fluorescence quenching of the two allelic dyes in real time, we have extended this method for allele frequency estimation of SNPs in pooled DNA samples. The kinetic FQ-TDI assay is highly accurate and reproducible both in genotyping and in allele frequency estimation. Allele frequencies estimated by the kinetic FQ-TDI assay correlated well with known allele frequencies, with an r(2) value of 0.993. Applying this strategy to large-scale studies will greatly reduce the time and cost for genotyping hundreds and thousands of SNP markers between affected and control populations.
Figures


Similar articles
-
Kinetic fluorescence-quenching detection assay for allele frequency estimation.Methods Mol Biol. 2005;311:115-23. doi: 10.1385/1-59259-957-5:115. Methods Mol Biol. 2005. PMID: 16100403
-
Kinetic FP-TDI assay for SNP allele frequency determination.Biotechniques. 2003 Jan;34(1):190-7. doi: 10.2144/03341dd08. Biotechniques. 2003. PMID: 12545559
-
Template-directed dye-terminator incorporation (TDI) assay: a homogeneous DNA diagnostic method based on fluorescence resonance energy transfer.Nucleic Acids Res. 1997 Jan 15;25(2):347-53. doi: 10.1093/nar/25.2.347. Nucleic Acids Res. 1997. PMID: 9016564 Free PMC article.
-
Approaches to allele frequency determination.Pharmacogenomics. 2000 May;1(2):231-5. doi: 10.1517/14622416.1.2.231. Pharmacogenomics. 2000. PMID: 11256594 Review.
-
Fluorescence resonance energy transfer (FRET) using ssDNA binding fluorescent dye.Biomol Eng. 2004 Apr;21(2):45-50. doi: 10.1016/j.bioeng.2003.09.001. Biomol Eng. 2004. PMID: 15113557 Review.
Cited by
-
Development and Evaluation of an Enterovirus D68 Real-Time Reverse Transcriptase PCR Assay.J Clin Microbiol. 2015 Aug;53(8):2641-7. doi: 10.1128/JCM.00923-15. Epub 2015 Jun 10. J Clin Microbiol. 2015. PMID: 26063859 Free PMC article.
-
Real-time closed tube single nucleotide polymorphism (SNP) quantification in pooled samples by quencher extension (QEXT).Nucleic Acids Res. 2003 Oct 1;31(19):e117. doi: 10.1093/nar/gng118. Nucleic Acids Res. 2003. PMID: 14500845 Free PMC article.
-
Application of pooled genotyping to scan candidate regions for association with HDL cholesterol levels.Hum Genomics. 2004 Nov;1(6):421-34. doi: 10.1186/1479-7364-1-6-421. Hum Genomics. 2004. PMID: 15606997 Free PMC article.
-
A single molecular beacon probe is sufficient for the analysis of multiple nucleic acid sequences.Chembiochem. 2010 Aug 16;11(12):1762-8. doi: 10.1002/cbic.201000287. Chembiochem. 2010. PMID: 20665615 Free PMC article.
-
Rapid genotyping using pyrene-perylene locked nucleic acid complexes.Artif DNA PNA XNA. 2013 Apr-Jun;4(2):58-68. doi: 10.4161/adna.25903. Artif DNA PNA XNA. 2013. PMID: 24044052 Free PMC article.
References
-
- Breen G., Harold, D., Ralston, S., Shaw, D., and St Clair, D. 2000. Determining SNP allele frequencies in DNA pools. Biotechniques 28: 464-466., 468–470. - PubMed
-
- Giordano M., Mellai, M., Hoogendoorn, B., and Momigliano-Richiardi, P. 2001. Determination of SNP allele frequencies in pooled DNAs by primer extension genotyping and denaturing high-performance liquid chromatography. J. Biochem. Biophys. Methods 47: 101-110. - PubMed
-
- Gruber J.D., Colligan, P.B., and Wolford, J.K. 2002. Estimation of single nucleotide polymorphism allele frequency in DNA pools by using pyrosequencing. Hum. Genet. 110: 395-401. - PubMed
MeSH terms
Substances
LinkOut - more resources
Full Text Sources
Other Literature Sources
