. 2003 May;111(9):1423-32.
doi: 10.1172/JCI17975.

PTG gene deletion causes impaired glycogen synthesis and developmental insulin resistance

Affiliations

PTG gene deletion causes impaired glycogen synthesis and developmental insulin resistance

Sean M Crosson et al. J Clin Invest. 2003 May.

Abstract

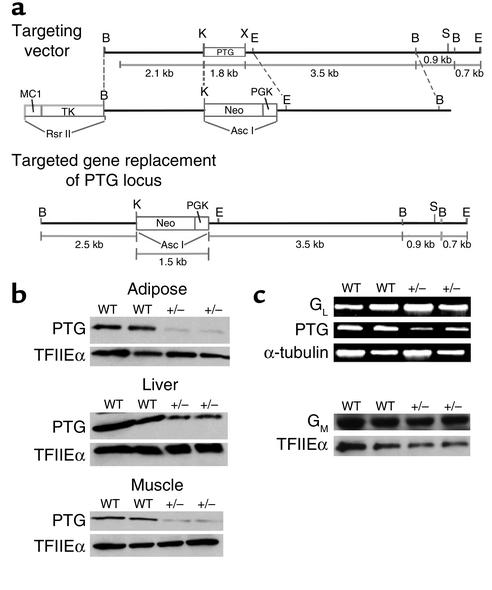
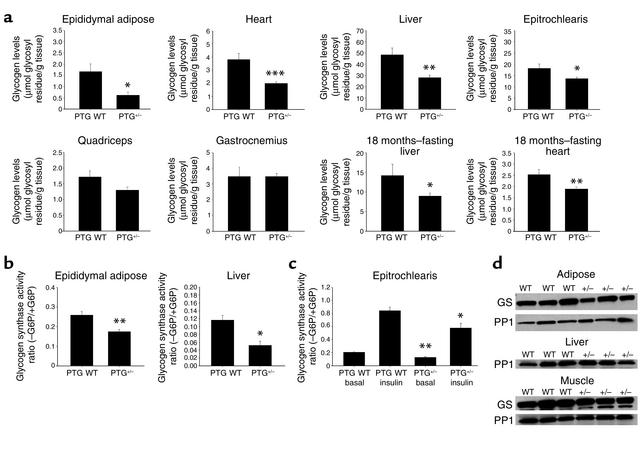
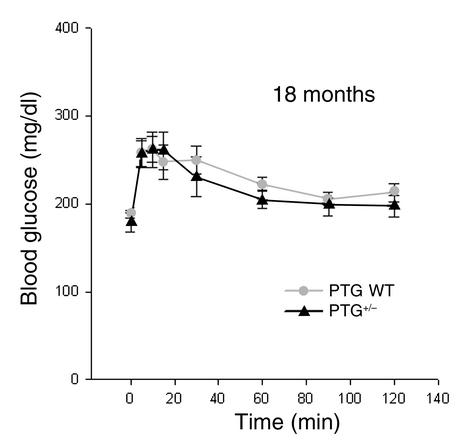
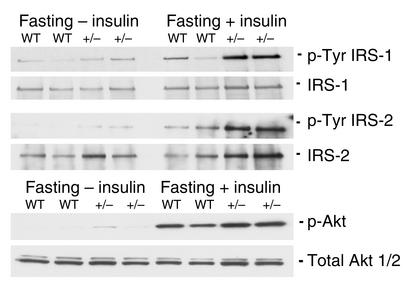
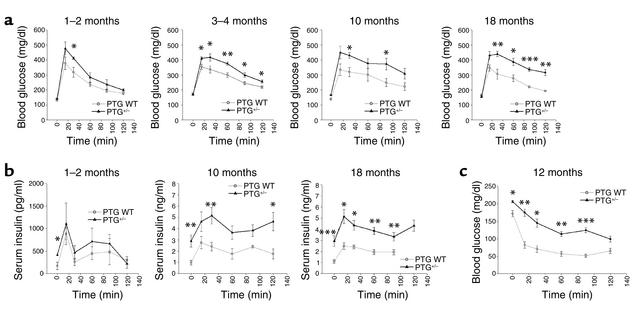
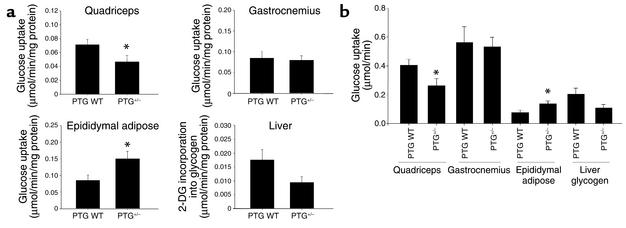
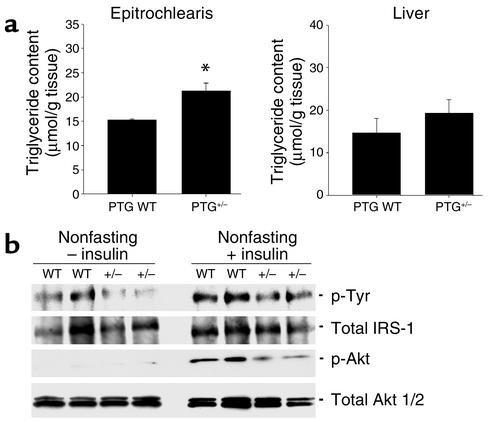
Protein targeting to glycogen (PTG) is a scaffolding protein that targets protein phosphatase 1alpha (PP1alpha) to glycogen, and links it to enzymes involved in glycogen synthesis and degradation. We generated mice that possess a heterozygous deletion of the PTG gene. These mice have reduced glycogen stores in adipose tissue, liver, heart, and skeletal muscle, corresponding with decreased glycogen synthase activity and glycogen synthesis rate. Although young PTG heterozygous mice initially demonstrate normal glucose tolerance, progressive glucose intolerance, hyperinsulinemia, and insulin resistance develop with aging. Insulin resistance in older PTG heterozygous mice correlates with a significant increase in muscle triglyceride content, with a corresponding attenuation of insulin receptor signaling. These data suggest that PTG plays a critical role in glycogen synthesis and is necessary to maintain the appropriate metabolic balance for the partitioning of fuel substrates between glycogen and lipid.


Figures

Figure 1
Figure 1
Mice possessing a heterozygous deletion of the PTG gene display reduced PTG protein levels while the expression of GL and GM are not altered. (a) The entire 1-kb coding region of the intronless PTG gene was targeted for disruption. PTG heterozygous mice were generated as outlined in Methods and then backcrossed for five generations to inbred C57BL/6J mice. (b) PTG protein levels are reduced in insulin-responsive tissues of PTG+/– mice. Tissue homogenates were prepared from nonfasted 1- to 2-month-old male animals and analyzed by Western blotting. Equivalent loading was insured by analysis of the levels of the basal transcription factor TFIIEα. (c) The expression levels of the tissue-specific glycogen-targeting subunits GM and GL are unchanged in PTG heterozygous mice. The expression level of GL at the mRNA level was analyzed by RT-PCR using liver total RNA isolated from nonfasting 1- to 2-month-old male animals. The expression of GM was analyzed by Western blotting and equivalent loading was insured by analysis of the levels of TFIIEα.
Figure 2
Figure 2
Reduction of PTG protein levels leads to reduced glycogen stores due to decreased basal and insulin-stimulated glycogen synthesis. (a) PTG+/– mice display reduced glycogen stores. Glycogen levels were analyzed from tissues isolated from nonfasted 1- to 2-month-old male animals (n = 6 per group: adipose and heart; n = 7–8 per group: liver, epitrochlearis, and quadriceps; n = 3–6 per group: gastrocnemius) or from fasted 18-month-old male animals (n = 4–10 per group, liver; n = 4–12 per group, heart). Results are reported as mean ± SEM. *P ≤ 0.05; **P ≤ 0.01; ***P ≤ 0.005. (b) Glycogen synthase activity ratio is decreased in insulin-responsive tissues of PTG+/– mice. Glycogen synthase activity was assayed in tissue homogenates prepared from 1- to 2-month-old male animals in the nonfasting state (n = 9 per group, adipose; n = 7–8 per group, liver). Results are reported as mean ± SEM (*P ≤ 0.002; **P ≤ 0.001). G6P, glucose-6-phosphate. (c) Basal and insulin-stimulated glycogen synthase activity ratio is decreased in skeletal muscle of PTG+/– mice. Glycogen synthase activity was assayed in homogenates of forelimb epitrochlearis muscle in the basal state and after stimulation with 2 mU/g body weight human recombinant insulin. Animals were 1- to 2-month-old males in the nonfasting state (n = 4–7 per group). Results are reported as mean ± SEM (*P ≤ 0.05; **P ≤ 0.002). (d) The levels of total cellular glycogen synthase (GS) and PP1 protein are unchanged in adipose, liver, and epitrochlearis muscle of PTG+/– mice. Total cellular levels of glycogen synthase or PP1 protein were analyzed by Western blotting of tissue homogenates prepared from 1- to 2-month-old male animals in the nonfasting state. It should be noted that the anti–skeletal muscle glycogen synthase antibody used cannot detect the liver isoform of glycogen synthase.
Figure 3
Figure 3
Hepatic glucose release in response to glucagon is not altered in PTG+/– mice. Male animals at 18 months of age in the nonfasting state were used for glucagon tolerance tests (n = 4–6 per group). Results are reported as mean ± SEM.
Figure 4
Figure 4
Liver insulin signaling is not impaired in PTG+/– mice. Protein lysates were prepared from liver of 3- to 4-month-old fasting male animals either in the basal state after intravenous injection with PBS or after intravenous injection with 2 mU/g body weight human recombinant insulin. Western blotting was performed for total and phosphospecific Akt. Liver homogenates were immunoprecipitated with an antibody against IRS-1 or IRS-2 and immunoblotting was performed to determine the levels of total IRS-1 and IRS-2 brought down in the immunoprecipitation and for levels of tyrosine-phosphorylated IRS-1 or IRS-2.
Figure 5
Figure 5
PTG+/– mice display glucose intolerance, moderate hyperinsulinemia, and insulin resistance with aging. (a) Fasting PTG+/– mice display the development of glucose intolerance with aging. Male animals fasted for 16 hours overnight were used for glucose tolerance experiments (n = 4–12 per group). Results are reported as mean ± SEM. (*P ≤ 0.05; **P ≤ 0.005; ***P ≤ 0.0002). Age of animals is shown at upper right of each graph. (b) Serum insulin levels of PTG+/– mice are elevated in the fasting state and in response to a glucose bolus during the intraperitoneal glucose tolerance test. Insulin levels were measured from additional sera collected at the time of the intraperitoneal glucose tolerance tests (n = 4–12 group). Results are reported as mean ± SEM (*P ≤ 0.05; **P ≤ 0.02; ***P ≤ 0.005). (c) Nonfasting PTG+/– mice display moderate insulin resistance at 12 months of age. Male animals in the nonfasting state were used for insulin tolerance experiments (n = 4–12 per group). Results are reported as mean ± SEM (*P ≤ 0.002; **P ≤ 0.001; ***P ≤ 0.0005).
Figure 6
Figure 6
PTG+/– mice have decreased glucose transport into white fiber muscle and decreased liver glycogen synthesis with a compensatory increase in epididymal adipose glucose transport during an intraperitoneal glucose tolerance test. (a) Male animals 3–4 months of age were fasted overnight for 16 hours and used for in vivo glucose uptake experiments (n = 8 wild-type and 9 PTG+/– animals). Results are reported as mean ± SEM (*P ≤ 0.05). 2-DG, 2-deoxyglucose. (b) The increase in epididymal adipose glucose transport in PTG+/– mice cannot fully compensate for the decreases in quadriceps glucose transport and liver glycogen synthesis. Results from part a are corrected for the average protein mass of each tissue to give relative values of glucose uptake during the intraperitoneal glucose tolerance test. Results are reported as mean ± SEM (*P ≤ 0.05).
Figure 7
Figure 7
Skeletal muscle of 18-month-old PTG+/– mice displays increased triglyceride content and inhibition of insulin signaling pathways involved in glucose transport and glycogen synthesis. (a) Skeletal muscle triglyceride content is increased in 18-month-old PTG+/– mice. Skeletal muscle triglyceride content was estimated from organic solvent–extracted epitrochlearis muscle isolated from fasting 18-month-old animals (n = 4–12 per group). Results are reported as mean ± SEM (*P ≤ 0.05). (b) Insulin signaling is affected in the skeletal muscle of aged PTG+/– mice. Protein lysates were prepared from muscle of 9- to 10-month-old nonfasting male animals either in the basal state or after injection with 2 mU/g body weight human recombinant insulin. Western blotting was performed for total and phosphospecific Akt. Muscle homogenates were immunoprecipitated with an antibody against IRS-1 and immunoblotting was performed to determine the levels of total IRS-1 and tyrosine-phosphorylated IRS-1.

Comment in

References

    1. Lawrence JC, Roach PJ. New insights into the role and mechanism of glycogen synthase activation by insulin. Diabetes. 1997;46:541–547. - PubMed
    1. Shulman RG, Rothman DL. Enzymatic phosphorylation of muscle glycogen synthase: a mechanism for maintenance of metabolic homeostasis. Proc. Natl. Acad. Sci. U. S. A. 1996;93:7491–7495. - PMC - PubMed
    1. Ingebritsen TS, Foulkes JG, Cohen P. The protein phosphatases involved in cellular regulation. 2. Glycogen metabolism. Eur. J. Biochem. 1983;132:263–274. - PubMed
    1. Krebs EG. Phosphorylation and dephosphorylation of glycogen phosphorylase: a prototype for reversible covalent enzyme modification. Curr. Top. Cell. Regul. 1981;18:401–419. - PubMed
    1. Dent P, et al. The molecular mechanism by which insulin stimulates glycogen synthesis in mammalian skeletal muscle. Nature. 1990;348:302–308. - PubMed

Publication types

MeSH terms