. 2003 Apr 28;62(1-3):49-64.
doi: 10.1016/s0376-6357(03)00017-2.

MPR

Affiliations

MPR

Peter R. Killeen et al. Behav Processes. .

Abstract

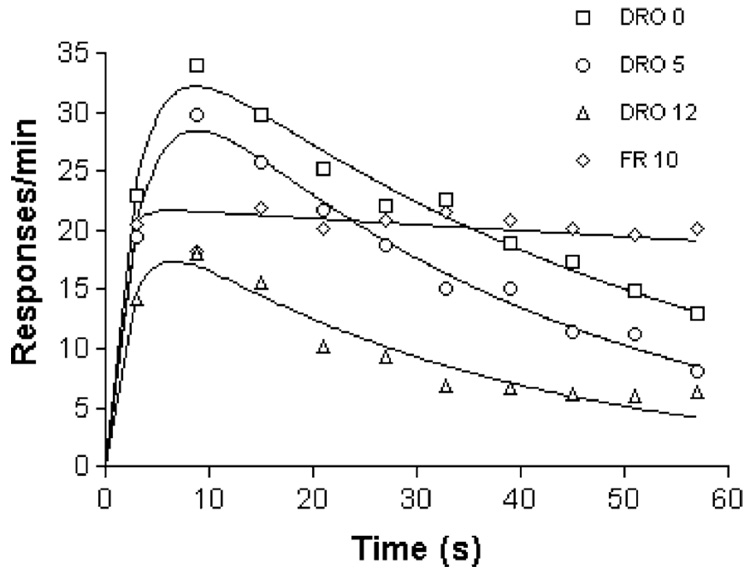
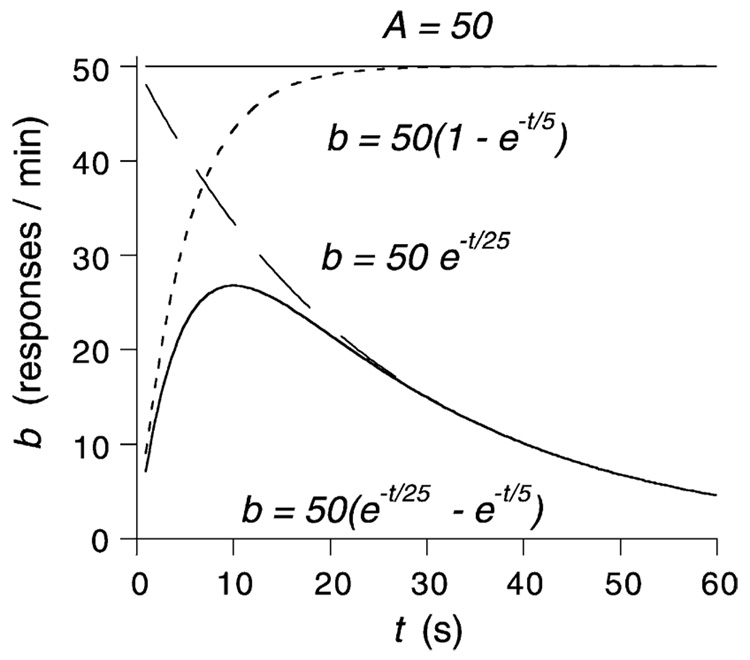
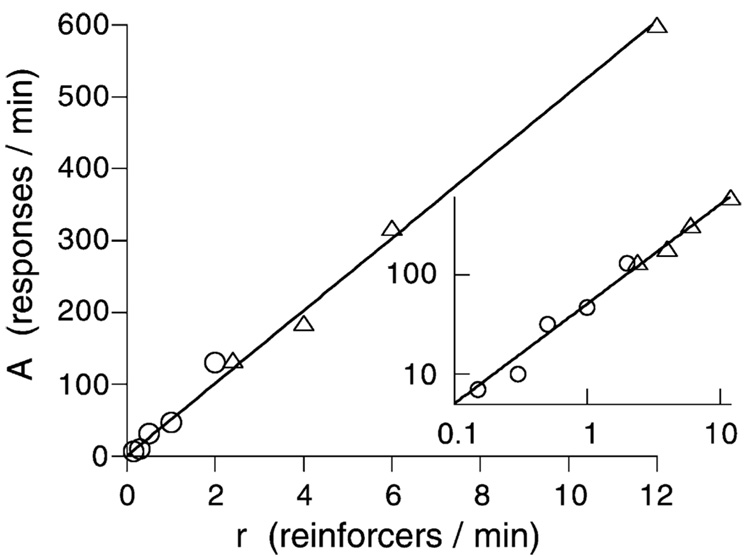
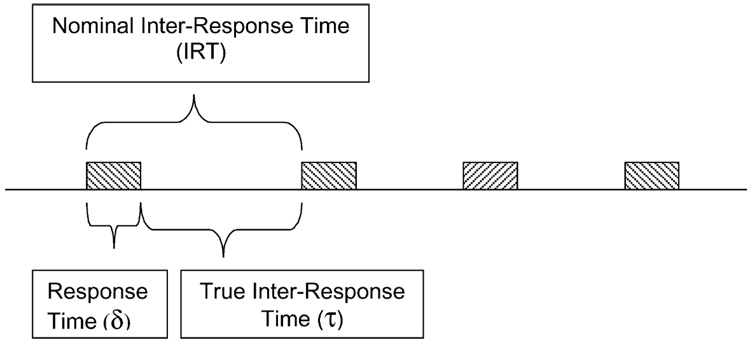
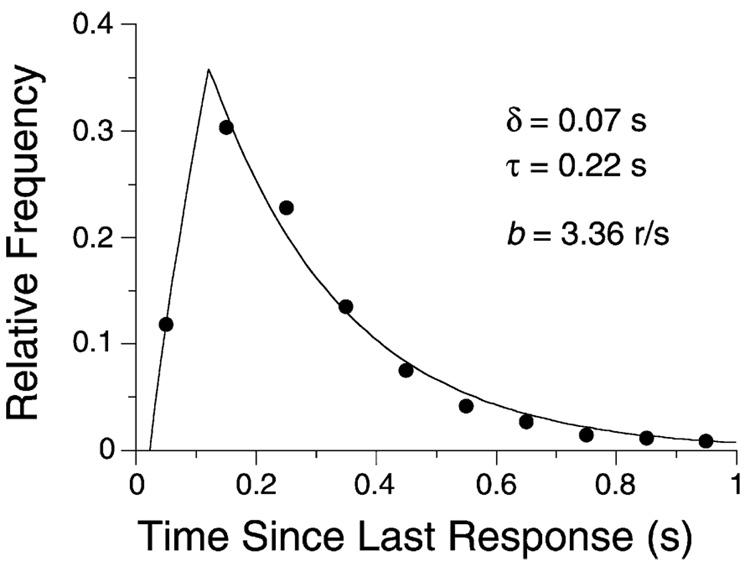
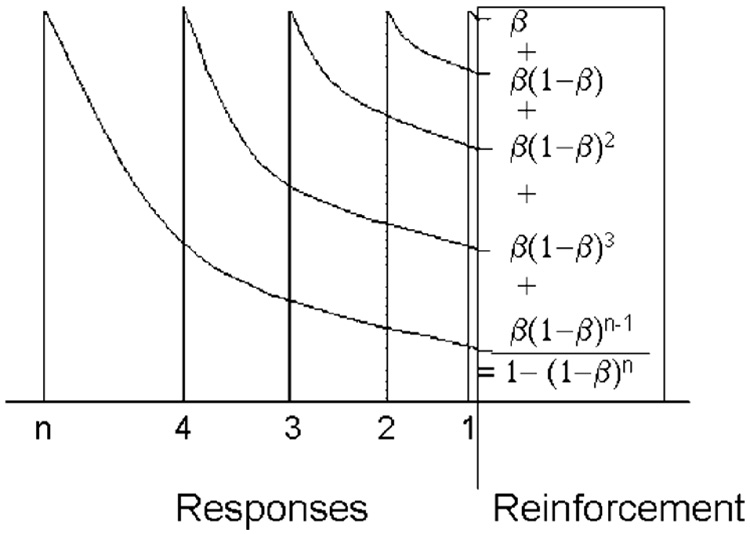
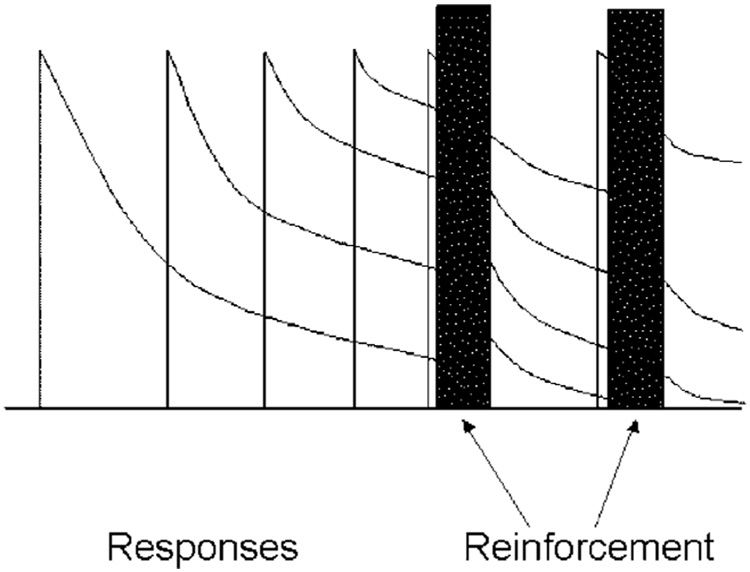
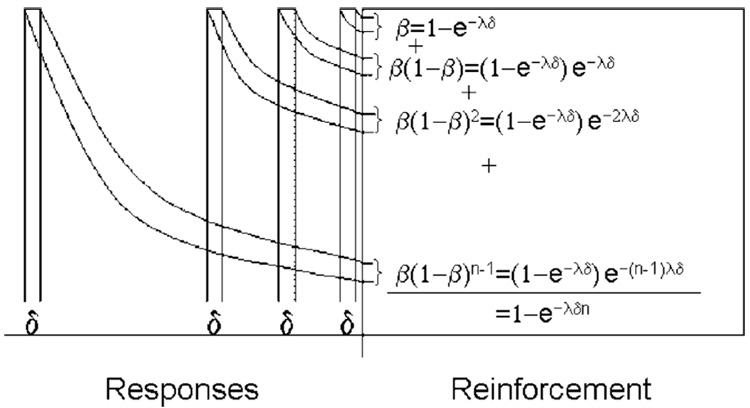
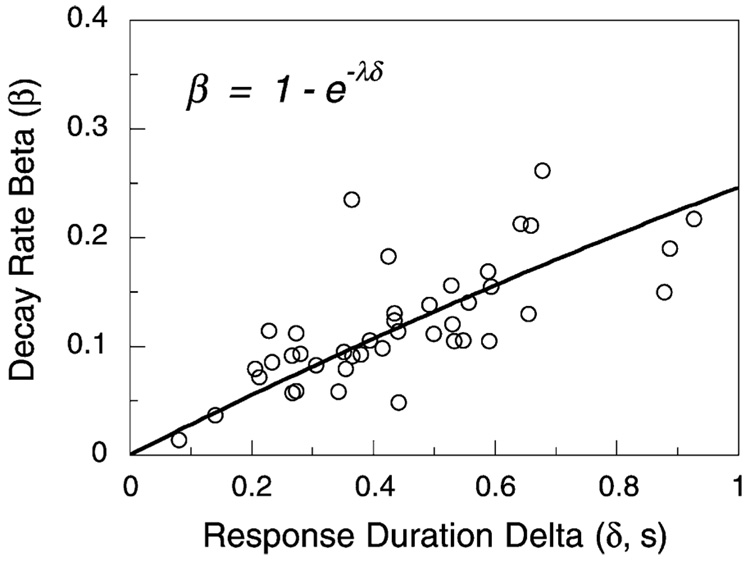
Mathematical Principles of Reinforcement (MPR) is a theory of reinforcement schedules. This paper reviews the origin of the principles constituting MPR: arousal, association and constraint. Incentives invigorate responses, in particular those preceding and predicting the incentive. The process that generates an associative bond between stimuli, responses and incentives is called coupling. The combination of arousal and coupling constitutes reinforcement. Models of coupling play a central role in the evolution of the theory. The time required to respond constrains the maximum response rates, and generates a hyperbolic relation between rate of responding and rate of reinforcement. Models of control by ratio schedules are developed to illustrate the interaction of the principles. Correlations among parameters are incorporated into the structure of the models, and assumptions that were made in the original theory are refined in light of current data.


Figures

Fig. 1
Fig. 1
The average rate of activation of floor panels in three experiments in which hungry pigeons were given one feeding per day, shown as a function of time since that feeding. The top two curves are offset by the factors noted. Straight lines in these semi-logarithmic coordinates evidence exponential decay of activity. From Killeen et al. (1978).
Fig. 2
Fig. 2
When shifted to periodic feedings, pigeons’ response rates increase toward their asymptote with each feeding. From Killeen et al. (1978).
Fig. 3
Fig. 3
The average rate of activation of floor panels in an experiment in which hungry pigeons were fed every t seconds, with t = 25, 60, 120, and 200 and 400 s, displayed over a normalized x-axis. Food was withheld until 5 s had elapsed without measured activity. The curves through the data are generalized Erlang distributions. From Killeen (1975).
Fig. 4
Fig. 4
Driving the system with periodic reinforcement may cause arousal to cumulate. From Killeen et al. (1978).
Fig. 5
Fig. 5
Imposition of contingencies to discourage responding (DRO) does not eliminate activity. From Killeen (1975).
Fig. 6
Fig. 6
The logic of the model of temporal control. A very slowly decaying level of arousal (A) is approximated by the straight line at 50. General activity is inhibited immediately after reinforcement, probably due to hopper-related activity. The inhibition dissipates exponentially, releasing the animal to move about as shown by the dotted curve. Subsequently, attention to the front panel and the hopper grows exponentially with time, depressing general activity as shown by the dashed curve. Squeezed between these forces, general activity follows the bitonic time course shown here and in Fig. 3.
Fig. 7
Fig. 7
Asymptotic response rates inferred from the model shown in Fig. 4 when applied to the data from Fig. 3 (open circles) and from another study reported in (Killeen, 1975). The inset shows the same data in logarithmic coordinates. The linear increase is predicted by the model shown in Fig. 4 and Fig. 6 (see Killeen et al., 1978, for details).
Fig. 8
Fig. 8
The decomposition of an IRT into its components: delta, the time required to complete a response, and tau, the time between responses.
Fig. 9
Fig. 9
The frequency with which different IRTs were emitted by a rat reinforced for every 80th response. The descending curve is an exponential decay function, consistent with a constant-probability emitter with a dead time of δ s. The rising curve plots the expected frequency of observation of IRTs in the interval Δ, as Δ increases from 0 to 0.1 s, plotted over abscissae of x = Δ/2. This figure shows the empirical relation between b = 1/IRT, δ, and τ, the rate of decay of the exponential. From Killeen et al. (2002).
Fig. 10
Fig. 10
Target (reinforced) response rates are plotted against rates of other responses in this state space. The diagonal is an iso-arousal contour, which shows the possible allocation of responses for a given level of arousal. Increases in arousal level move the diagonal out from the origin, up to the limiting constraint line when all available time is filled with responding (e.g. from 3 to 1). Contingencies of reinforcement move the operating point toward or away from the vertical (e.g. from 1 to 2).
Fig. 11
Fig. 11
Average satiation trajectory from six pigeons pecking a key for large amounts of food (Killeen and Bizo, 1998). Data from the first 10-min of the session are indicated by the filled triangle, and each 10 min thereafter by the open triangles. The linear descent to the origin indicates a decrease in arousal with little change in coupling.
Fig. 12
Fig. 12
Rates of pecking at a key providing food randomly every VIs on the average are plotted as a function of rate of pecking a second key providing food periodically every 30 s. The data are averages over one session for three pigeons, collected in trials lasting 100 s. Most movement is along iso-arousal contours, but deviation from diagonals indicates decreases in arousal during the last half of the trials. From Killeen (1992).
Fig. 13
Fig. 13
Reinforcement strengthens not only the last response but also prior ones, to a decreasing extent as they are remote from the reinforcer, illustrating the third principle of reinforcement. The equations within the reinforcement epoch represent the calculation of the coupling coefficient as the summation of the traces of the target responses.
Fig. 14
Fig. 14
Pigeons’ response rates on FR schedules of reinforcement with milo (left axis) or millet (right axis; notice the axis break). Data from Bizo and Killeen (1997). Projection of the linear portion gives y-axis intercepts of 1/δ = 3.1 responses/s, and x-axis intercepts of a = 78 for millet and 200 for the larger milo grain.
Fig. 15
Fig. 15
Average response rates of four rats on a series of VR schedules. The curve comes from Eq. (4) and the coupling coefficient for VR schedules, with parameters δ = 0.25 s, β = 0.76, and a = 350 responses/reinforcer.
Fig. 16
Fig. 16
Average response rates of four rats on a series of FR schedules. The curves are from Eq. (4) and the old coupling coefficient (dashed curve, Eq. (5)) or the new coefficient (continuous curve, Eq. (5′); parameters δ = 0.29 s, β = 0.25, and a = 200 responses/reinforcer).
Fig. 17
Fig. 17
Average response rates of five rats on a series of VR schedules. The curve comes from Eq. (4) and Eq. (6), with δ = 1/3 s, and β and a increasing with the number of pellets per reinforcement. From Bizo et al. (2001).
Fig. 18
Fig. 18
The traces of early responses may bleed through a reinforcer to receive additional strengthening by a later reinforcer. The rapid attrition of the traces during reinforcement is due to the vigorous consummatory responses occurring then. Traces of these consummatory responses, and the focal search occurring immediately after them, are shown carried forward to the second reinforcement epoch as candidates for reinforcement.
Fig. 19
Fig. 19
Responses of extended duration occupy more of memory, and therefore increase the rate of decay.
Fig. 20
Fig. 20
Eq. (4) and Eq. (5) fit to the data of 42 rats responding on multiple FR schedules yielded these recovered values of β and δ. Eq. (5″) incorporates this relation and orthogonalizes the parameters.

Similar articles

Cited by

References

    1. Baum WM. In search of the feedback function for variable-interval schedules. J. Exp. Anal. Beh. 1992;57:365–375. - PMC - PubMed
    1. Baum WM. Performances on ratio and interval schedules of reinforcement: data and theory. J. Exp. Anal. Beh. 1993;59:245–264. - PMC - PubMed
    1. Bharucha-Reid AT. Elements of the theory of Markov processes and their applications. New York: McGraw-Hill; 1960.
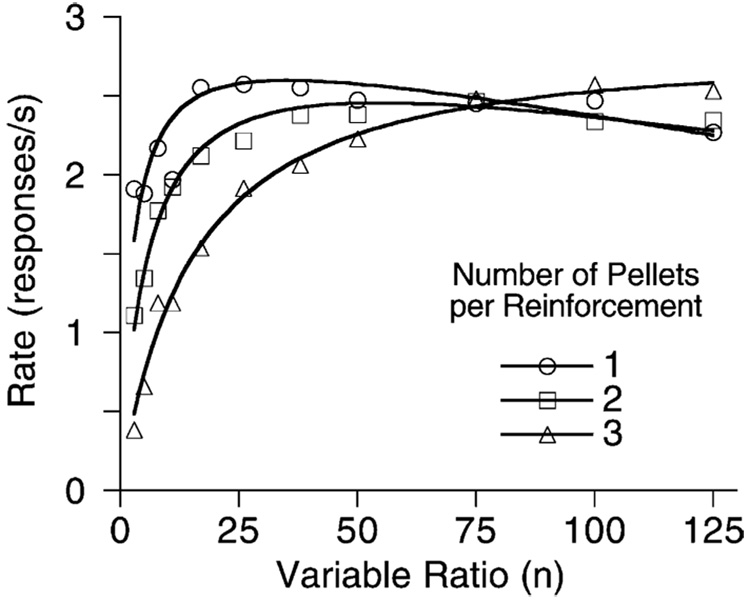
    1. Bizo LA, Kettle LC, Killeen PR. Rats don’t always respond faster for more food: the paradoxical incentive effect. Anim. Learn. Behav. 2001;29:66–78.
    1. Bizo LA, Killeen PR. Models of ratio schedule performance. J. Exp. Psychol.: Anim. Beh. Process. 1997;23:351–367. - PMC - PubMed

LinkOut - more resources