. 2003 May;185(10):3068-75.
doi: 10.1128/JB.185.10.3068-3075.2003.

Cell-cycle-regulated expression and subcellular localization of the Caulobacter crescentus SMC chromosome structural protein

Affiliations

Cell-cycle-regulated expression and subcellular localization of the Caulobacter crescentus SMC chromosome structural protein

Rasmus B Jensen et al. J Bacteriol. 2003 May.

Abstract

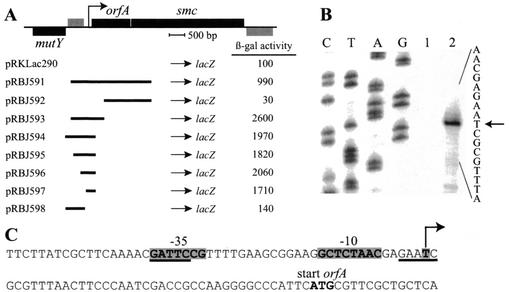
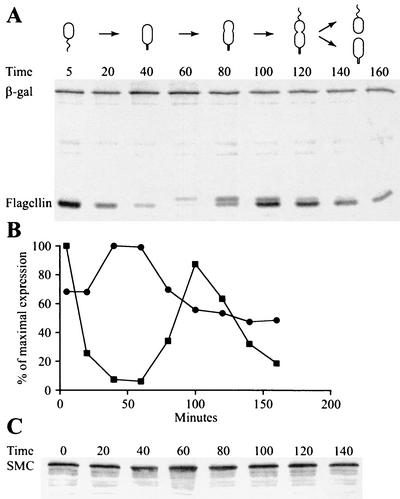
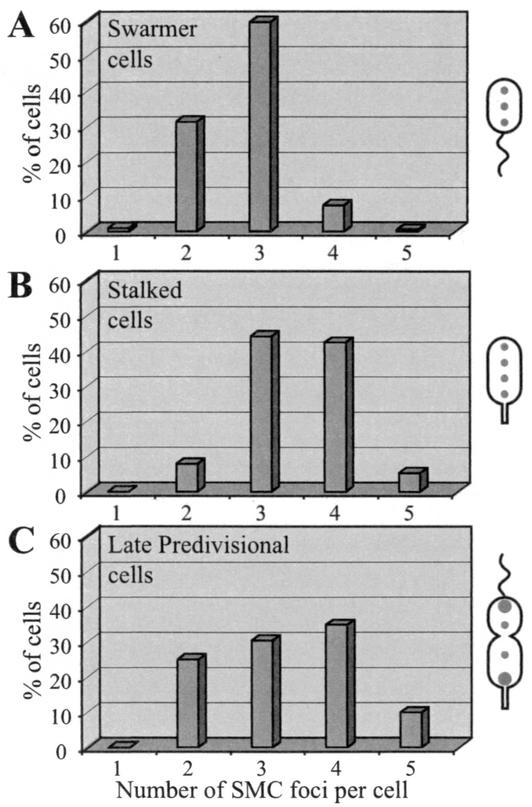
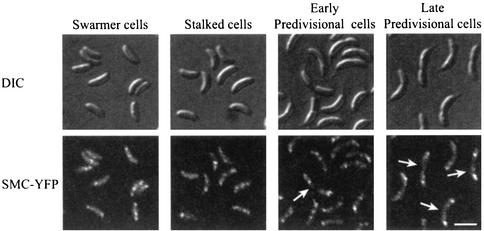
Structural maintenance of chromosomes proteins (SMCs) bind to DNA and function to ensure proper chromosome organization in both eukaryotes and bacteria. Caulobacter crescentus possesses a single SMC homolog that plays a role in organizing and segregating daughter chromosomes. Approximately 1,500 to 2,000 SMC molecules are present per cell during active growth, corresponding to one SMC complex per 6,000 to 8,000 bp of chromosomal DNA. Although transcription from the smc promoter is induced during early S phase, a cell cycle transcription pattern previously observed with multiple DNA replication and repair genes, the SMC protein is present throughout the entire cell cycle. Examination of the intracellular location of SMC showed that in swarmer cells, which do not replicate DNA, the protein forms two or three foci. Stalked cells, which are actively engaged in DNA replication, have three or four SMC foci per cell. The SMC foci appear randomly distributed in the cell. Many predivisional cells have bright polar SMC foci, which are lost upon cell division. Thus, chromosome compaction likely involves dynamic aggregates of SMC bound to DNA. The aggregation pattern changes as a function of the cell cycle both during and upon completion of chromosome replication.


Figures

FIG. 1.
FIG. 1.
Mapping of the promoter transcribing the smc gene. (A) Schematic showing the organization of the chromosomal region containing the smc gene. Bars above the line, genes (black) and an open reading frame (grey) transcribed from left to right; bars below the line, gene and open reading frame transcribed in the opposite direction. Arrow, orfA and smc promoter mapped in this study. Below is shown the extent of the regions upstream of smc that were cloned in front of a promoterless lacZ gene, resulting in different transcriptional fusions. The β-galactosidase activities (in Miller units) of strains containing these plasmids are shown. All activities reported are averages of at least four independent measurements. (B) Mapping of the transcriptional start site of the orfA and smc promoter by primer extension analysis. A DNA sequencing ladder was generated with the oligonucleotide used for the primer extension analysis. Lane 1, yeast tRNA; lane 2, total RNA isolated from Caulobacter cells. Arrow, only major band within the DNA region present in the pRBJ597 plasmid. (C) Sequence of the orfA and smc promoter region. Arrow, mapped start site; grey shading, promoter −35 and −10 elements. GAnTC methylation sites are underlined.
FIG. 2.
FIG. 2.
Analysis of the smc transcription pattern and SMC level during the cell cycle. (A) Swarmer cells from strain CB15N/pRBJ593, containing a Psmc-lacZ transcriptional fusion, were isolated and allowed to progress synchronously through the cell cycle. At the indicated times (minutes), an aliquot of the cells was pulse-labeled for 5 min with [35S]methionine. The β-galactosidase and the 25-kDa flagellin proteins were immunoprecipitated from cell lysates, followed by SDS-polyacrylamide electrophoresis. Schematics show cell cycle progression of the strain. (B) The amounts of radioactivity in the different bands were quantified with a phosphorimager. Circles, radioactivity in the β-galactosidase band; squares, radioactivity in the flagellin bands. (C) The relative amount of the SMC during the cell cycle was analyzed by Western blotting using anti-SMC antibodies. Samples were withdrawn at the indicated time points (minutes), and equal amounts of total protein were loaded in all lanes.
FIG. 3.
FIG. 3.
Intracellular localization of the SMC in cells at different stages of the Caulobacter cell cycle as determined by indirect immunofluorescence microscopy. Swarmer cells were isolated and allowed to progress synchronously through the cell cycle. When the cells reached the indicated stages of the cell cycle (0, 60, 90, or 120 min, respectively), they were fixed and the intracellular location of SMC was visualized by indirect immunofluorescence microscopy using affinity-purified anti-SMC antibodies. Only a low level of background signal was observed with a Δsmc strain, showing that the signal is specific for SMC. Shown are Nomarski DIC microscopy images of the cells, immunofluorescence microscopy (IFM) images of the cells showing the intracellular localizations of SMC, and images of 4′,6′-diamidino-2-phenylindole (DAPI)-stained chromosomal DNA in the cells. Arrows, typical predivisional cells with bright SMC staining near the poles of the cells. Bar, 2 μm.
FIG. 4.
FIG. 4.
Distribution of the numbers of SMC foci per cell in swarmer cells (A), stalked cells (B), and late predivisional cells (C). The numbers of SMC foci, visualized by immunofluorescence microscopy, per cell at each stage of the cell cycle were determined. The schematics to the right show cells at the respective stage of the cell cycle and typical SMC localization patterns. At least 200 cells were counted at each stage.
FIG. 5.
FIG. 5.
Intracellular localization of SMC in live cells at different stages of the cell cycle. SMC-YFP-expressing cells were synchronized, and samples were taken for microscopy when the cells reached the indicated stages (0, 60, 90, or 120 min into the cell cycle, respectively). DIC microscopy images of the cells (top) and YFP fluorescence (bottom) are shown. Arrows, predivisional cells with bright polar SMC-YFP foci. Scale bar, 2 μm.

References

    1. Akhmedov, A. T., C. Frei, M. Tsai-Pflugfelder, B. Kemper, S. M. Gasser, and R. Jessberger. 1998. Structural maintenance of chromosomes: protein C-terminal domains bind preferentially to DNA with secondary structure. J. Biol. Chem. 273:24088-24094. - PubMed
    1. Azam, T. A., A. Iwata, A. Nishimura, S. Ueda, and A. Ishihama. 1999. Growth phase-dependent variation in protein composition of the Escherichia coli nucleoid. J. Bacteriol. 181:6361-6370. - PMC - PubMed
    1. Blat, Y., and N. Kleckner. 1999. Cohesins bind to preferential sites along yeast chromosome III, with differential regulation along arms versus the centric region. Cell 98:249-259. - PubMed
    1. Britton, R. A., D. C. Lin, and A. D. Grossman. 1998. Characterization of a prokaryotic SMC protein involved in chromosome partitioning. Genes Dev. 12:1254-1259. - PMC - PubMed
    1. Cobbe, N., and M. M. Heck. 2000. Review: SMCs in the world of chromosome biology—from prokaryotes to higher eukaryotes. J. Struct. Biol. 129:123-143. - PubMed

Publication types

MeSH terms

LinkOut - more resources