. 2003 Jul 1;550(Pt 1):35-50.
doi: 10.1113/jphysiol.2002.033746. Epub 2003 May 2.

Action potentials in basal and oblique dendrites of rat neocortical pyramidal neurons

Affiliations

Action potentials in basal and oblique dendrites of rat neocortical pyramidal neurons

Srdjan D Antic. J Physiol. .

Abstract

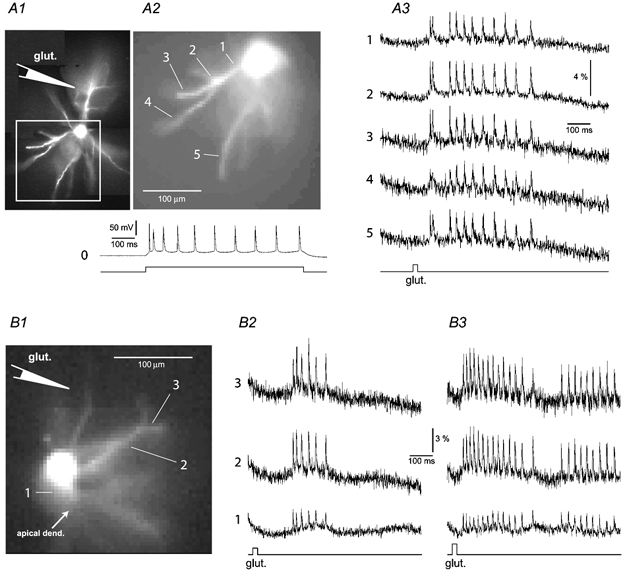
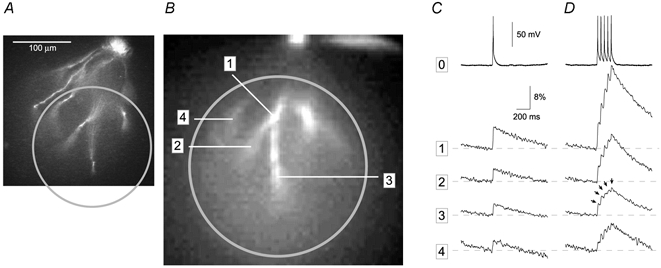
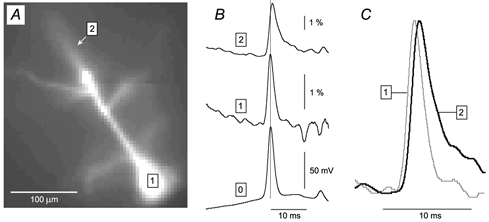
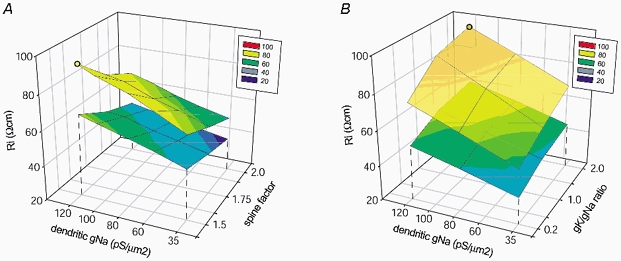
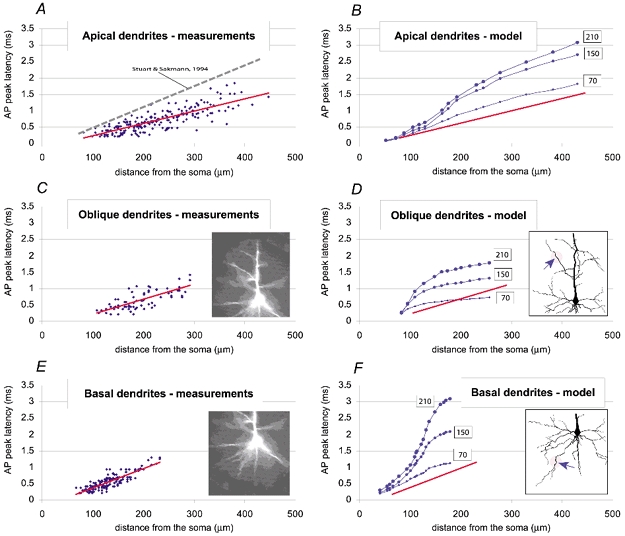
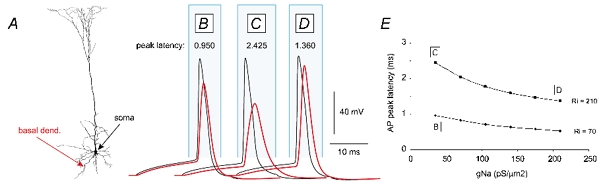
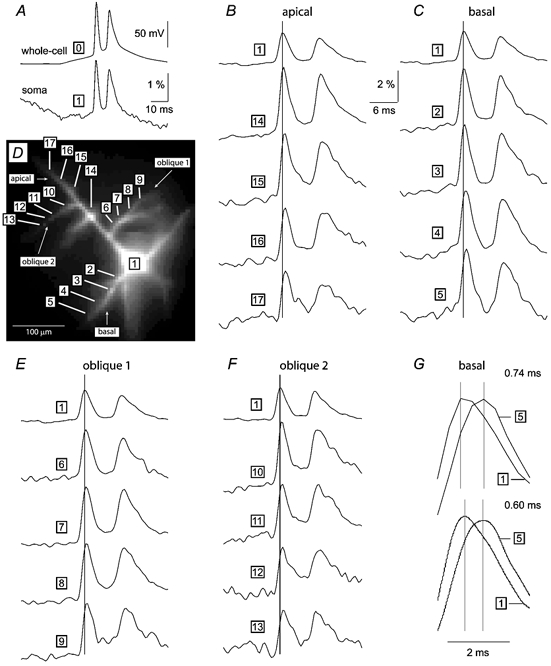
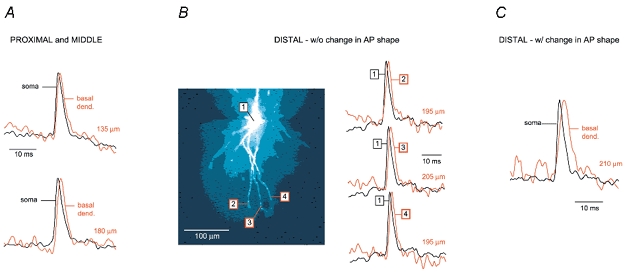
Basal and oblique dendrites comprise ~2/3 of the total excitable membrane in the mammalian cerebral cortex, yet they have never been probed with glass electrodes, and therefore their electrical properties and overall impact on synaptic processing are unknown. In the present study, fast multi-site voltage-sensitive dye imaging combined with somatic recording was used to provide a detailed description of the membrane potential transients in basal and oblique dendrites of pyramidal neurons during single and trains of action potentials (APs). The optical method allowed simultaneous measurements from several dendrites in the visual field up to 200 microm from the soma, thus providing a unique report on how an AP invades the entire dendritic tree. In contrast to apical dendrites, basal and oblique branches: (1) impose very little amplitude and time course modulation on backpropagating APs; (2) are strongly invaded by the somatic spike even when somatic firing rates reach 40 Hz (activity-independent backpropagation); and (3) do not exhibit signs of a 'calcium shoulder' on the falling phase of the AP. A compartmental model incorporating AP peak latencies and half-widths obtained from the apical, oblique and basal dendrites indicates that the specific intracellular resistance (Ri) is less than 100 omicron cm. The combined experimental and modelling results also provide evidence that all synaptic locations along basal and oblique dendrites, situated within 200 microm from the soma, experience strong and near-simultaneous (latency < 1 ms) voltage transients during somatic firing. The cell body, axon hillock and basal dendritic compartments achieve unique synchronization during each AP. Therefore, with respect to a retrograde signal (AP), basal and proximal oblique dendrites should be considered as an integral part of the axo-somatic compartment.


Figures

Figure 9
Figure 9. Frequency-independent AP backpropagation in basal dendrites – two examples
A1, composite high spatial resolution fluorescence image (520 nm) of a pyramidal neuron filled with the voltage-sensitive dye. During the filling procedure a depolarizing current pulse (duration = 700 ms) was injected to produce a burst of APs (trace 0). The loading pipette was then pulled out (outside-out patch) and a glutamate-filled sharp pipette was placed in the position indicated by the schematic drawing. A2, low spatial resolution fluorescence image (80 pixels × 80 pixels) of the area marked by a rectangle in A1, taken with the NeuroCCD camera. A3, glutamate-evoked APs recorded optically from 5 ROI located on the soma-dendrite junction (1), and along primary (2) and secondary (3–5) basal branches. Note that ROI ‘4’ is ∼80 μm beyond the branch point. The timing and duration (20 ms) of the glutamate pulse are indicated below. The experiment was performed at 29 °C bath temperature. B1, frame selected from the sequence of frames captured by the data acquisition camera during the voltage-sensitive dye imaging of glutamate-evoked APs. The apical dendrite is out of focus and oriented down and right. Schematic drawing indicates the relative position of the glutamate-filled stimulation electrode. B2, optical signals from the cell body, and 2 ROI along the basal dendrite (as indicated in B1), 85 and 130 μm from the centre of the soma. B3, same as in B2, except the intensity of the iontophoretic current was adjusted to evoke a 40 Hz somatic firing rate. Note that the amplitude of the optically recorded AP signal is relatively stable throughout the burst. The experiment was performed at 33 °C. Each optical trace in this figure is an averaged output of 16 neighbouring pixels (4 pixels × 4 pixels). There was no temporal averaging.
Figure 7
Figure 7. AP-associated calcium transients in distal tips of basal dendrites
A, microphotograph of a layer V pyramidal neuron filled with Calcium Green-1. B, low spatial resolution fluorescence image (80 pixels × 80 pixels) of the area marked by a circle in A, captured with the data acquisition camera (NeuroCCD). The field diaphragm in the excitation path is partially closed to reduce the exposure of the cell body to strong illumination light. C, a single AP was evoked by direct current injection and simultaneous whole-cell and multi-site optical measurements were performed at 200 Hz frame rate. The whole-cell record (trace 0) is aligned with calcium signals from second- and third-order basal dendrites (1–4). D, the cell body was injected with depolarizing current to produce a train of 5 APs. Each AP in the train is accompanied by a calcium transient at every recording site in the basal dendritic tree, including the most distal recording site ‘3’, located 220 μm from the soma (arrows). The distances between the soma and recording sites 1, 2 and 4 are 165, 205 and 170 μm, respectively. Calcium traces displayed in C and D are products of temporal (4 sweeps) and spatial averaging (9 pixels). This experiment was performed at 34 °C.
Figure 2
Figure 2. Voltage imaging of AP backpropagation
A, microphotograph of a neocortical pyramidal layer V neuron loaded with the fluorescent voltage-sensitive dye JPW3028. The neuron was stimulated by direct current injection to produce a single AP, and subjected to simultaneous whole-cell and multi-site optical measurements (temporal average of 4 trials). B, whole-cell record (trace 0) is aligned with optical signals from the soma (trace 1) and apical dendrite (trace 2 – arrow in A). The thin vertical line marks the peak of the somatic spike. C, optical traces from the soma (grey) and apical dendrite 240 μm from the soma (black) are scaled and superimposed for direct comparison of the timing and shape of the signals. In this and the following figures the upward deflection (positive signal) represents an increase in the fluorescence intensity, and the amplitude is expressed as ΔF/F.
Figure 6
Figure 6. Exploration of the parameter space
A, a multi-compartmental model (Fig. 5B) was used to determine which Ri values are required to match experimentally measured AP peak latency (0.68 ms) 150 μm from the cell body, when dendritic gNa and spine factor were varied. Dendritic gNa was varied within the Mainen-Rhodes range (35–120 pS μm−2). Spine factor was varied between 1.5 and 2. The lower mesh plot was obtained from the slowest dendrite (Fig. 5B, ‘10’). The upper mesh plot was obtained from the fastest dendrite (‘13’). The Ri values required to match experimental data in other basal dendrites (‘1–12’) shown in Fig. 5B, are confined to the space between the two mesh plots. The yellow circle is the maximal Ri value (87 Ω cm), which was obtained when high dendritic gNa (120 pS μm−2) was combined with small spine factor (1.5). B, in order to determine what effects different ratios of dendritic gK and gNa have on the results shown in A, an additional set of simulations was performed using the same model. This panel depicts the 3-D plot of Ri values (that fulfil the experimental constraint) under different combinations of dendritic gNa and gK/gNa ratios. The spine factor was fixed to 1.5. Dendritic gNa was varied within the Mainen-Rhodes range (35–120 pS μm−2), and gK/gNa ratio was varied in the range 0.2–2.0. The lower mesh plot was obtained from the slowest dendrite (Fig. 5B, ‘10’). The upper mesh plot was obtained from the fastest dendrite (‘13’). The Ri values required to match the experimental data in other basal dendrites shown in Fig. 5B are confined to the space between the two mesh plots. The orange circle is the maximal Ri value (95 Ω cm), which was obtained when high dendritic gNa (120 pS μm−2) was combined with high dendritic gK (240 pS μm−2; gK/gNa= 2).
Figure 5
Figure 5. Effects of dendritic sodium channel density (gNa) on the AP peak latency: computer simulation
A, composite microphotograph of a biocytin-labelled layer V pyramidal cell in a 300 μm thick slice harvested from the rat somatosensory cortex (P27) aligned with a Neurolucida reconstruction of the same neuron. B, morphology of the pyramidal neuron after incorporation into NEURON (only basolateral dendritic arbor is shown). Red circles indicate recording sites on 13 basal dendrites. Each recording site is 150 μm from the centre of the soma. The somatic recording site is marked ‘0’. The dendrite with the slowest AP propagation velocity (largest peak latency) is marked ‘10’. The dendrite with the fastest AP propagation velocity is marked ‘13’. C, the model output in response to a square current pulse injection into the cell body. If Ri was set to 100 Ω cm the AP would propagate from the recording site ‘0’ to the recording site ‘13’ with 1.32 ms peak latency (sweep 1). If Ri was set to 43 Ω cm, the peak latency would match the experimental value of 0.68 ms (sweep 2). D, AP peak latencies at 13 recording sites marked by red circles in B are plotted versus dendritic gNa. The gK/gNa ratio was kept at 30/35 (Mainen & Sejnowski, 1996). All 13 curves in the upper part of the graph were generated in the model where Ri was set to 100 Ω cm. The curves generated by the slowest and fastest dendrite are marked ‘10’ and ‘13’, respectively. The horizontal red line marks 0.68 ms, the experimentally measured mean value of AP peak latency in basal dendrites 150 μm from the soma. Note that none of the 13 curves in the upper part of the graph cross the red line, thus models with unusually high densities of dendritic sodium channels (350 pS μm−2) cannot match experimental data if Ri was set to 100 Ω cm. In the lower part of the graph AP peak latencies obtained from the recording site ‘13’ are plotted versus dendritic gNa. In these two simulations Ri was set to 43 and 60 Ω cm in order to match the experimental data. The turquoise area represents the region of popular dendritic gNa values used by computational neuroscientists. The turquoise parameter range begins at 35 pS μm−2 (Mainen & Sejnowski, 1996) and ends at 120 pS μm−2 (Rhodes & Llinas, 2001). P and Q mark the interception of the model output (curves 43 and 60 Ω cm) and experimentally obtained peak latency (red horizontal line), inside the plausible range for dendritic gNa (turquoise area). Note that any model output curve between 43 and 60 Ω cm would intercept the red line inside the turquoise area (between P and Q).
Figure 4
Figure 4. AP peak latencies in apical, oblique and basal dendrites: experimental measurements and computer simulations
AP peak latencies along apical (A), oblique (C) and basal (E) dendrites are plotted versus the distance from the centre of the soma. Red lines represent the least squares fit of data points. The dashed line in A is a linear regression fit of peak latencies obtained with dual patch electrode measurements (Stuart & Sakmann, 1994). Insets in C and E are microphotographs of a representative neuron filled with JPW3028, taken immediately after the optical imaging. AP peak latencies obtained in computer simulations of apical (B), oblique (D) and basal (F) dendrites are plotted versus the distance from the centre of the soma. Each simulation was carried out using 3 characteristic values of Ri (70, 150 and 210 Ω cm). Red lines are copied from corresponding panels on the left. Insets in D and F depict the morphology of the proximal dendritic tree of the model neuron (Stuart & Spruston, 1998). Arrows mark particular dendritic segments for which plots were made.
Figure 1
Figure 1. Effect of Ri on AP peak latency in basal dendrites: computer simulations
A, reconstructed layer V pyramidal neuron used for the model (provided by N. Spruston). B, AP waveforms in the soma (black trace) and distal basal compartment 150 μm from the soma (red trace), as indicated with arrows in A. The AP peak latency (in ms) is shown above the trace. Global Ri= 70 Ω cm, dendritic gNa= 35 pS μm−2, gK= 30 pS μm−2, gCa= 0.3 pS μm−2. C, same as in B, except Ri= 210 Ω cm. D, same as in B, except Ri= 210 Ω cm and dendritic gNa= 210 pS μm−2. E, plot of AP peak latency in a distal basal dendrite 150 μm from the soma versus dendritic gNa. Peak latencies were plotted for two Ri values (70 and 210 Ω cm). Points on the graph marked as B, C and D correspond to model parameters used in simulation trials displayed in B, C and D, respectively. An additional set of simulations was carried out to test how different values of specific membrane resistance (Rm), when applied uniformly, affect AP propagation. The results suggest that varying Rm in the range 10–50 kΩ cm2 has minimal effects (approximately ±0.1 ms) on AP peak latency in basal dendrites (data not shown).
Figure 3
Figure 3. Simultaneous multi-site optical imaging of membrane potential transients from basal, oblique and apical dendrites
A layer V pyramidal neuron (D) was loaded with fluorescent voltage-sensitive dye, and injected with a current pulse to produce 2 APs. A, the somatic whole-cell record (trace 0) is aligned with the somatic optical signal (trace 1) to show the agreement in respect to timing, time course and relative amplitude of 2 spikes. B, C, E and F each consist of the somatic optical signal (trace 1) aligned with 4 optical signals recorded along apical (A), basal (C) and 2 oblique dendrites (E and F), as indicated by numbers on the microphotograph shown in D. Optical signals are products of: (1) spike-triggered temporal averaging (4 trials); (2) spatial averaging (n = 6–9 neighbouring pixels); and (3) digital filtering (Gaussian low-pass 0.5 kHz). The vertical line marks the peak of the first somatic spike. G, upper, AP-associated optical signal in the basal dendrite 145 μm from the soma (trace 5) is scaled and superimposed on the somatic optical signal (trace 1), to show the propagation latency on a faster time scale. Lower, same two traces as above, but interpolated with sinc function. The corresponding interspike interval, measured as the time difference between two samples of maximum amplitude (marked by vertical lines), is displayed above each trace pair. For multiple-frame and movie presentation of these experimental data see ‘Supplementary material’.
Figure 8
Figure 8. The shape of APs in distal segments of basal dendrites: voltage imaging
A, 2 examples of voltage imaging performed at proximal and middle recording sites on basal dendrites (less than 180 μm from the cell body). Upper, AP-associated optical signal from basal dendrite (red, 135 μm from the soma) superimposed on the somatic optical record (black). Lower, same as above but different cell and different recording distance from the centre of the soma (180 μm). B, left, composite microphotograph of a layer V pyramidal neuron filled with JPW3028. Right, 3 examples of optical signals sampled from distal dendritic segments at distances larger than 180 μm, as indicated in the left panel. There is no apparent broadening of the backpropagating AP. Note that ROI ‘3’ is ∼150 μm beyond the branch point. C, example of an experiment in which the half-width of the AP increases in distal dendritic segments. Each trace in Fig. 8 is the product of temporal (4 sweeps) and spatial averaging (6–9 pixels). All somatic signals are coloured black and dendritic recordings are coloured red. The distance from the centre of the soma is indicated above each dendritic recording.

References

    1. Anderson JC, Binzegger T, Kahana O, Martin KA, Segev I. Dendritic asymmetry cannot account for directional responses of neurons in visual cortex. Nat Neurosci. 1999;2:820–824. - PubMed
    1. Antic S, Major G, Zecevic D. Fast optical recordings of membrane potential changes from dendrites of pyramidal neurons. J Neurophysiol. 1999;82:1615–1621. - PubMed
    1. Archie KA, Mel BW. A model for intradendritic computation of binocular disparity. Nat Neurosci. 2000;3:54–63. - PubMed
    1. Baer SM, Rinzel J. Propagation of dendritic spikes mediated by excitable spines: a continuum theory. J Neurophysiol. 1991;65:874–890. - PubMed
    1. Barrett J, Crill W. Specific membrane properties of cat motoneurones. J Physiol. 1974;239:301–324. - PMC - PubMed

Publication types

LinkOut - more resources