. 2003 May 12;161(3):521-33.
doi: 10.1083/jcb.200302072. Epub 2003 May 5.

Proprotein convertase cleavage liberates a fibrillogenic fragment of a resident glycoprotein to initiate melanosome biogenesis

Affiliations

Proprotein convertase cleavage liberates a fibrillogenic fragment of a resident glycoprotein to initiate melanosome biogenesis

Joanne F Berson et al. J Cell Biol. .

Abstract

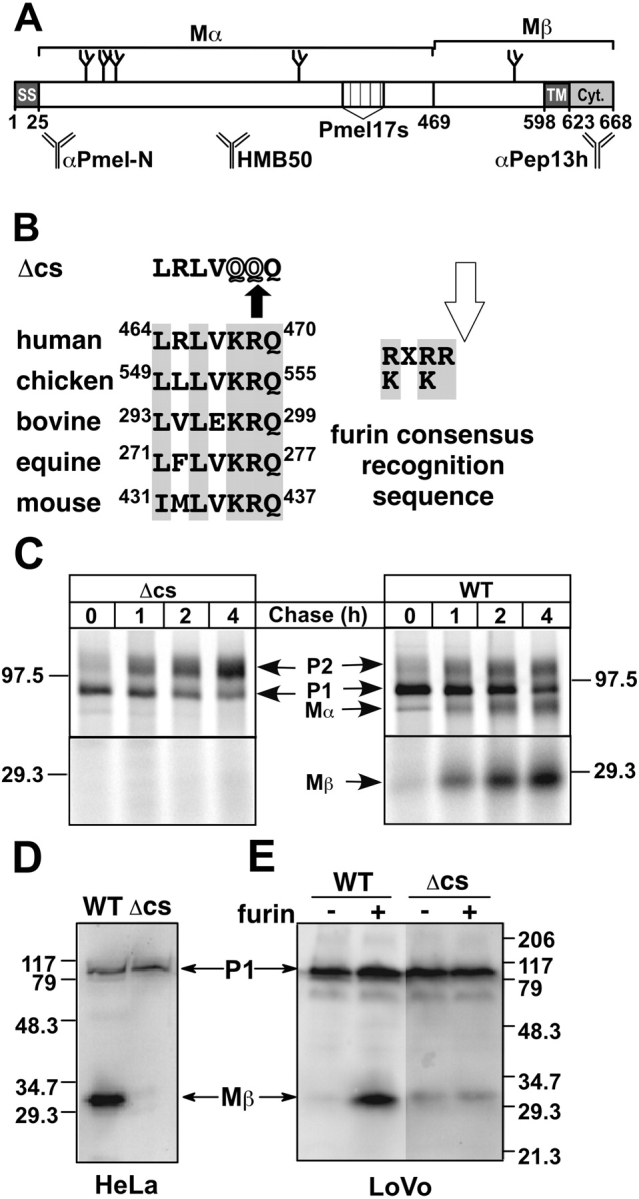
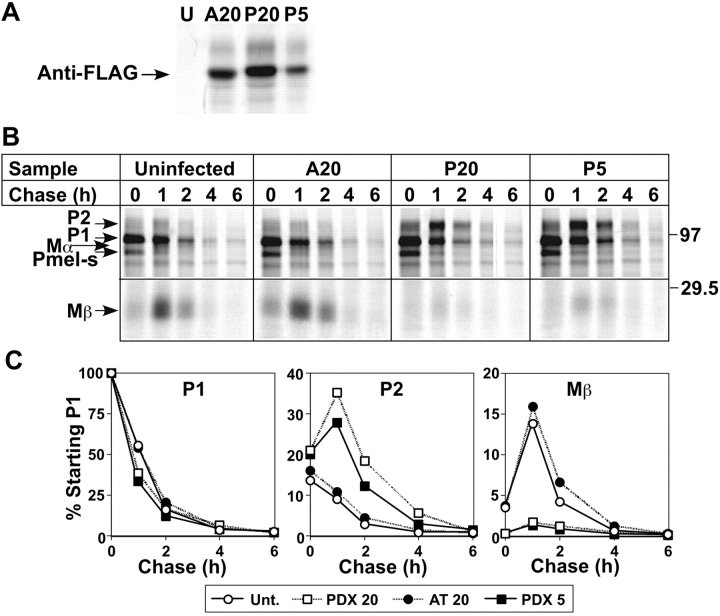
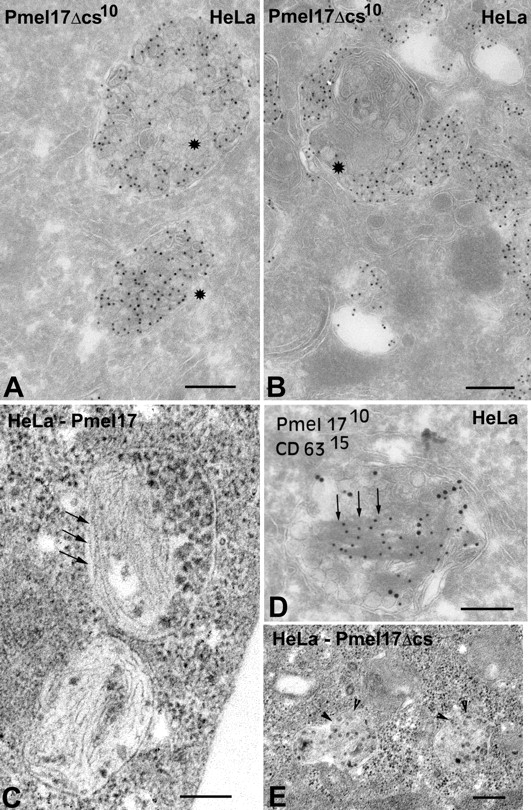
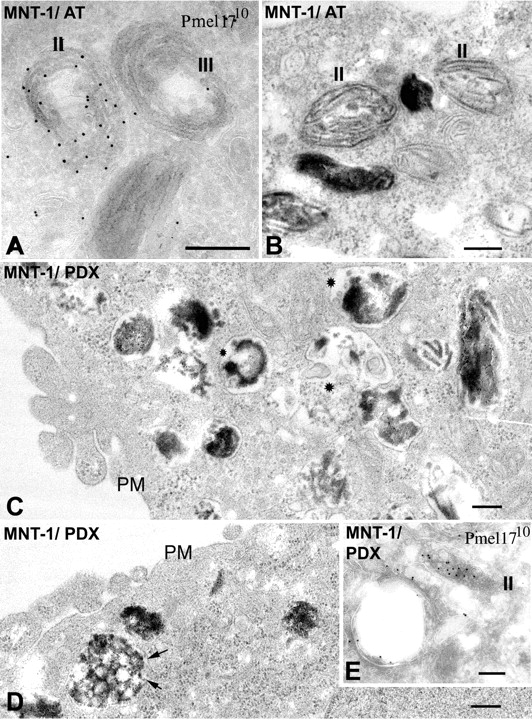
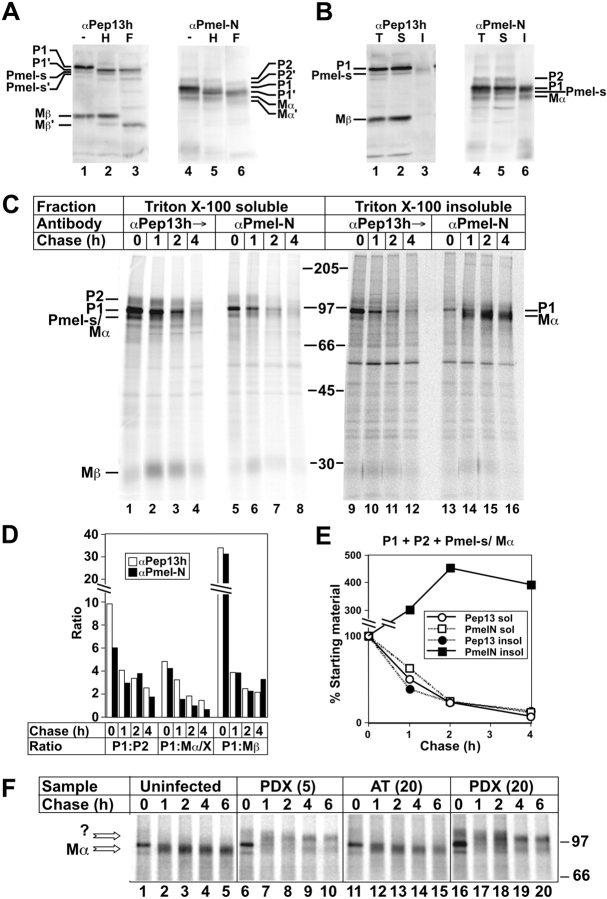
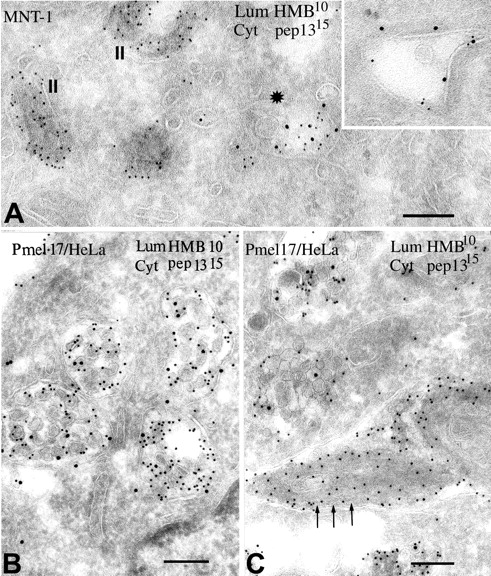
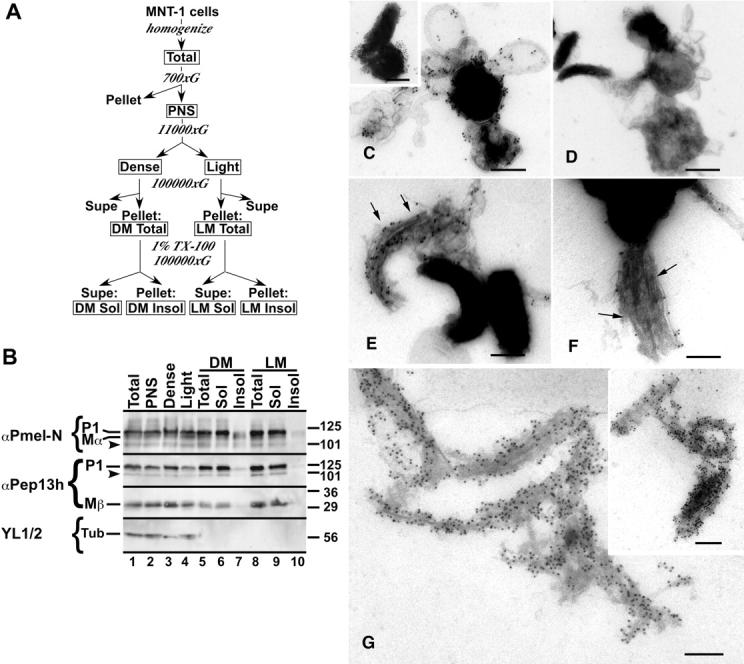
Lysosome-related organelles are cell type-specific intracellular compartments with distinct morphologies and functions. The molecular mechanisms governing the formation of their unique structural features are not known. Melanosomes and their precursors are lysosome-related organelles that are characterized morphologically by intralumenal fibrous striations upon which melanins are polymerized. The integral membrane protein Pmel17 is a component of the fibrils and can nucleate their formation in the absence of other pigment cell-specific proteins. Here, we show that formation of intralumenal fibrils requires cleavage of Pmel17 by a furin-like proprotein convertase (PC). As in the generation of amyloid, proper cleavage of Pmel17 liberates a lumenal domain fragment that becomes incorporated into the fibrils; longer Pmel17 fragments generated in the absence of PC activity are unable to form organized fibrils. Our results demonstrate that PC-dependent cleavage regulates melanosome biogenesis by controlling the fibrillogenic activity of a resident protein. Like the pathologic process of amyloidogenesis, the formation of other tissue-specific organelle structures may be similarly dependent on proteolytic activation of physiological fibrillogenic substrates.


Figures

Figure 1.
Figure 1.
Identification of a conserved PC cleavage site in Pmel17. (A) Schematic diagram of the primary structure of Pmel17 drawn to scale. Numbers correspond to amino acid positions; positions of the signal sequence (SS), transmembrane (TM), and cytoplasmic (Cyt.) domains, aa 469, and a lumenal region deleted in the alternative spliced form, Pmel17-s, are indicated; N-linked glycans are represented by branched structures; regions corresponding to Mα and Mβ are shown above; and regions recognized by antibodies αPmel-N, HMB50, and αPep13h are shown below. (B) Sequence of the conserved dibasic consensus site from orthologues human Pmel17 (GenBank/EMBL/DDBJ accession no. NP_008859), chicken MMP115 (GenBank/EMBL/DDBJ accession no. Q98917), bovine RPE1 (GenBank/EMBL/DDBJ accession no. Q06154), equine Pmel17 (GenBank/EMBL/DDBJ accession no. AAC97108), and mouse Silver (GenBank/EMBL/DDBJ accession no. NP_068682). Amino acid positions are noted (equine and bovine sequences are from incomplete clones); conserved residues are in gray. Top, Pmel17Δcs (Δcs) sequence. Right, consensus recognition sequence for furin; cleavage site is indicated by arrow. (C) Cleavage is inhibited by mutagenesis of the dibasic site. Transiently transfected HeLa cells expressing wild-type Pmel17 (WT) or Pmel17Δcs (Δcs) were metabolically pulse labeled and chased as indicated. TX cell lysates at each time point were immunoprecipitated with αPEP13h, fractionated by SDS-PAGE, and analyzed by phosphorimaging. Shown are regions of the gels encompassing the relevant bands; the signal from the lower region was enhanced fourfold to emphasize the failure to detect Mβ from Pmel17Δcs. Migration of molecular weight markers and P1, P2, Mα, and Mβ forms of Pmel17 are indicated. (D and E) Western blot analysis of wild-type Pmel17 (WT) and Pmel17Δcs (Δcs) expressed transiently by transfection in (D) HeLa or (E) LoVo cells. In E, LoVo cells were cotransfected (+) or not (−) with a plasmid encoding rat furin. Whole-cell lysates from transfected cells were fractionated by SDS-PAGE, transferred to PVDF membranes, and probed using αPEP13h with enhanced chemifluorescence. Positions of molecular weight markers and P1 and Mβ forms of Pmel17 are indicated.
Figure 2.
Figure 2.
PCs mediate Pmel17 cleavage in melanocytic cells. MNT-1 cells were uninfected (U) or infected with recombinant adenoviruses encoding tTA (moi of 20) and either FLAG-tagged α1-AT (moi of 20; A20) or α1-PDX at moi of 20 (P20) or 5 (P5). Two days after infection, cells were metabolically pulse labeled and chased for the indicated periods of time. Immunoprecipitates from TX cell lysates at indicated time points were fractionated by SDS-PAGE and analyzed by phosphorimaging. (A) Epitope-tagged α1-AT and α1-PDX immunoprecipitated from pulse-labeled cell lysates using an anti-FLAG antibody. Similar levels of transgene expression were obtained using α1-PDX at moi of 5 and α1-AT at moi of 20. (B) Pmel17 immunoprecipitated using αPEP13h. Only the relevant portion of the gels are shown; no other specific bands were consistently observed. The intensity of the lower part of the gel was amplified 2× to emphasize the Mβ band. Positions of molecular weight markers (right) and of P1, Pmel17-s, P2, Mα, and Mβ (left) are noted. Pmel17-s is the product of an alternatively spliced Pmel17 mRNA. (C) Quantitation of the signal intensity of P1, P2, and Mβ from B. Data represent the percentage of signal from each band relative to the values for P1 at 0 chase for each group (average from three experiments). Note that the predicted cysteine and methionine content of Mβ represents 42% of that present in full-length Pmel17.
Figure 3.
Figure 3.
Cleavage site–deficient Pmel17 localizes to MVBs, but fails to form fibers. Transiently transfected HeLa cells expressing Pmel17Δcs (A, B, and E) or wild-type Pmel17 (C and D) were analyzed by either IEM (A, B, and D) or standard EM (C and E). (A, B, and D) Ultrathin cryosections were immunogold labeled with HMB50 and PAG-10; in D, sections were double labeled with anti-CD63 and PAG-15. (A) A typical Pmel17Δcs-expressing cell showing predominant labeling on ILVs of multivesicular late endosomes. (B) A cell with very high Pmel17Δcs expression; note the gold labeling over electron-dense aggregates in compartments with multiple layers of membranes (stars). (D) A cell with high wild-type Pmel17 expression; note the gold labeling over ILVs and fibrous structures within MVBs (arrows), and exclusion of CD63 labeling from the striated regions. (C) Standard EM of a cell expressing wild-type Pmel17. Note the fibers within MVBs (arrows). (E) Standard EM of a cell expressing Pmel17Δcs. Note the accumulation of electron-dense material in MVBs, but no obvious fibers (arrowheads). Bars, 200 nm.
Figure 4.
Figure 4.
Disruption of melanosome morphology in MNT-1 cells expressing α1-PDX. MNT-1 cells infected with recombinant adenoviruses expressing tTA and either α1-AT (A and B) or α1-PDX (C–E) were analyzed by either IEM (A and E) or standard EM (B–D). (A and E) Ultrathin cryosections were immunogold labeled with HMB50 and PAG-10. (A and B) Note the characteristic striations of stage II and III premelanosomes (II and III) in cells expressing α1-AT. By IEM, these structures are densely labeled for Pmel17. (C and D) Note the absence of normal stage II and III premelanosomes in cells expressing α1-PDX, and the appearance of unusual melanin aggregates in disordered arrays (C, stars) and multivesicular structures (D, arrows). (E) By IEM, Pmel17 is detected normally in endosomes with a planar clathrin coat (bottom left), but dense labeling is limited to abnormal, nonstriated, multivesicular structures with the shape of stage II premelanosomes (II). PM, plasma membrane. Bars, 200 nm.
Figure 5.
Figure 5.
Mα accumulation in TX- insoluble fractions of MNT-1 cells and inhibition by α1-PDX. (A and B) Western blot analyses of MNT-1 cell fractions. Lysates fractionated by SDS-PAGE were probed with antibodies αPep13h (to COOH terminus) or αPmel-N (to NH2 terminus). (A) Whole-cell lysates were untreated or treated with endoH (H) or N-glycanase F (F). (B) Whole-cell lysates (T) and TX-soluble (S) or -insoluble (I) material were analyzed directly. Relevant bands are indicated; bands annotated with ′ are glycosidase cleavage products. (C–F) Pulse-chase/immunoprecipitation analyses of Mα formation in MNT-1 cells. Metabolically pulse-labeled and chased MNT-1 cells were extracted with TX, and TX-insoluble pellets were re-extracted in lysis buffer containing 8M urea at 60°C. TX-soluble and -insoluble/urea extracted fractions (after dilution of the urea) were sequentially immunoprecipitated first with normal rabbit serum, then with αPEP13h, and finally with αPmel-N. Immunoprecipitates were fractionated by SDS-PAGE and analyzed by phosphorimaging. Chase times (h) are indicated at top (C and F) or bottom (D and E); migration of molecular weight markers and relevant bands are indicated to the side. (C) αPep13h and αPmel-N immunoprecipitates from both fractions are shown. Panels on the right were exposed 22× longer than those on the left because of vastly reduced efficiency of immunoprecipitation after treatment of lysates with urea (unpublished data). Note the appearance of Mα in αPmel-N immunoprecipitates at later time points. (D) The intensity of indicated bands in each lane from the soluble fraction of C was quantitated by phosphorimaging, and ratios of the intensities of P1 to P2, Pmel17-s/Mα (Mα/X), and Mβ at each time point, precipitated by either αPep13h or αPmel-N, were calculated and plotted; the Pmel17-s and Mα bands were summed because they could not be easily resolved. Note that for each time point, ratios were similar for both antibodies. (E) Intensities of P1, P2, Pmel17-s, and Mα bands were summed at each time point for both antibodies in both soluble (sol) and insoluble (insol) fractions, and plotted as a percentage of the value at time 0. Note the loss of material from all fraction/antibody combinations except the insoluble fraction precipitated with αPmel-N, in which intensity increased over time. (F) Cells were uninfected or infected with recombinant adenoviruses expressing α1-PDX at moi of 5, PDX(5); or 20, PDX(20); or α1-AT at moi of 20, AT(20), before the experiment; shown are only the relevant regions of the αPmel-N immunoprecipitates from the TX insoluble fraction. Arrows, bands that co-migrate with Mα or a novel product (?) precipitated only from cells expressing α1-PDX.
Figure 6.
Figure 6.
Failure to detect Pmel17 COOH terminus in striated regions of premelanosomes and MVBs. Ultrathin cryosections of (A) MNT-1 or (B and C) transiently transfected HeLa cells expressing wild-type Pmel17 were double immunogold–labeled with HMB50 and PAG-10 and with αPep13h and PAG-15. (A) A section of MNT-1 cells showing labeling by both antibodies on multivesicular coated endosomes (asterisk and inset), but only by HMB50 on stage II premelanosomes (II). Note the intralumenal labeling by αPep13h in the marked coated endosome (asterisk). (B) A typical section of transfected HeLa cells containing abundant multivesicular compartments. Note the labeling with both antibodies, with HMB50 labeling on the lumenal face and αPEP13h labeling primarily on the interior of the vesicles. (C) A section from a transfected HeLa cell demonstrating nascent striations. Note the absence of αPEP13h labeling in the striated regions (arrows) and on closely apposed membranes (arrows). Bars, 200 nm.
Figure 7.
Figure 7.
Cofractionation of TX-insoluble Mα and premelanosome fibers. (A) Scheme for fractionation of post-nuclear supernatants (PNS) from homogenates of MNT-1 cells. Boxed fractions were analyzed by Western blotting in B. (B) Equal cell equivalents from each fraction were analyzed by SDS-PAGE and Western blotting with αPmel-N, αPep13h, or the anti-tubulin antibody YL 1/2, as indicated. Shown are the relevant portions of each gel; positions of molecular weight markers (right) and relevant proteins (left) are indicated. Note the enrichment of only Mα in the TX-insoluble pool of the DM fraction (lane 7). (C–G) IEM analyses of relevant fractions using HMB45 (to Pmel17 lumenal domain) or TA99 (to Tyrp1) and PAG-10. (C and D) Nonsolubilized membranes from the dense fraction (lane 5 in B) labeled with TA99 (C) or HMB45 (D). Note the labeling for Tyrp1 on the limiting membrane of highly pigmented structures (particularly in inset), and the absence of HMB45 labeling on these nonpermeabilized, whole-mounted fractions. (E–G) TX-insoluble membranes from the dense fraction (lane 7 in B) labeled with HMB45 (E and G) or TA99 (F). Note the dense labeling of fibrous structures (arrows), including relatively intact contents of a stage II premelanosome (G, inset), by HMB45. TA99 only sparsely labels residual limiting membranes (F, arrows). Bars, 200 nm.

Comment in

  • Amyloid as a natural product.
    Kelly JW, Balch WE. Kelly JW, et al. J Cell Biol. 2003 May 12;161(3):461-2. doi: 10.1083/jcb.200304074. J Cell Biol. 2003. PMID: 12743097 Free PMC article. Review.

References

    1. Adema, G.J., A.J. de Boer, A.M. Vogel, W.A.M. Loenen, and C.G. Figdor. 1994. Molecular characterization of the melanocyte lineage-specific antigen gp100. J. Biol. Chem. 269:20126–20133. - PubMed
    1. Anderson, E.D., L. Thomas, J.S. Hayflick, and G. Thomas. 1993. Inhibition of HIV-1 gp160-dependent membrane fusion by a furin-directed α1-antitrypsin variant. J. Biol. Chem. 268:24887–24891. - PubMed
    1. Arvan, P., and D. Castle. 1998. Sorting and storage during secretory granule biogenesis: looking backward and looking forward. Biochem. J. 332:593–610. - PMC - PubMed
    1. Badman, M.K., K.I. Shennan, J.L. Jermany, K. Docherty, and A. Clark. 1996. Processing of pro-islet amyloid polypeptide (proIAPP) by the prohormone convertase PC2. FEBS Lett. 378:227–231. - PubMed
    1. Berson, J.F., D.W. Frank, P.A. Calvo, B.M. Bieler, and M.S. Marks. 2000. A common temperature-sensitive allelic form of human tyrosinase is retained in the endoplasmic reticulum at the nonpermissive temperature. J. Biol. Chem. 275:12281–12289. - PubMed

Publication types

MeSH terms