. 2003 May 12;161(3):535-45.
doi: 10.1083/jcb.200301105. Epub 2003 May 5.

A novel human protein of the maternal centriole is required for the final stages of cytokinesis and entry into S phase

Affiliations

A novel human protein of the maternal centriole is required for the final stages of cytokinesis and entry into S phase

Adam Gromley et al. J Cell Biol. .

Abstract

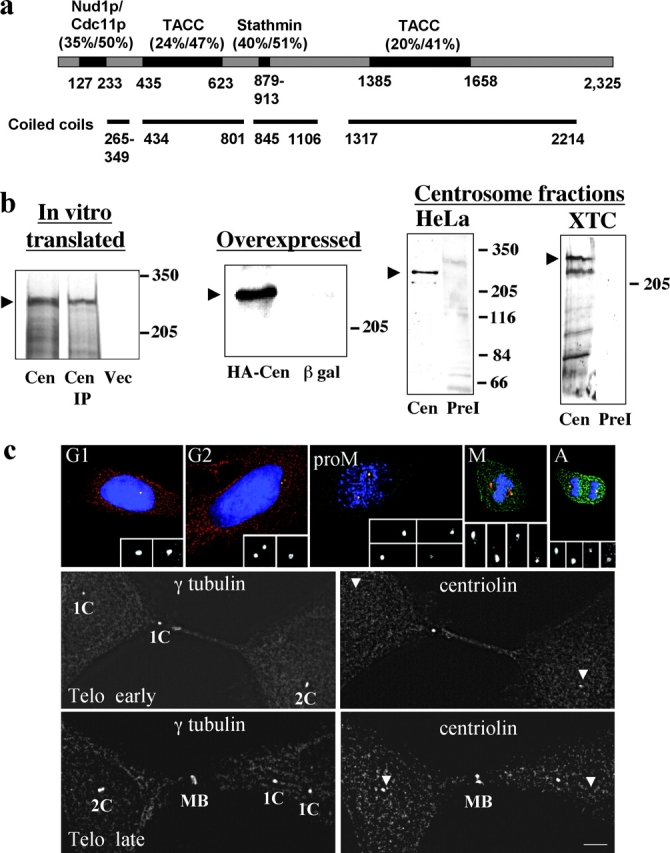
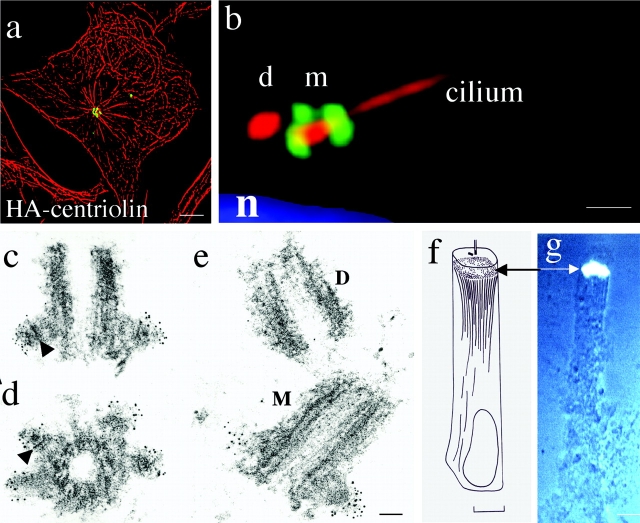
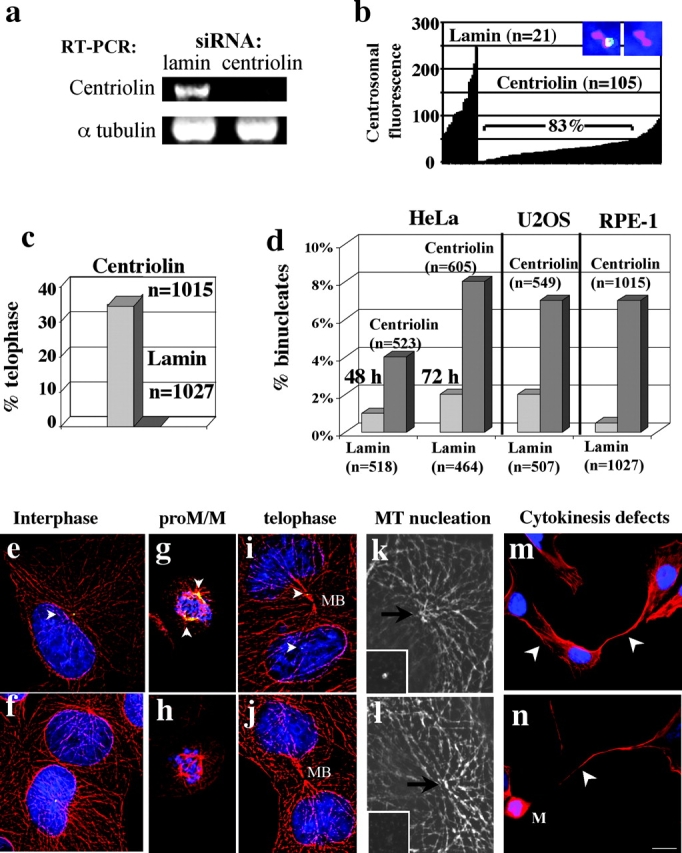
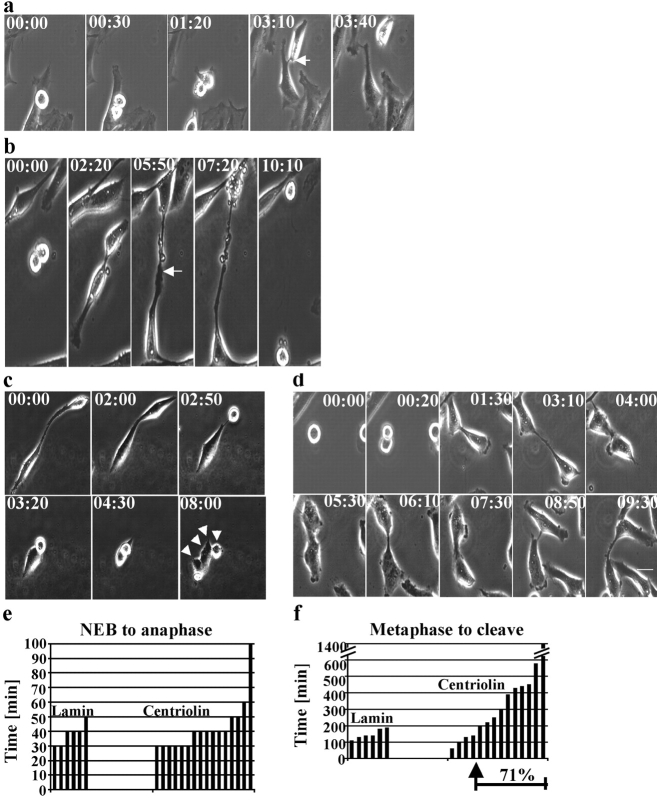
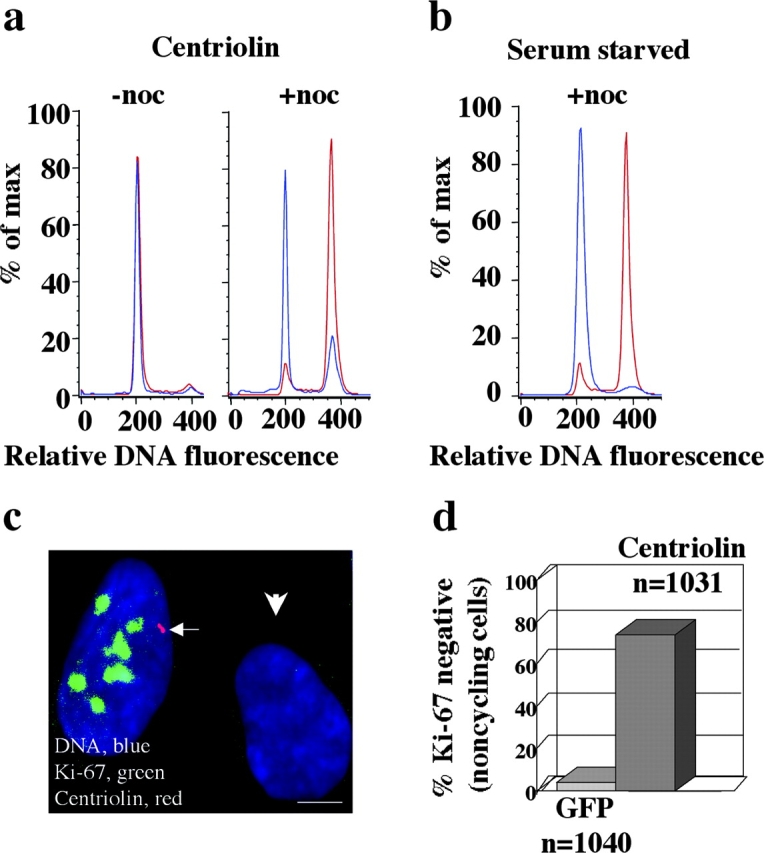
Centrosomes nucleate microtubules and contribute to mitotic spindle organization and function. They also participate in cytokinesis and cell cycle progression in ways that are poorly understood. Here we describe a novel human protein called centriolin that localizes to the maternal centriole and functions in both cytokinesis and cell cycle progression. Centriolin silencing induces cytokinesis failure by a novel mechanism whereby cells remain interconnected by long intercellular bridges. Most cells continue to cycle, reenter mitosis, and form multicellular syncytia. Some ultimately divide or undergo apoptosis specifically during the protracted period of cytokinesis. At later times, viable cells arrest in G1/G0. The cytokinesis activity is localized to a centriolin domain that shares homology with Nud1p and Cdc11p, budding and fission yeast proteins that anchor regulatory pathways involved in progression through the late stages of mitosis. The Nud1p-like domain of centriolin binds Bub2p, another component of the budding yeast pathway. We conclude that centriolin is required for a late stage of vertebrate cytokinesis, perhaps the final cell cleavage event, and plays a role in progression into S phase.


Figures

Figure 1.
Figure 1.
Centriolin is an270-kD coiled-coil protein localized to mature centrosomes and the midbody. (a, top) Schematic showing centriolin domains that share homology with budding and fission yeast proteins Nud1p and Cdc11p, human stathmin, and human and Drosophila TACCs. Percentages represent identities and similarities of centriolin to the homologous proteins described above. (a, bottom) Schematic showing centriolin regions predicted to be coiled coil. Below both diagrams are centriolin amino acid numbers. (b, In vitro translated) [35S]methionine-labeled HA-tagged centriolin produced by in vitro translation of cDNA and resolved directly (Cen) or after immunoprecipitation with HA antibodies (Cen IP); empty vector (Vec). (b, Overexpressed) Western blots probed with anti-HA antibody showing overexpressed HA-tagged centriolin (HA-Cen) and its absence from cells overexpressing β-galactosidase (β gal). (b, Centrosome fractions) Centrosome fractions prepared from HeLa cells and Xenopus tissue culture (XTC) cells blotted with antibodies to centriolin (Cen) or preimmune sera (PreI). Arrowheads show position of centriolin. In XTC cells, the bands below centriolin appear to be degradation products as they are sometimes observed in protein fractions produced by in vitro translation or overexpression. Bars represent positions of molecular weight markers (×103). (c) Immunofluorescence images of endogenous centriolin in RPE-1 cells at different cell cycle stages. The top panels show merged images of centriolin (green), γ-tubulin (red), and nuclei (blue) from cells in G1, G2, proM (prometaphase), M (metaphase), and anaphase (A). Insets, higher magnifications of centrosomes stained for γ-tubulin (left) and centriolin (right). Centriolin localization to one of the two centrosomes is demonstrated most clearly in the G2 cell. Middle panels (Telo early) and bottom panels (Telo late) show separate images of γ-tubulin staining (left) and centriolin (right). γ-Tubulin marks both mother and daughter centrioles, which are separated in some cases. Centriolin staining is confined to one of two centrioles, which sometimes appears at the intercellular bridge (Telo early). Centrioles lacking centriolin are indicated by arrowheads in right panels. At later stages of telophase (Telo late), centriolin is also on the midbody. All immunofluorescence images (here and elsewhere) are two-dimensional projections of three-dimensional reconstructions to ensure that all stained material is visible. C, centriole; MB, midbody. Bar in c, 10 μm; but 3 μm for insets.
Figure 2.
Figure 2.
Centriolin is localized to maternal centrioles and noncentrosomal sites of microtubule anchoring. (a) HA-tagged centriolin overexpressed in COS-7 cells localizes to the centrosome (anti-HA, green) at the convergence of microtubules (red, anti–α-tubulin). (b) An RPE-1 cell immunostained with an antibody to polyglutamylated tubulin (GT335) (Bobinnec et al., 1998) to label centrioles and the primary cilium (red), and for centriolin (green), which is localized to the maternal centriole (m) associated with the primary cilium (yellow in merge) but not on the daughter centriole (d). n, nucleus. (c–e) Electron micrographs showing specific immunogold labeling of centriolin on subdistal appendages found on maternal (e, bottom, M) but not daughter centrioles (e, top, D). c and d are longitudinal and cross sections, respectively, through maternal centrioles, and e is a longitudinal section through both centrioles. Arrowheads show striations characteristic of subdistal appendages. (f and g) Centriolin is found at noncentrosomal sites of microtubule anchoring in pillar cells of the mouse cochlea (arrows) (Mogensen et al., 1997). (f) Schematic representation of a pillar cell. (g) Centriolin immunofluorescence staining overlaid with phase contrast image. Centrosome and associated cilium are shown schematically at top of cell in f. Bars: (a and g) 10 μm; (b) 2 μm; (c–e) 100 nm.
Figure 3.
Figure 3.
RPE-1 cells treated with siRNAs targeting centriolin retain persistent intercellular connections and fail in cytokinesis. (a) RT-PCR analysis shows that centriolin mRNA is reduced in RPE-1 cells treated with centriolin-specific siRNAs (top right) but is unaffected in cells treated with siRNAs targeting lamins A/C (top left, sequence identity confirmed). Control (α-tubulin) RT-PCR was performed in the same reaction mixtures with centriolin and lamin (bottom panels). (b) Immunofluorescence images (top right; γ-tubulin, red; centriolin, green) and quantification of centriolin levels in centrosomes from cells treated with siRNAs as indicated. The top right panel shows a cell with undetectable centriolin at the centrosome/centriole, and the top left panel shows a cell that is unaffected by the treatment and stains for centriolin (green/white). Graph shows the average centriolin fluorescence intensity/pixel at individual centrosomes (bars) in cells treated with lamin or centriolin siRNAs. The centrosome fluorescence in most centriolin siRNA–treated cells (83%) was below the lowest values observed in control cells. (c) Graph showing a dramatic increase in the percentage of cells in telophase/cytokinesis after siRNA targeting of centriolin (∼70-fold). n, total number of cells counted (c and d). (d) Graph showing the increased percentage of binucleate cells in HeLa, U2OS, and RPE-1 cell lines after treatment with centriolin siRNAs (4–15-fold greater than controls). In c and d, values represent data from single experiments representative of three to four experiments. The time analyzed was as follows: HeLa, 48 h and 72 h; U2OS, 72 h; RPE-1, 24 h. (e–l) Microtubule organization (e–j) and microtubule nucleation (k and l) are not detectably altered in cells treated with centriolin siRNA (f, h, j, and l) compared with cells treated with lamin siRNA (e, g, i, and k). Arrows indicate position of centrosomes; no centrosome staining is observed in centriolin siRNA–treated cells. Insets in k and l are enlargements of centriolin staining at centrosomes (or microtubule convergence sites) at arrows. Cells in interphase (e and f, lower cell), prometaphase/metaphase (proM/M; g and h), and telophase (i and j) were labeled for microtubules (red), centrosomes (green/yellow), and nuclei (blue). MB, midbody. (m and n) Cells treated with siRNAs targeting centriolin were stained for microtubules (red) and DNA (blue). Arrowheads indicate contiguous connections between two or more cells. (m) Three interconnected cells form a syncytium. (n) One daughter of an interconnected pair of cells has reentered mitosis (M). Bar in n: (e–j) 5 μm; (k, l, and insets) 3.5 μm; (m and n) 15 μm.
Figure 4.
Figure 4.
Time-lapse images of HeLa cells treated with centriolin siRNAs reveal unique cytokinesis defects. (a) A cell treated with control siRNAs targeting lamin moves apart, forms visible midbodies (arrow), and completes the final cleavage event with normal timing (1–3 h after metaphase). (b–d) Centriolin siRNA–treated cells remain attached for extended periods of time through persistent intercellular bridges and sometimes do not show visible midbodies. (b) A cell that remains attached by a long intercellular bridge for at least 8 h. The cell cleaves, both daughter cells round up, and at least one appears to undergo apoptotic cell death (upper cell, 7:20, extensive blebbing and decrease in size). (c) A dividing cell that has not completed cleavage reenters the next mitosis. One cell rounds up and is drawn to the other. The other rounds up and both undergo the early stages of cytokinesis to form a total of four cells; these progeny often remain attached by intercellular bridges forming syncytia. (d) Cell showing three failed attempts at cell cleavage over a 9.5-h time period. (e) Cells treated with siRNAs targeting centriolin progress from nuclear envelope breakdown (NEB) to anaphase with normal timing, similar to lamin siRNA controls. Vertical bars represent recordings from single cells (e and f). (f) Centriolin siRNA–treated cells are delayed in cytokinesis (∼70%) compared with control lamin siRNA–treated cells, a value consistent with a 70–80% silencing efficiency. Results represent recordings of individual cells from several independent experiments. Time in hours and minutes is included in each panel in a–d. Bar, 10 μm. Time-lapse videos (Videos 1–3) of the series of images shown in a–c are available at http://www.jcb.org/cgi/content/full/jcb.200301105/DC1.
Figure 5.
Figure 5.
Cells expressing centriolin fail in cytokinesis, as do cells expressing the centriolin Nud1 domain that interacts with yeast Bub2p. (a) COS-7 cell overexpressing HA-tagged centriolin (left inset) showing persistent microtubule bundles in the intercellular bridge during cytokinesis (main panel, α-tubulin staining) despite reformation of the nucleus and decondensation of chromatin (DNA, right inset). (b) Control COS-7 cell (expressing HA alone, bottom center) at a similar cell cycle stage based on nuclear morphology (bottom right) shows a narrow intercellular bridge and diminished microtubule polymer (center), characteristic of cells that have reformed nuclei and decondensed DNA. (c–f) COS-7 cells expressing a GFP-tagged Nud1 domain of centriolin (c and d, insets, green; DNA, blue) have normal intercellular bridges (d, telophase, arrowhead) and normal microtubule organization (c, interphase) as in controls. However, the cells (yellow) often become binucleate (blue) by a mechanism that does not involve disruption of the endogenous centrosome-associated centriolin (f; right inset shows enlargement of centrosome, left inset shows transfected cell). (g) Quantitative analysis showing that HA–centriolin and the GFP-tagged Nud1 domain both induce significant binucleate cell formation compared with controls (HA and GFP). Values are from a single experiment and are representative of three experiments. Bar, 7 μm (for all panels). n, total number of cells counted. (h) Alignment of the centriolin Nud1 domain with the yeast Nud1p and Cdc11p proteins. (i) Direct yeast two-hybrid analysis demonstrates an interaction between the human Nud1 domain with one of the two components implicated in GTPase- activating protein activity, Bub2p, but not Bfa1p. The blue colony in the blue box and increased β-galactosidase activity (bar 2 of graph) demonstrate a specific interaction between the human centriolin Nud1 domain (hNud1) and yeast Bub2p. Bar 1, LexA–BUB2 × TAD; bar 2, LexA–BUB × TAD–hNud1; bar 3, LexA–BFA1 × TAD; bar 4, TAD–hNud1 × LexA–BFA1; bar 5, TAD-hNud1 × LexA. (j) Specific coimmunoprecipitation of HA-tagged hNud1 and LexA-tagged yeast Bub2p from yeast cells. Coprecipitation was observed using antibodies to either protein and only when both were coexpressed (top middle panel in each group). Lane 1, TAD–HA–hNud1 × LexA; lane 2, TAD–HA–hNud1 × Bub2p–LexA; lane 3, TAD–HA × Bub2p–LexA.
Figure 6.
Figure 6.
Cytokinesis failure in Xenopus embryos injected with centriolin antibodies. (a) Xenopus two-cell embryos injected into one cell with ∼50 nl anticentriolin antibodies (2 mg/ml affinity purified) fail to cleave (arrows), whereas noninjected cells (side opposite arrows) and cells injected with control rabbit IgG (2 mg/ml, top) cleave normally. (b and c) Immunofluorescence images showing two microtubule asters near a single nucleus (N) in a cell from an embryo injected with control IgG (b), and two nuclei and two asters in a cell from a centriolin antibody–injected cell (c, microtubules stained with anti–α-tubulin). Bar, 10 μm (for b and c). (d) Quantification of results from injection experiments showing an approximately eightfold increase in cleavage failure (representative of three experiments). n, number of embryos examined.
Figure 7.
Figure 7.
siRNAs targeting centriolin induce G1/G0 arrest. (a) RPE-1 cells treated with centriolin siRNAs (blue) do not shift into the G2/M peak after nocodazole treatment as seen for control lamin siRNA–treated cells (red). (b) The inability of cells treated with centriolin siRNAs to shift into the G2/M peak is similar to that observed in serum-starved cells (blue, serum starved; red, not starved). (c) Ki-67 staining of control cells (left cell, green) occurs together with centriolin staining (left cell, red at arrow); both are gone in centriolin siRNA–treated cells (right, arrowhead). Bar, 7.5 μm. (d) Cells treated with siRNAs targeting centriolin lack Ki-67 staining (∼70%), whereas most control cells stain positively (GFP siRNAs). a, b, and d are representative experiments from five experiments for a, two for b, and three for d. n, total number cells counted.

References

    1. Andersen, S.S. 2000. Spindle assembly and the art of regulating microtubule dynamics by MAPs and Stathmin/Op18. Trends Cell Biol. 10:261–267. - PubMed
    1. Andreassen, P.R., O.D. Lohez, F.B. Lacroix, and R.L. Margolis. 2001. Tetraploid state induces p53-dependent arrest of nontransformed mammalian cells in G1. Mol. Biol. Cell. 12:1315–1328. - PMC - PubMed
    1. Bardin, A.J., and A. Amon. 2001. Men and sin: what's the difference? Nat. Rev. Mol. Cell Biol. 2:815–826. - PubMed
    1. Blomberg-Wirschell, M., and S.J. Doxsey. 1998. Rapid isolation of centrosomes. Methods Enzymol. 298:228–238. - PubMed
    1. Bobinnec, Y., A. Khodjakov, L.M. Mir, C.L. Rieder, C.L. Edde, and M. Bornens. 1998. Centriole disassembly in vivo and its effect on centrosome structure and function in vertebrate cells. J. Cell Biol. 143:1575–1589. - PMC - PubMed

Publication types

MeSH terms

Associated data