. 2003 May 5;197(9):1073-81.
doi: 10.1084/jem.20021603.

Myelin oligodendrocyte glycoprotein-specific T cell receptor transgenic mice develop spontaneous autoimmune optic neuritis

Affiliations

Myelin oligodendrocyte glycoprotein-specific T cell receptor transgenic mice develop spontaneous autoimmune optic neuritis

Estelle Bettelli et al. J Exp Med. .

Abstract

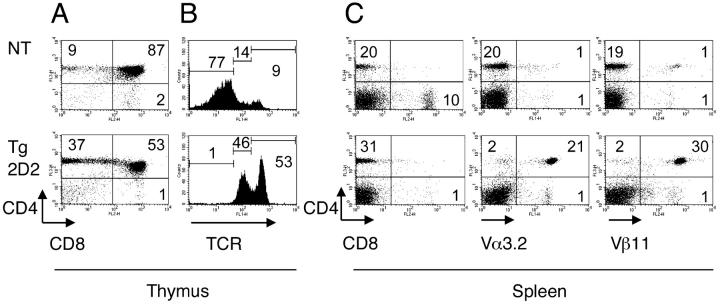
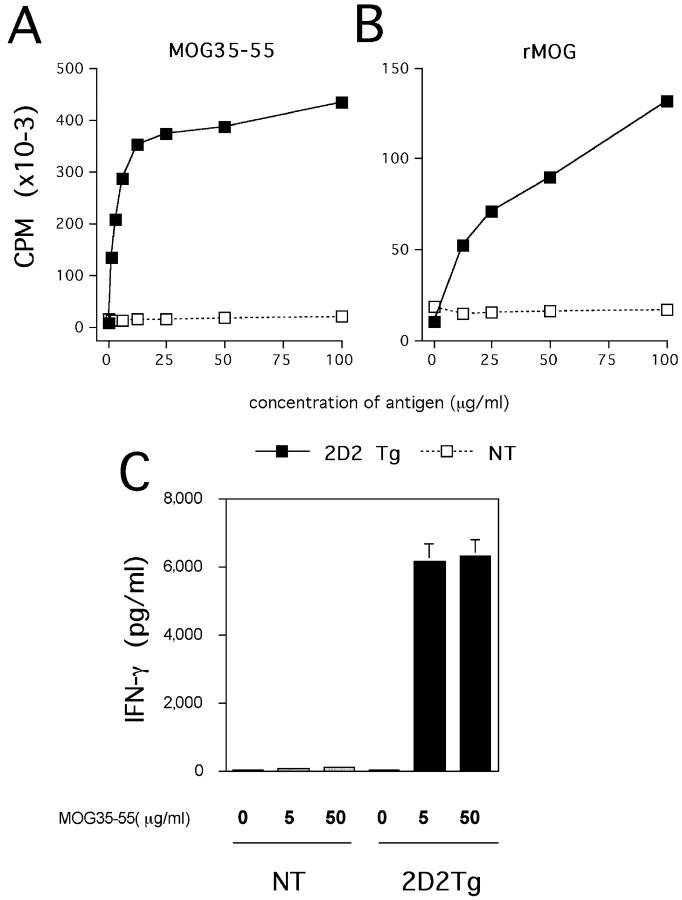
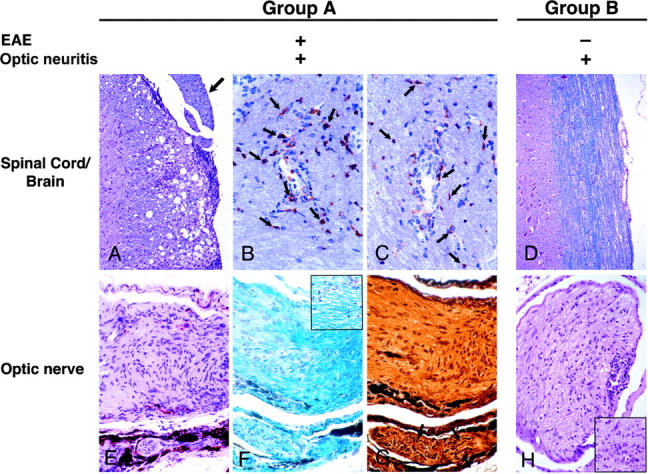
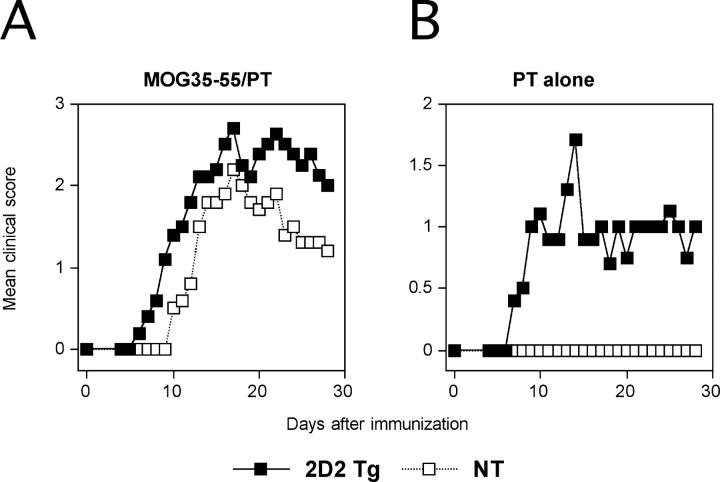
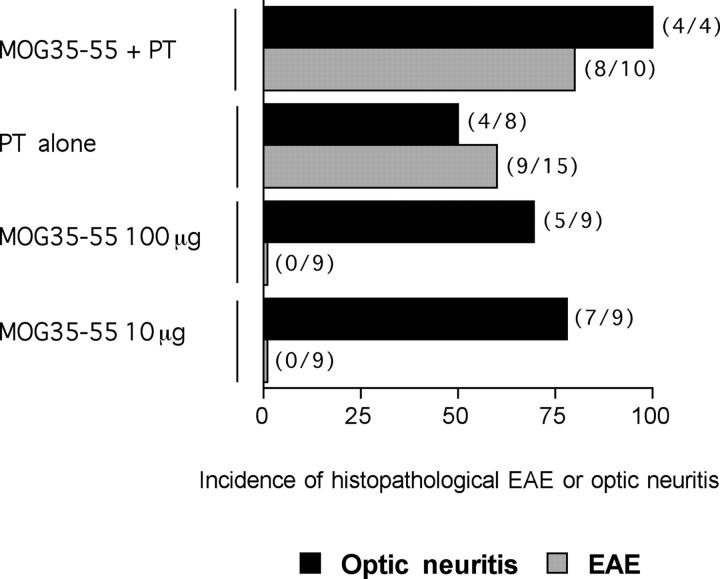
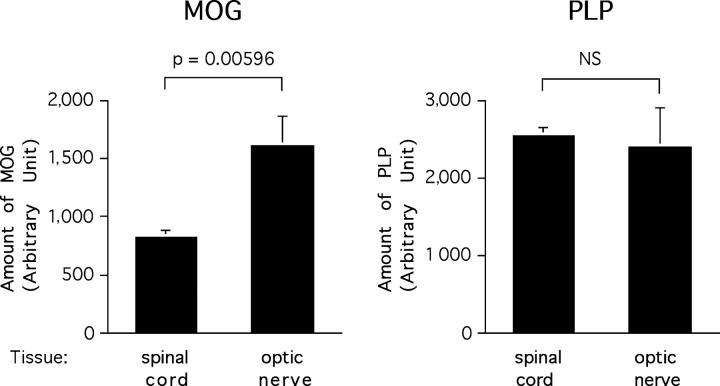
Multiple sclerosis (MS) is considered to be an autoimmune disease of the central nervous system (CNS) that in many patients first presents clinically as optic neuritis. The relationship of optic neuritis to MS is not well understood. We have generated novel T cell receptor (TCR) transgenic mice specific for myelin oligodendrocyte glycoprotein (MOG). MOG-specific transgenic T cells are not deleted nor tolerized and are functionally competent. A large proportion (>30%) of MOG-specific TCR transgenic mice spontaneously develop isolated optic neuritis without any clinical nor histological evidence of experimental autoimmune encephalomyelitis (EAE). Optic neuritis without EAE could also be induced in these mice by sensitization with suboptimal doses of MOG. The predilection of these mice to develop optic neuritis is associated with higher expression of MOG in the optic nerve than in the spinal cord. These results demonstrate that clinical manifestations of CNS autoimmune disease will vary depending on the identity of the target autoantigen and that MOG-specific T cell responses are involved in the genesis of isolated optic neuritis.


Figures

Figure 1.
Figure 1.
T cell populations in 2D2 MOG-specific TCR transgenic mice. Thymocytes (A and B) or splenocytes (C) from 6–8-wk-old 2D2 TCR transgenic mice (2D2 Tg) or nontransgenic littermates (NT) were stained with antibodies to CD4, CD8, TCRβ, Vβ11, and Vα3.2 and cells were analyzed by flow cytometry. The dot plots show two-color flow cytometry analysis of the thymocytes or splenocytes. B contains histograms showing TCR expression on total thymocytes.
Figure 2.
Figure 2.
Response of transgenic T cells to MOG 35–55 and MOG protein. Splenocytes from unimmunized mice were cultured with indicated concentrations of MOG 35–55 peptide (A) or recombinant protein MOG (B). T cell proliferation was determined by [3H]thymidine incorporation in triplicate wells in a 72-h proliferation assay. The mean cpm's in the presence of 50 μg/ml OVA 323–336 control peptide were 12,401 for TCR transgenic mice and 14,278 for the control littermates. Splenocytes produce IFN-γ in response to indicated concentrations of peptide MOG 35–55 (C). IFN-γ was measured on supernatants harvested 48 h after activation by ELISA. 2D2 Tg, 2D2 transgenic; NT, nontransgenic.
Figure 3.
Figure 3.
Histological analysis of CNS tissues from 2D2 TCR transgenic mice. (A) Typical meningeal and parenchymal mononuclear cell infiltrates associated with demyelination and edema in spinal cord of mouse with optic neuritis and clinical EAE. A spinal nerve root (peripheral nerve myelin) as indicated by an arrow is spared. Luxol fast blue and hematoxylin and eosin stain, ×206. (B) CD4+ cells (arrows) infiltrate cerebellar white matter. Cryosection with mAb GK1.5 immuno-peroxidase stain, ×308. (C) Similar numbers of cells in a section adjacent to B stain for TCR Vβ11. Cryosection with mAb RR3–15 immuno-peroxidase stain, ×308. (D) Intact spinal cord from mouse with optic neuritis but no clinical nor histologic EAE. Luxol fast blue and hematoxylin and eosin stain, ×206. (E) Longitudinal section of optic nerve from mouse with optic neuritis and EAE. Portions of an uninvolved oculomotor nerve (peripheral nerve myelin) are in the lower portion of the field. Hematoxylin and eosin stain, ×308. (F) Adjacent section to E demonstrating demyelination (pale area in left side of field) in optic neuritis. Blue staining on right side and in oculomotor nerve indicates preserved myelin. Inset: diffuse vacuolation of optic nerve myelin associated with few inflammatory cells. Klüver-Barrera stain, ×308. (G) Adjacent section to E and F showing intact silver-positive axons (arrows) in oculomotor nerve. Axons are lost in the optic nerve (center). Bielschowsky preparation, ×308. (H) Subpial and diffuse endoneurial mononuclear cell infiltrate in cross section of optic nerve of a transgenic mouse without EAE. Inset: higher power of an endoneurial mononuclear cell infiltrate. Hematoxylin and eosin stain, ×206; inset, ×308.
Figure 4.
Figure 4.
Induced EAE in 2D2 TCR transgenic mice. 2D2 TCR transgenic mice and nontransgenic littermates were immunized with MOG 35–55 peptide emulsified in CFA and injected with pertussis toxin (A) or injected with pertussis toxin only (B) and observed for the development of EAE over time. The data are presented as the mean disease score in each group during the course of observation. 2D2 Tg, 2D2 transgenic; NT, nontransgenic.
Figure 5.
Figure 5.
Suboptimal immunization protocols trigger optic neuritis but not EAE in 2D2 TCR transgenic mice. 2D2 TCR transgenic mice were immunized with 100 μg MOG 35–55 peptide emulsified in CFA and injected with pertussis toxin, immunized with 10 or 100 μg of the MOG 35–55 peptide alone, or injected with pertussis toxin only. The proportion of mice developing EAE or optic neuritis was evaluated by histological analysis of brains, spinal cords, and optic nerves. The number of mice developing EAE or optic neuritis in each group is indicated in parentheses on the right side of the histogram bar.
Figure 6.
Figure 6.
MOG is more expressed in the optic nerve than in the spinal cord. Optic nerves and spinal cords homogenates were assayed by SDS-PAGE for MOG and PLP expression using respective-specific antibodies. Histograms represent mean relative expression of MOG and PLP in optic nerves and spinal cords pooled from five C57Bl/6 mice and assayed in quadruplicates. The data presented were obtained at a protein loading of 16.6 μg/well and are representative of multiple analysis of three independent experiments. NS, not significant.

References

    1. Lassmann, H. 1998. Pathology of multiple sclerosis. McAlpine's Multiple Sclerosis. A. Compston, G. Ebers, H. Lassmann, I. McDonald, B. Matthews, and H. Wekerle, editors. Churchill Livingstone, Hong Kong. 323–358.
    1. Ghezzi, A., V. Martinelli, V. Torri, M. Zaffaroni, M. Rodegher, G. Comi, A. Zibetti, and N. Canal. 1999. Long-term follow-up of isolated optic neuritis: the risk of developing multiple sclerosis, its outcome, and the prognostic role of paraclinical tests. J. Neurol. 246:770–775. - PubMed
    1. Soderstrom, M. 2001. Optic neuritis and multiple sclerosis. Acta Ophthalmol. Scand. 79:223–227. - PubMed
    1. Zamvil, S.S., D.J. Mitchell, A.C. Moore, K. Kitamura, L. Steinman, and J.B. Rothbard. 1986. T-cell epitope of the autoantigen myelin basic protein that induces encephalomyelitis. Nature. 324:258–260. - PubMed
    1. Tuohy, V.K., Z. Lu, R.A. Sobel, R.A. Laursen, and M.B. Lees. 1989. Identification of an encephalitogenic determinant of myelin proteolipid protein for SJL mice. J. Immunol. 142:1523–1527. - PubMed

Publication types

Substances