. 2003 May 5;197(9):1141-51.
doi: 10.1084/jem.20021910.

Signal 3 determines tolerance versus full activation of naive CD8 T cells: dissociating proliferation and development of effector function

Affiliations

Signal 3 determines tolerance versus full activation of naive CD8 T cells: dissociating proliferation and development of effector function

Julie M Curtsinger et al. J Exp Med. .

Abstract

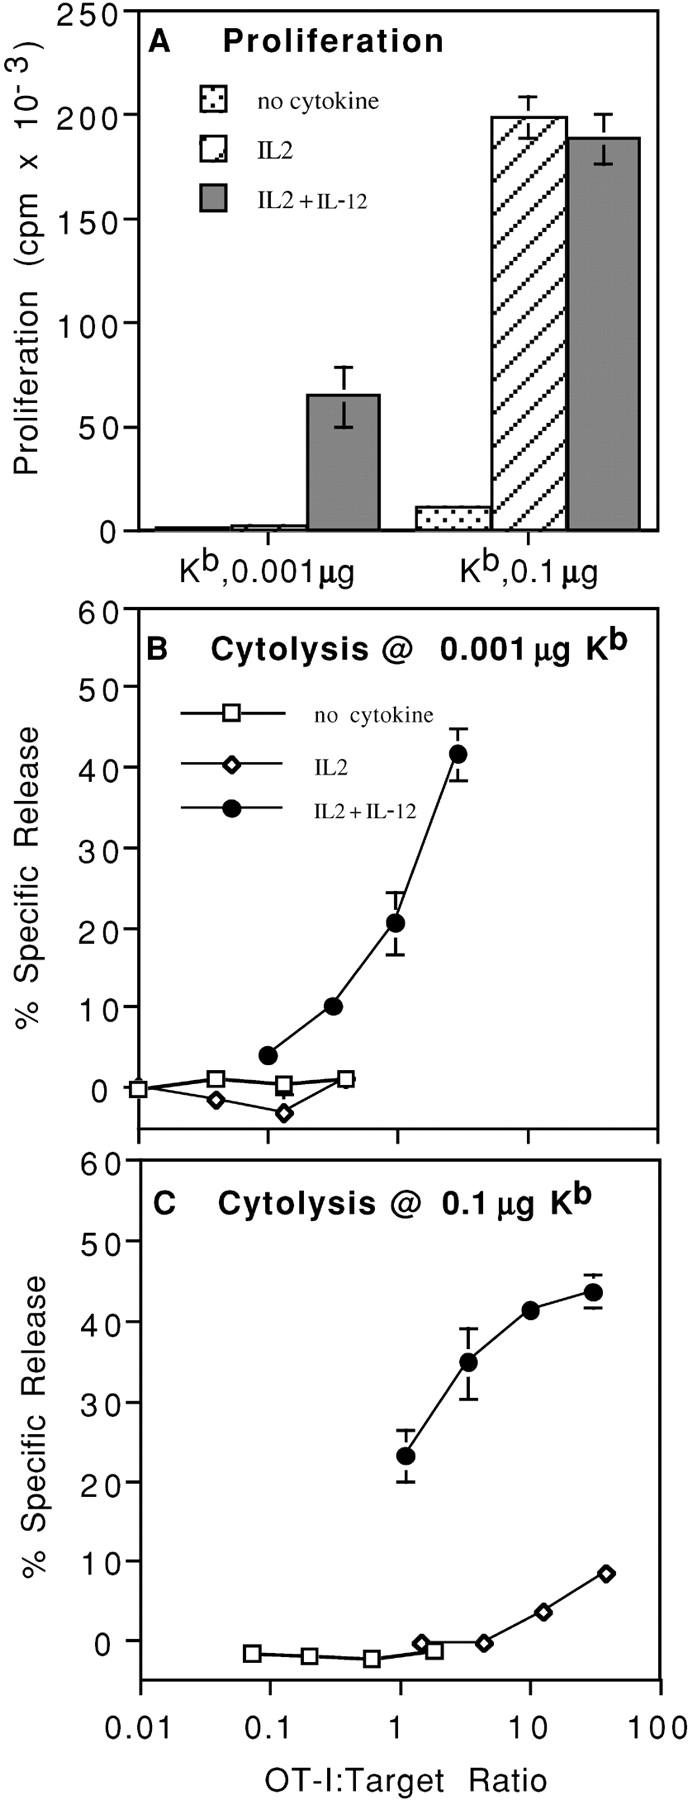
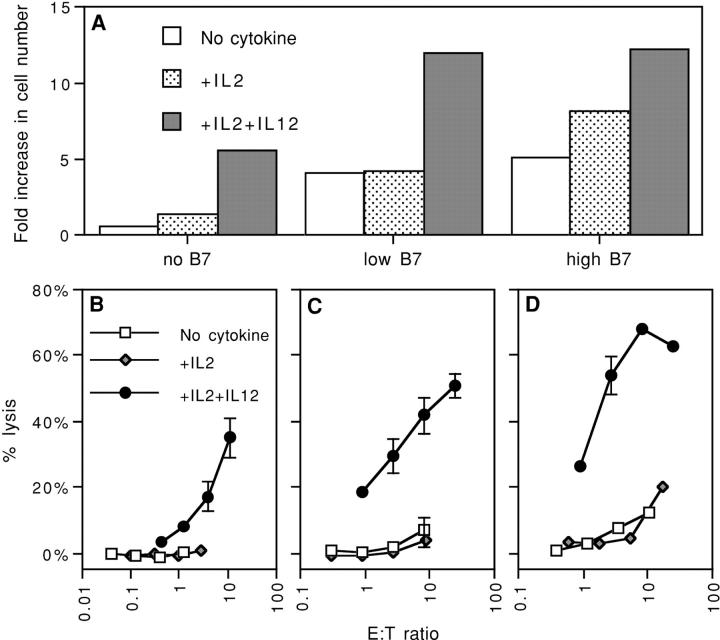
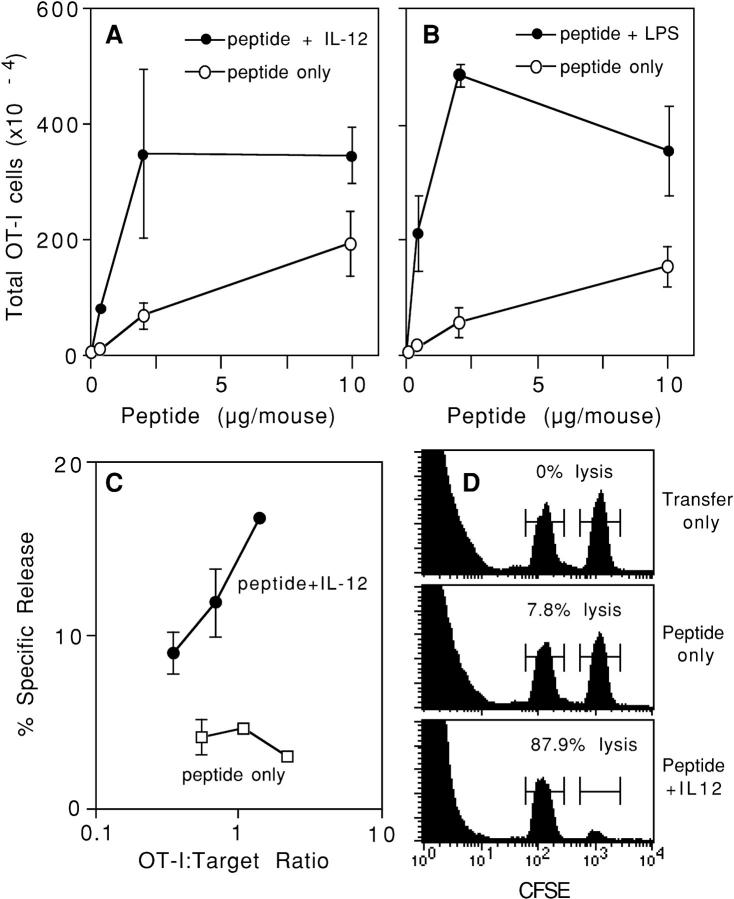
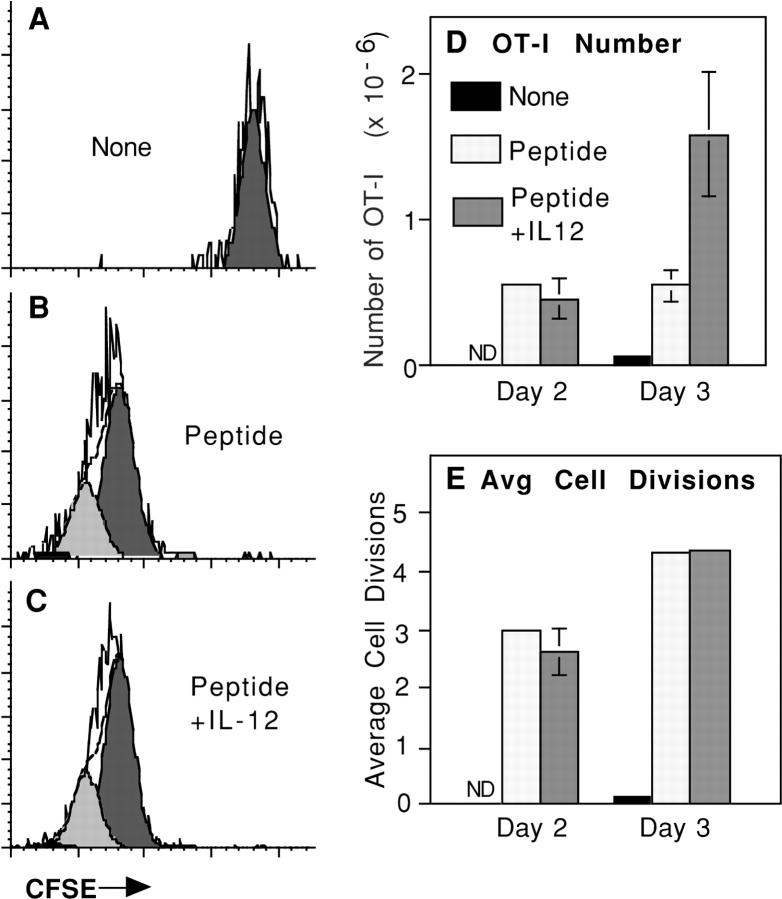
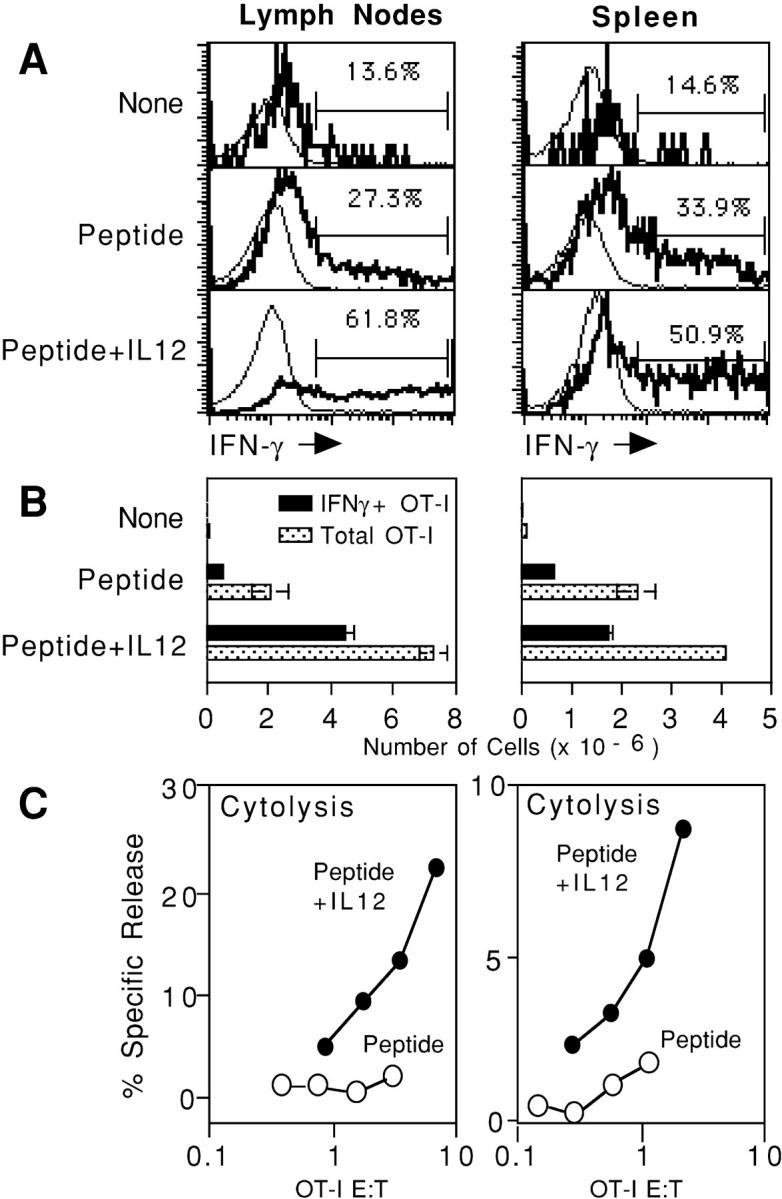
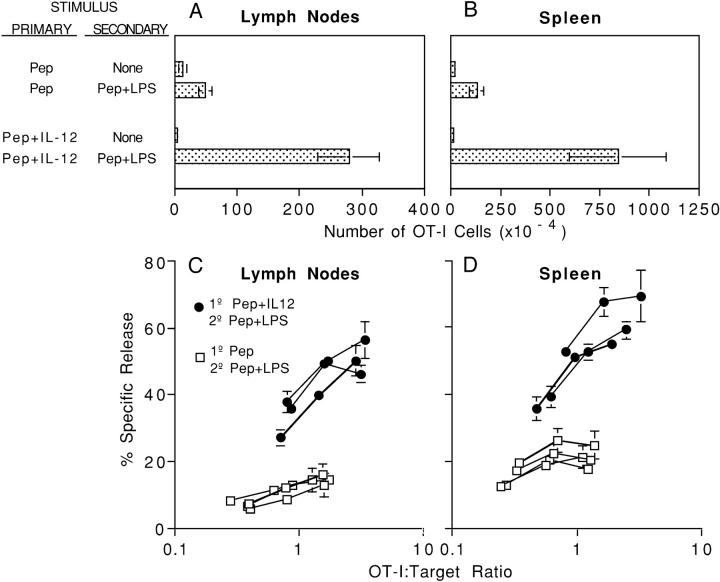
Activation of naive CD8 T cells to undergo clonal expansion and develop effector function requires three signals: (a) Ag, (b) costimulation, and (c) IL-12 or adjuvant. The requirement for the third signal to stimulate Ag-dependent proliferation is variable, making the greatest contribution when Ag levels are low. At high Ag levels, extensive proliferation can occur in vitro or in vivo in the absence of a third signal. However, despite having undergone the same number of divisions, cells that expand in the absence of a third signal fail to develop cytolytic effector function. Thus, proliferation and development of cytolytic function can be fully uncoupled. Furthermore, these cells are rendered functionally tolerant in vivo, in that subsequent restimulation with a potent stimulus results in limited clonal expansion, impaired IFN-gamma production, and no cytolytic function. Thus, the presence or absence of the third signal appears to be a critical variable in determining whether stimulation by Ag results in tolerance versus development of effector function and establishment of a responsive memory population.


Figures

Figure 1.
Figure 1.
IL-12 is required for both proliferation and development of effector function at low Ag levels, but only for development of effector function at high Ag levels. Microspheres were coated with either 0.1 or 0.001 μg Kb/OVA/106 microspheres. The Kb–OVA complex was prepared by refolding recombinant heavy chain in the presence of peptide and β2m, as described in Materials and Methods. (A) CD44low CD8+ OT-I cells were stimulated with microspheres in the presence of the indicated cytokines and proliferation was determined on day 2 by measuring incorporation of [3H]TdR. (B) CD44low CD8+ OT-I cells were stimulated with microspheres made using 0.001 μg Kb/OVA per 106 microspheres in cultures with the indicated cytokines. Cells were harvested on day 3 and a 4-h 51Cr release assay was done using E.G7 cells as targets. (C) As described in B, but using 0.1 μg Kb/OVA per 106 microspheres.
Figure 2.
Figure 2.
Costimulation does not replace a requirement for IL-12 for the induction of cytolytic function. Microspheres were coated with DimerX H-2Kb:Ig either alone or along with B7.1-Ig at low or high concentrations, and pulsed with OVA257–264 as described in Materials and Methods. These microspheres were used to stimulate MACS column-purified CD44low CD8+ OT-I cells in the presence of the indicated cyto-kines. (A) Proliferation was determined by counting the number of viable cells after 3 d of culture and expressed as the fold increase over input cell number. (B) Cells were assayed for lytic activity on day 3 using a 4-h 51Cr release assay using E.G7 cells as targets. Results are expressed as percent-specific lysis at various effector/target cell ratios.
Figure 3.
Figure 3.
In vivo activation of CD8+ cells with high Ag dose stimulates proliferation but not lytic effector function. (A) C57BL/6 mice received OT-I/PL LN cells by adoptive transfer on day −1 and were challenged on day 0 with the indicated amounts of OVA257–264 peptide either alone or with 1 μg/ mouse of IL-12. Spleens were harvested on day 4, and the number of OT-I/PL cells was determined by flow cytometry analysis as described in Materials and Methods. The values shown are averages of duplicate mice and the error bars represent the ranges. (B) C57BL/6 mice received OT-I/PL LN cells by adoptive transfer on day −1 and were challenged on day 0 with the indicated amounts of OVA257–264 peptide either alone or with 50 μg/mouse of LPS. Spleens were harvested on day 3, and the number of OT-I/PL cells was determined by flow cytometry. The values shown are averages of duplicate mice and the error bars represent the ranges. (C) Spleen cells from the animals described in A that received 10 μg of peptide, with and without IL-12, were assayed for lytic activity against 51Cr-labeled E.G7 targets at spleen cell/target ratios of 200, 100, 50, and 25:1. These ratios were converted to OT-I/PL target ratios by multiplying by the percent OT-I/PL cells in each spleen cell population. The results shown are for one of the two animals in each treatment group; splenocytes from the other animal in each group showed essentially identical lytic activity. (D) C57BL/6 mice received OT-I/PL LN cells by adoptive transfer on day −1 and were left unchallenged (transfer only) or challenged with 10 μg OVA257–264/mouse alone (peptide only) or with 1 μg/mouse of IL-12 (peptide + IL-12). On day 3, mice were injected with equal numbers of unpulsed and OVA257–264-pulsed C57BL/6 spleen cells that were labeled with low and high concentrations of CFSE, respectively. Spleens were harvested after 3 h and the cells were analyzed for the preferential loss of peptide-pulsed, CFSEhigh versus unpulsed, CFSElow target cells. Histograms show the CFSEhigh and CFSElow cells from one of two identically treated mice; the percent lysis, calculated as described in Materials and Methods, is indicated.
Figure 4.
Figure 4.
OT-I/PL cells from mice immunized with peptide alone or peptide and IL-12 undergo comparable numbers of divisions. C57BL/6 mice received CFSE-labeled OT-I/PL LN cells by adoptive transfer on day −1 and were left unchallenged or challenged with 2 μg OVA257–264/mouse either alone or with 1 μg/mouse of IL-12 on day 0. On days 2 and 3, LN cells were analyzed by flow cytometry to determine the number of OT-I/PL cells in each animal, and the amount of cell division by OT-I/PL cells was determined by analyzing CFSE fluorescence using ModFit software. (A–C) CFSE fluorescence of LN cells from mice immunized as indicated, gated on CD8+ Thy1.1+ populations. The open histograms are the CFSE profiles, and the shaded histograms represent the subpopulations of cells that have undergone the same numbers of divisions as determined by deconvolution of the CFSE profiles using ModFit software. The fluorescence intensity of the endogenous cells was about twofold lower than that of the CFSE-labeled cells (not depicted), demonstrating that the OT-I cells being examined have not become CFSE negative. (D) Comparison of the number of OT-I/PL cells recovered on days 2 and 3. (E) Comparison of the average number of cell divisions, calculated using ModFit software, on days 2 and 3 after immunization.
Figure 5.
Figure 5.
CD8+ T cells stimulated by peptide in the absence or presence of IL-12 develop the ability to produce the effector cytokine IFN-γ. C57BL/6 mice received OT-I/PL LN cells by adoptive transfer on day −1 and were left unchallenged or challenged with 10 μg OVA257–264/mouse either alone or with 1 μg/mouse of IL-12 on day 0. (A) On day 3, LN and spleen cells were harvested and incubated in vitro with peptide; cells were fixed, permeabilized, and stained to detect IFN-γ production as described previously in Materials and Methods. Histograms are gated on endogenous CD8+ (Thy1.1-negative lymphocytes [thin line]) or gated on transgenic CD8+ (Thy1.1-positive lymphocytes [bold line]). The percentage of OT-I/PL cells expressing IFN-γ is shown. Results shown are for one of two animals in each group; results were essentially the same for the other animal in each group. (B) On day 3, LN and spleen cells were analyzed by flow cytometry to determine the number of OT-I/PL cells in each animal, and the total number of IFN-γ–producing OT-I/PL cells was calculated by multiplying the percent IFN-γ+ by the total number of OT-I/PL cells. Results shown are the average from two animals; error bars represent the range. (C) On day 3, LN and spleen cells were assayed for lytic activity against 51Cr-labeled E.G7 targets at LN or spleen cell:target cell ratios of 100, 50, 25, and 12.5:1. These ratios were converted to OT-I/PL target ratios by multiplying by the percent OT-I/PL cells in each LN or spleen cell population. The results shown are for one of the two animals in each treatment group, the other animal in each group showed essentially identical lytic activity.
Figure 6.
Figure 6.
CD8+ T cells that expand in vivo in response to peptide in the absence of IL-12 are unable to develop lytic effector function after secondary challenge with peptide and adjuvant. C57BL/6 mice received 3 × 10⁶ OT-I/PL LN cells by adoptive transfer on day −1 and were challenged on day 0 with 10 μg OVA257–264 either alone or with 1 μg/mouse of IL-12. After 40 d, mice were left unchallenged, or were rechallenged with 10 μg OVA257–264 with 50 μg LPS. (A and B) After an additional 3 d, LN and spleen cells were analyzed by flow cytometry to determine the number of OT-I/PL cells in each mouse. Results shown for mice that did not receive a secondary challenge are the average of two animals; error bars represent the range. Results for mice that were rechallenged with peptide and LPS represent the average of four (primary with peptide) or three (primary with peptide + IL-12) animals; SDs are shown. (C and D) LN and spleen cells from animals that were rechallenged with peptide and LPS were assayed for lytic activity against 51Cr-labeled E.G7 targets at total viable cell:target ratios of 100, 50, 25, and 12.5:1. These ratios were converted to OT-I/PL ratios based on the percentage of OT-I/PL cells in each population. Results for the individual mice in each group are shown. LN and spleen cells from mice that did not receive a secondary challenge with peptide and LPS had no lytic activity at this time, whether the primary challenge was with peptide alone or peptide and IL-12 (not depicted). The results shown are from one of four essentially identical experiments.
Figure 7.
Figure 7.
CD8+ T cells that expand in vivo in response to peptide in the absence of IL-12 have reduced ability to produce IFN-γ after secondary challenge with peptide and adjuvant. LN and spleen cells from the mice described in Fig. 6 that were rechallenged with peptide and LPS were incubated in vitro with OVA257-264 peptide for 5 h; cells were fixed, permeabilized, and stained to detect IFN-γ production as described in Materials and Methods. (A and B) The percentage of OT-I cells in the LN and spleen that were producing IFN-γ is shown. (C and D) The geometric mean fluorescence intensity of IFN-γ staining in the IFN-γ + OT-I cells is shown. Results in A–D are the averages of four (primary with peptide) and three (primary with peptide + IL-12) mice; SDs are shown.

References

    1. Aichele, P., K. Brduscha-Reim, R. Zinkernagel, H. Hengartner, and H. Pircher. 1995. T cell priming versus T cell tolerance induced by synthetic peptides. J. Exp. Med. 182:261–266. - PMC - PubMed
    1. Allison, J., I.L. Campbell, G. Morahan, T.E. Mandel, L.C. Harrison, and J.F. Miller. 1988. Diabetes in transgenic mice resulting from over-expression of class I histocompatibility molecules in pancreatic beta cells. Nature. 333:529–533. - PubMed
    1. Burkly, L.C., D. Lo, O. Kanagawa, R.L. Brinster, and R.A. Flavell. 1989. T-cell tolerance by clonal anergy in transgenic mice with nonlymphoid expression of MHC class II I-E. Nature. 342:564–566. - PubMed
    1. Ferber, I., G. Schonrich, J. Schenkel, A. Mellor, G. Hammerling, and B. Arnold. 1994. Levels of peripheral T cell tolerance induced by different doses of tolerogen. Science. 263:674–676. - PubMed
    1. Kyburz, D., P. Aichele, D. Speiser, H. Hengartner, R. Zinkernagel, and H. Pircher. 1993. T cell immunity after a viral infection versus T cell tolerance induced by soluble viral peptides. Eur. J. Immunol. 23:1956–1962. - PubMed

Publication types