. 2003 May 13;100(10):6221-6.
doi: 10.1073/pnas.1031520100. Epub 2003 May 5.

Amyloid-beta peptide levels in brain are inversely correlated with insulysin activity levels in vivo

Affiliations

Amyloid-beta peptide levels in brain are inversely correlated with insulysin activity levels in vivo

Bonnie C Miller et al. Proc Natl Acad Sci U S A. .

Abstract

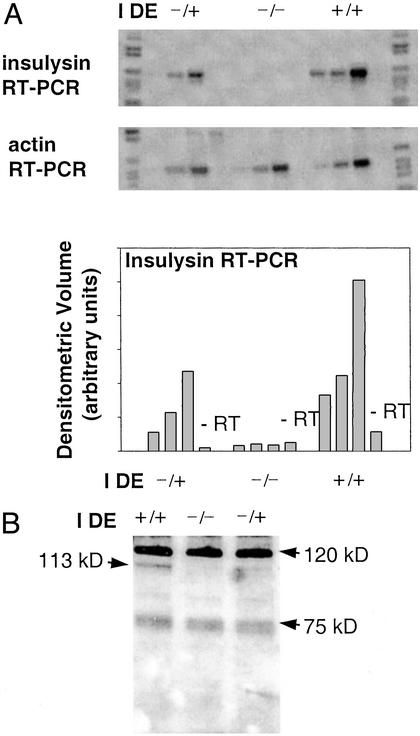
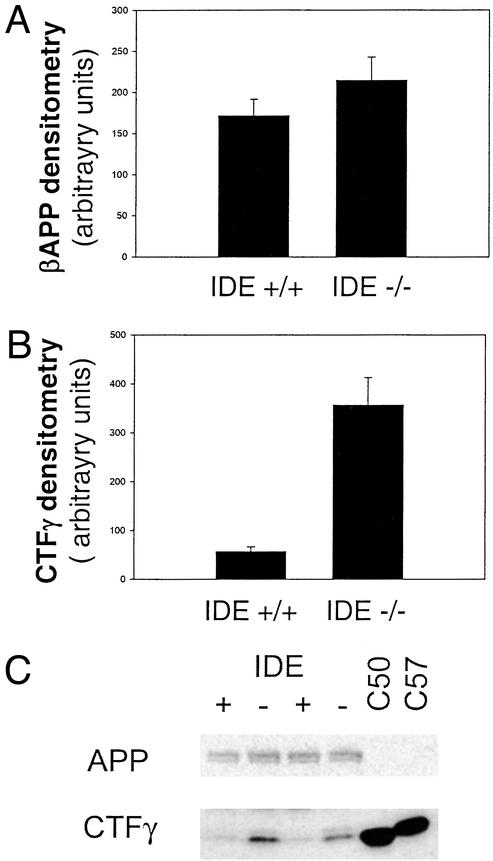
Factors that elevate amyloid-beta (Abeta) peptide levels are associated with an increased risk for Alzheimer's disease. Insulysin has been identified as one of several proteases potentially involved in Abeta degradation based on its hydrolysis of Abeta peptides in vitro. In this study, in vivo levels of brain Abeta40 and Abeta42 peptides were found to be increased significantly (1.6- and 1.4-fold, respectively) in an insulysin-deficient gene-trap mouse model. A 6-fold increase in the level of the gamma-secretase-generated C-terminal fragment of the Abeta precursor protein in the insulysin-deficient mouse also was found. In mice heterozygous for the insulysin gene trap, in which insulysin activity levels were decreased approximately 50%, brain Abeta peptides were increased to levels intermediate between those in wild-type mice and homozygous insulysin gene-trap mice that had no detectable insulysin activity. These findings indicate that there is an inverse correlation between in vivo insulysin activity levels and brain Abeta peptide levels and suggest that modulation of insulysin activity may alter the risk for Alzheimer's disease.


Figures

Figure 1
Figure 1
Liver insulysin expression in IDE gene-trap mice. (A) Equal amounts of total RNA from sex-matched littermates carrying one (IDE−/+), no (IDE−/−), or two (IDE+/+) copies of the wild-type IDE allele were reverse-transcribed (+RT) or treated identically but without addition of reverse transcriptase (−RT). Portions of the same reverse-transcribed RNA were subjected to PCR with insulysin-specific primers (Top) and β-actin-specific primers (Middle) over a range of cycles (22, 24, and 26 cycles for the +RT insulysin samples and 26 cycles for the −RT insulysin samples; 12, 14, and 16 for the +RT actin and 16 cycles for the −RT actin sample). The insulysin PCR products were displayed by hybridization with a DIG nucleotide-labeled insulysin probe and chemiluminescent detection as described in Materials and Methods. Densitometric quantitation of the insulysin products is displayed in Bottom. (B) Equal amounts of liver protein (10 μg per lane) were resolved by SDS/PAGE and analyzed by Western blotting with an antibody elicited with recombinant rat insulysin. The location of the 113-kDa insulysin protein is indicated.
Figure 2
Figure 2
Liver insulysin activity in IDE gene-trap mice. Shown are HPLC chromatograms of assays of insulysin activity in liver extracts from an IDE+/+ mouse (trace B), an IDE+/− mouse (trace C), and an IDE−/− mouse (trace D), as well as a control incubation with the substrate β-endorphin (β-Ep) alone (trace A). The chromatograms are offset so that all peaks can be seen. Peak a, β-Ep-(17–31); peak b, β-Ep-(18–31); peak c, β-Ep-(1–17) (γ-endorphin), peak d, β-Ep-(1–18); peak e, an unidentified secondary cleavage product.
Figure 3
Figure 3
Brain insulysin mRNA and immunoreactive protein levels are decreased in heterozygote IDE−/+ mice. (A) Relative insulysin mRNA levels in two sets of mice consisting of one wild-type (WT) and two heterozygote (IDE−/+) sex-matched littermates were determined by real-time PCR using the comparative cycle threshold method, assigning a value of 1 to the WT sample in each set. Insulysin mRNA levels were normalized to 18S rRNA levels in each sample. (B) Two different quantities of brain homogenate protein (10 and 5 μg) from two IDE+/+ and two IDE−/+ mice were resolved by SDS/PAGE and analyzed by Western blotting with the insulysin peptide-specific antibody, hIDE7–24. The blot is representative of three independent comparisons from IDE−/+ and IDE+/+ mice. (C) Equal quantities of brain homogenate protein (30 μg) from an IDE−/− mouse and wild-type, IDE+/+ littermate were resolved by SDS/PAGE and analyzed by Western blotting with the antibody elicited with recombinant rat insulysin.
Figure 4
Figure 4
Aβ peptide accumulation is increased in insulysin-deficient mice. Aβ40 (A) and Aβ42 (B) were quantified by ELISA in brain diethylamine extracts. Two-way ANOVA revealed a significant effect of both IDE genotype and age on the steady-state levels of Aβ40 (P < 0.0001 for both effects) and Aβ42 (P < 0.001 and P = 0.002, respectively). The post hoc Student–Neuman–Keuls test indicated that, for both peptides, the mean values for the three different genotypes were statistically different from each other. In young, adult (8- to 10-wk) IDE+/+ (n = 3), IDE+/− (n = 3), and IDE−/− (n = 4) mice, the mean Aβ40 levels were 1.05, 1.40, and 1.70 pmol/g, respectively, and the mean Aβ42 levels were 0.39, 0.48, and 0.56 pmol/g. In the older (20-wk) IDE+/+ (n = 2), IDE+/− (n = 4), and IDE−/− (n = 3) mice, the mean Aβ40 levels were 1.36, 1.69, and 1.97 pmol/g, respectively, whereas the mean Aβ42 levels were 0.46, 0.53, and 0.59 pmol/g.
Figure 5
Figure 5
APP levels are unchanged in insulysin-deficient mice, whereas CTFγ fragment levels are elevated. APP (A) and CTFγ (B) were detected by Western blot analysis using the O443 antibody against the C-terminal 20 residues of APP, and their relative levels were determined by densitometry of the scanned images. The values presented for both peptides are the mean ± SEM from eight IDE+/+ and six IDE−/− mice. Representative Western blots are shown in C.

References

    1. Hardy J, Selkoe D J. Science. 2002;297:353–356. - PubMed
    1. Sambamurti K, Greig N H, Lahiri D K. Neuromol Med. 2002;1:1–31. - PubMed
    1. Kamal A, Almenar-Queralt A, LeBlanc J F, Roberts E A, Goldstein L S. Nature. 2001;414:643–648. - PubMed
    1. Nunan J, Small D H. FEBS Lett. 2000;483:6–10. - PubMed
    1. Kurochkin I V, Goto S. FEBS Lett. 1994;345:33–37. - PubMed

Publication types