Comparative Study
. 2003;2(1):7.
doi: 10.1186/1475-4924-2-7. Epub 2003 Apr 24.

Differences in the way a mammalian cell and yeast cells coordinate cell growth and cell-cycle progression

Affiliations
Comparative Study

Differences in the way a mammalian cell and yeast cells coordinate cell growth and cell-cycle progression

Ian Conlon et al. J Biol. 2003.

Abstract

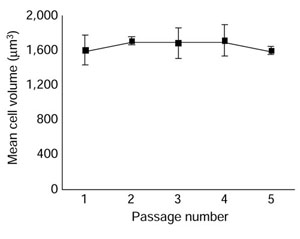
Background: It is widely believed that cell-size checkpoints help to coordinate cell growth and cell-cycle progression, so that proliferating eukaryotic cells maintain their size. There is strong evidence for such size checkpoints in yeasts, which maintain a constant cell-size distribution as they proliferate, even though large yeast cells grow faster than small yeast cells. Moreover, when yeast cells are shifted to better or worse nutrient conditions, they alter their size threshold within one cell cycle. Populations of mammalian cells can also maintain a constant size distribution as they proliferate, but it is not known whether this depends on cell-size checkpoints.

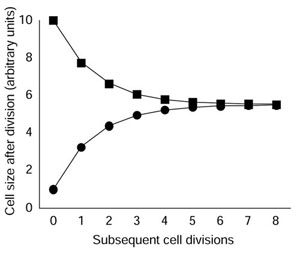
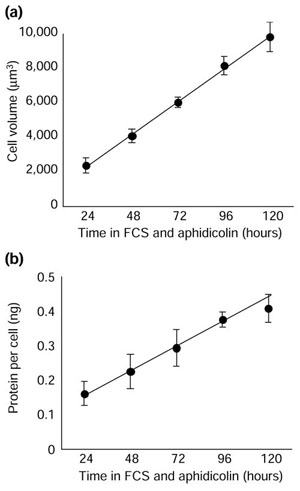
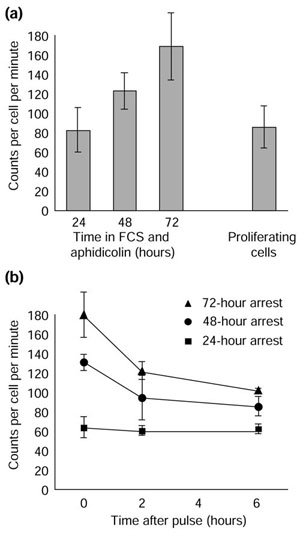
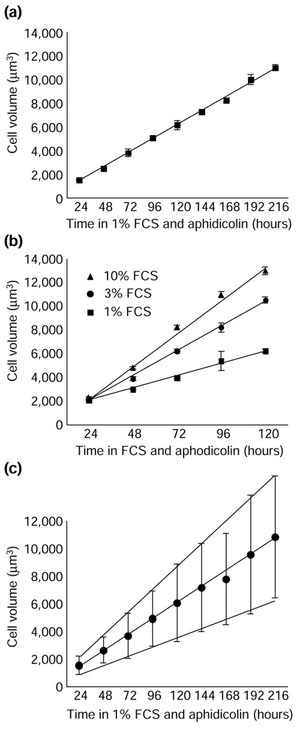
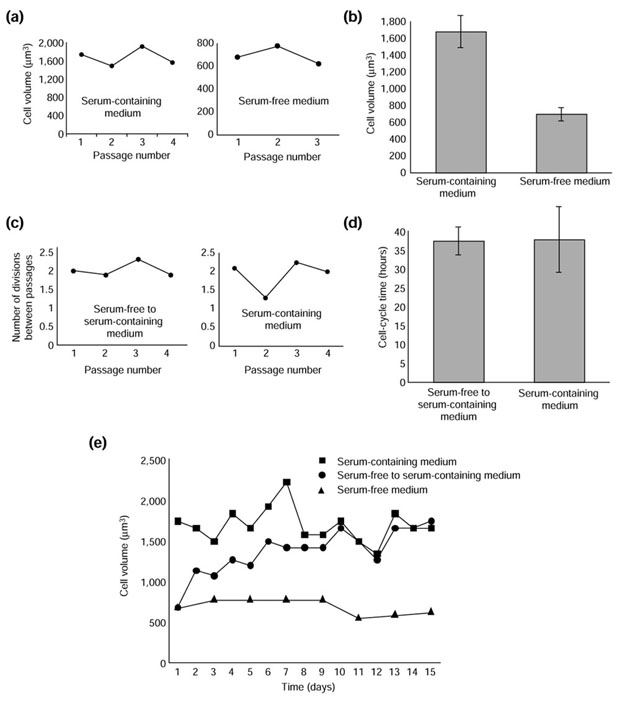
Results: We show that proliferating rat Schwann cells do not require a cell-size checkpoint to maintain a constant cell-size distribution, as, unlike yeasts, large and small Schwann cells grow at the same rate, which depends on the concentration of extracellular growth factors. In addition, when shifted from serum-free to serum-containing medium, Schwann cells take many divisions to increase their size to that appropriate to the new condition, suggesting that they do not have cell-size checkpoints similar to those in yeasts.

Conclusions: Proliferating Schwann cells and yeast cells seem to use different mechanisms to coordinate their growth with cell-cycle progression. Whereas yeast cells use cell-size checkpoints, Schwann cells apparently do not. It seems likely that many mammalian cells resemble Schwann cells in this respect.


Figures

Figure 1
Figure 1
A hypothetical model showing why the progeny of large and small daughter cells eventually return to the mean population size over time if large and small cells grow and progress through the cell cycle at the same rates (after Brooks [10]). The initial division is unequal and produces one cell of 10 mass units and one cell of 1 mass unit; the subsequent eight divisions of the progeny cells are equal. Following the first division, each cell grows 5.5 mass units in each cycle. Thus, the initial small daughter cell grows to 6.5 units before it divides to produce two daughters of about 3.2 units each, while the initial large daughter cell grows to 15.5 units before it divides to produce two daughters of about 7.8 units.
Figure 2
Figure 2
Mean cell volume remains constant as purified Schwann cells proliferate in complete medium and are passaged every three days. Their volume at passage was measured in a Coulter Counter. Each point represents the mean ± standard deviation of three cultures.
Figure 3
Figure 3
The growth of aphidicolin-arrested Schwann cells is linear over time, indicating that it is independent of cell size. (a) Quiescent cells were cultured in complete medium with aphidicolin to arrest the cells in S phase. Cell volume was measured in a Coulter Counter at the time points indicated. Each point represents the mean ± standard deviation of the results derived from three independent experiments, where, for each experiment, the mode cell volumes of three plates were measured and averaged. (b) Cells were cultured as in (a), but protein per cell, rather than cell volume, was measured at the time points shown. The results are shown as the mean ± standard deviation of three cultures in one experiment, in which about 106 cells were assayed for each point. The experiments in (a) and (b) were performed three times with similar results.
Figure 4
Figure 4
Large Schwann cells synthesize and degrade protein faster than smaller cells. (a) Quiescent cells were cultured in 3% FCS, forskolin, and aphidicolin for various times. The rate of protein synthesis was then determined by measuring the amount of incorporation of [35S]-methionine and [35S]-cysteine into cellular protein over 2 hours. The rate of protein synthesis in proliferating cells is shown for comparison. The results are shown as the mean ± standard deviation of nine independent plates of cells. (b) Quiescent cells were treated as in (a) and then either harvested immediately (0 hours after pulse) to assess the rate of total protein synthesis or washed and 'chased' with medium containing non-radioactive methionine and cysteine for 2 or 6 hours before harvesting to assess the rate of protein degradation. Each point represents the mean and range of three independent cultures. The rate of protein degradation is indicated by the slope of the line. The shallowness of the curve for the 24-hour-arrested cells is likely to be the result of the lower than expected value at 0 hours. The 0 hour result in (a) is likely to be more accurate, as it represents the mean of nine independent cultures, instead of three. If one uses the value of 80, the curve in (b) for the 24-hour-arrested cells would be steeper. The experiments in (a) and (b) were performed three times with similar results.
Figure 5
Figure 5
Schwann cell growth remains linear for 9 days but increases with increasing concentrations of serum. In (a) the cells were cultured in 1% FCS, forskolin, and aphidicolin, while in (b) they were cultured in forskolin and aphidicolin and various concentrations of FCS. Cell volume was measured in a Coulter Counter at the time points indicated. Each point represents the mean ± standard deviation of at least three cultures. The experiments were performed at least three times with similar results. (c) The cells were cultured as in (a), but each point represents the mean ± standard deviation of cell volumes from one plate of cells.
Figure 6
Figure 6
Schwann cells adjust their size slowly when shifted from serum-free (SF) medium to serum-containing (SC) medium. The cells were plated at 100,000 cells per well and were passaged when they reached a density of about 300,000 cells per well. (a,b) The mean volume of cells proliferating in either SC or SF medium was measured in a Coulter Counter at the time of passage. The raw data for each condition are shown in (a), and the mean ± standard deviation of the mode cell volume at passage is shown in (b). (c,d) The cell-cycle time of Schwann cells proliferating either in SC medium or in SC medium after a shift from SF medium was measured by determining the rate at which cell number increased. The raw data for each condition are shown in (c), and the mean ± standard deviation of four population-doubling times is shown in (d). (e) The size of cells proliferating in SC medium, in SF medium, or in SC medium after a shift from SF medium ('switched' cells) was measured every day in a Coulter Counter. Because the cells in SC medium and the switched cells had similar cycle times see (d) they were passaged about every 3 days in both cases, when they reached around 300,000 cells per well; the cells in SF medium cycled more slowly and were thus passaged less often. These experiments were performed three times with similar results.
Figure 7
Figure 7
Schwann cells need to be passaged to maintain their size. Cells were cultured in serum-containing medium, with or without passaging on day 4. In both cases, 100,000 cells were plated per well, and the medium was changed every day. Mode cell volume (a) and cell number (b) were measured every day in a Coulter Counter. The experiment was performed twice with similar results.

References

    1. Mitchison JM. The Biology of the Cell Cycle. Cambridge: Cambridge University Press; 1971.
    1. Conlon IJ, Dunn GA, Mudge AW, Raff MC. Extracellular control of cell size. Nat Cell Biol. 2001;3:918–921. - PubMed
    1. Alberts B, Bray D, Johnson A, Lewis J, Raff M, Roberts K, Walter P. Essential Cell Biology. New York Garland Publishing; 1998.
    1. Fantes PA, Nurse P. Control of the timing of cell division in fission yeast. Cell size mutants reveal a second control pathway. Exp Cell Res. 1978;115:317–329. - PubMed
    1. Nurse P, Thuriaux P. Controls over the timing of DNA replication during the cell cycle of fission yeast. Exp Cell Res. 1977;107:365–375. - PubMed

Publication types

MeSH terms